

Abstract
Glacier health across High Mountain Asia (HMA) is highly heterogeneous and strongly governed by regional climate, which is variably influenced by monsoon dynamics and the westerlies. We explore four decades of glacier energy and mass balance at three climatically distinct sites across HMA by utilising a detailed land surface model driven by bias-corrected Weather Research and Forecasting meteorological forcing. All three glaciers have experienced long-term mass losses (ranging from −0.04 ± 0.09 to −0.59 ± 0.20 m w.e. a−1) consistent with widespread warming across the region. However, complex and contrasting responses of glacier energy and mass balance to the patterns of the Indian Summer Monsoon were evident, largely driven by the role snowfall timing, amount and phase. A later monsoon onset generates less total snowfall to the glacier in the southeastern Tibetan Plateau during May–June, augmenting net shortwave radiation and affecting annual mass balance (−0.5 m w.e. on average compared to early onset years). Conversely, timing of the monsoon's arrival has limited impact for the Nepalese Himalaya which is more strongly governed by the temperature and snowfall amount during the core monsoon season. In the arid central Tibetan Plateau, a later monsoon arrival results in a 40 mm (58%) increase of May–June snowfall on average compared to early onset years, likely driven by the greater interaction of westerly storm events. Meanwhile, a late monsoon cessation at this site sees an average 200 mm (192%) increase in late summer precipitation due to monsoonal storms. A trend towards weaker intensity monsoon conditions in recent decades, combined with long-term warming patterns, has produced predominantly negative glacier mass balances for all sites (up to 1 m w.e. more mass loss in the Nepalese Himalaya compared to strong monsoon intensity years) but sub-regional variability in monsoon timing can additionally complicate this response.
Export citation and abstract BibTeX RIS

Original content from this work may be used under the terms of the Creative Commons Attribution 4.0 license. Any further distribution of this work must maintain attribution to the author(s) and the title of the work, journal citation and DOI.
1. Introduction
Melt water from glacier ice and snow is a vital component of the world's water towers which serve billions of people globally (Immerzeel et al 2020), particularly in the lowland regions surrounding High Mountain Asia (HMA). Glacier melt at the world's 'Third Pole' can significantly modify regional hydrology and buffer periods of very dry conditions (Pritchard et al 2017, Viviroli et al 2020), promote natural hazards such as glacier lake outburst floods (Veh et al 2020) and contribute to global sea level rise (Zemp et al 2019). Accordingly, glacier health in HMA is highly important to water security, though it is highly heterogeneous in space and largely unsustainable (Sakai and Fujita 2017, Hugonnet et al 2021, Miles et al 2021). This high heterogeneity is governed, at least in part, by the dynamics and varying extent of the Indian Summer Monsoon (hereafter 'monsoon'), and intrusion of mid-latitude westerlies (Mölg et al 2014, Forsythe et al 2017, Li et al 2018). The monsoon controls the summer-season energy-mass-balance of HMA glaciers due to the coincidence of warm, overcast and wet weather conditions (Fugger et al 2022), and the timing of monsoon arrival, as well as its duration, has been shown to control the surface energy and mass balance of some mountain glaciers due to its determination of the phase and intensity of early summer precipitation (Mölg et al 2012). However, westerly intrusions during the pre-monsoon period can also greatly affect the annual glacier mass balance (Mölg et al 2014), particularly for regions where the monsoon accounts for a smaller proportion of the total annual precipitation (figure 1(a)).
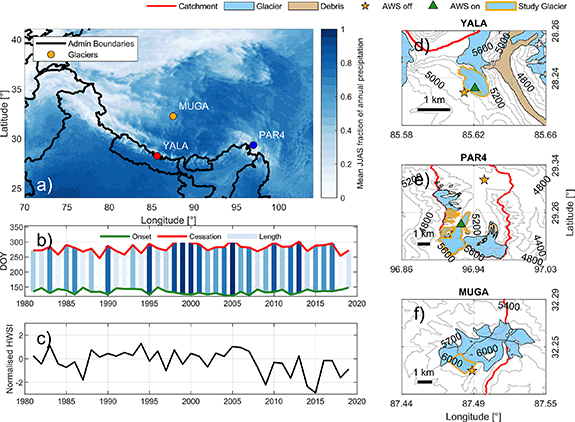
Figure 1. The monsoon characteristics and location of the three glacier study sites across HMA. (a) indicates the mean summer (June–September) fraction of annual total precipitation across HMA derived from WRF (1981–2019). The onset and cessation dates derived for the Bay of Bengal region are indicated in (b). (c) shows the normalised June–September horizontal wind shear index (HWSI—section 2.5) which is used here as a measure of interannual monsoon intensity. Study sites are shown for YALA (d), PAR4 (e) and MUGA (f), with the study glaciers highlighted in orange and the catchment delineations shown in red.
Download figure:
Standard image High-resolution imageChanging monsoon dynamics over the past few decades (Bollasina et al 2011, Ha et al 2020) have implications for changing spatio-temporal patterns of seasonal precipitation across HMA (Zhu et al 2020). For example, the suggested weakening of the South Asian Summer Monsoon since the 1950s, exacerbated by anthropogenic aerosol emissions, has resulted in observed summertime drying across much of northern India and towards the Nepalese Himalaya (Bollasina et al 2011). Conversely, a tendency towards earlier monsoon onset over the Bay of Bengal can be linked to increases in May precipitation in the southeastern Tibetan Plateau (Zhu et al 2020, Jouberton et al 2022), accelerating wetting and greening in recent decades (Zhang et al 2017). While the full mechanisms remain elusive (e.g. Saha and Ghosh 2019), the complex interaction of temperature and precipitation changes have important implications for both glacier accumulation and ablation, largely through precipitation phase and albedo (Jouberton et al 2022). While it has been established that the dynamics of the summer monsoon, as well as long-term climatic trends, local geography (Yao et al 2012, Maussion et al 2014, Mölg et al 2014, Zhu et al 2018, de Kok et al 2020) and even land use change (de Kok et al 2018) all contribute to the heterogeneity of glacier mass balance in HMA, responses of glaciers' mass balances in different sub-regions to multi-decadal variability in the monsoon remains largely unexplored (Arndt et al 2021).
We utilise a recently developed, 9 km resolution atmospheric model simulation (Ou et al 2020) in order to unravel the multi-decadal response of mountain glacier energy-mass-balance to the changes of the summer monsoon within distinct sites across HMA. By combining recent advances in atmospheric and land surface modelling with robust bias-correction techniques and detailed ground-based meteorological information, we aim to address the following specific questions: (1) How has the timing, duration and intensity of the summer monsoon evolved since the 1980s and what is its impact upon the spatial-temporal patterns of summer climate across HMA?; (2) How has energy and mass balance of three mountain glaciers in HMA responded to changes in monsoon dynamics over four decades?; and (3) What are the main drivers of these changes in distinct climatic sub-regions?
2. Data and methods
2.1. Study area
The present study focuses on three debris-free, mountain glaciers distributed across distinct climatic sub-regions of HMA (figure 1). Yala Glacier (28.237∘ N 85.619∘ E) is a small, 1.5 km2 glacier situated in Langtang Valley, Nepal which has been the subject of long-term mass balance campaigns (e.g. Fujita et al 1998, Baral et al 2014, Stumm et al 2021, Sunako et al 2020) as well as the focus of research on energy balance and surface processes (Stigter et al 2018, Litt et al 2019). Parlung Glacier Number 4 (29.245∘ N 96.928∘ E, hereafter 'Parlung 4' or 'PAR4') is a 11.7 km2, spring-type accumulation glacier in the southeastern Tibetan Plateau. The glacier has been the focus of several recent studies that have explored meteorological processes (Yang et al 2011, Shaw et al 2021), glacier dynamics (Yang et al 2020) and energy/mass balance (Zhu et al 2015, 2018, Jouberton et al 2022). Mugagangqiong Glacier (34.248∘ N 87.490∘ E, hereafter 'MUGA' for tables and figures) is a 2 km2 glacier in the arid central Tibetan Plateau. The glacier has been the focus of few studies, typically regarding ice cores and historic atmospheric dust concentrations (Feng et al 2020), though is also one of several investigation sites established across the Tibetan Plateau in the last decade (Yang et al 2022). The site specific information of each glacier is given in table 1.
Table 1. Summary statistics of the three glacier study sites. Geometric statistics are based upon the median date of the model simulations (2000) and temperature and precipitation information are based upon the glacier-wide average for the whole period (1981–2019).
| SITE | Yala Glacier (YALA) | Parlung Glacier No. 4 (PAR4) | Mugagangqiong Glacier (MUGA) |
|---|---|---|---|
| Area (km2) | 1.5 | 11.7 | 1.9 |
| Elevation range (m a.s.l.) | 5120–5615 | 4700–5600 | 5600–6100 |
| Mean slope (∘) | 22 | 8 | 11 |
| Mean summer (June–September) air temperature (∘C) | 0.1 | 1.0 | −1.2 |
| Mean summer (June–September) precipitation total (mm) | 1172 | 1476 | 413 |
| Fraction of solid precipitation in summer (June–September) | 0.87 | 0.7 | 0.95 |
2.2. Datasets
We utilise hourly meteorological data from off- and on-glacier automatic weather stations (AWSs) at each study site (figure 1) to bias-correct the long-term forcing data. AWS data are available for the period 2012–2019 for Parlung 4 and Yala (figure S7), and 2015–2019 for Mugagangqiong. At each site, distributed ablation stake data are available, spanning partial (Parlung 4) or full elevation ranges (Yala/Mugagangqiong) of the glaciers.
Gridded atmospheric data for HMA (1980–2019) are extracted from simulations carried out with the weather research and forecasting (WRF) model at 9 km horizontal resolution (Ou et al
2020, Sun et al
2021). The WRF model (v. 3.7.1) is driven by three-hourly ERA5 pressure and surface level variables. Spectral nudging is applied to geopotential, horizontal winds and temperatures above the approximate planetary boundary layer top as described in Ou et al (2020). The model applies no convection scheme, as found by Ou et al (2020) to produce the most appropriate frequency and initiation timing for short (1–3 h) and long ( 6 h) precipitation events compared with observations. The full model details are provided in table S1.
2.3. Derivation of meteorological forcing
WRF data are extracted from the nearest corresponding point to each off-glacier AWS (figure 1) which provides a longer series of un-interrupted data for bias correction. Data gaps in the AWS records are ignored such that only hours with all energy balance variables available (air temperature, relative humidity, radiative fluxes, wind speed, air pressure and precipitation) are considered for bias correction. We apply a multivariate bias-correction following Cannon (2018) that combines quantile delta mapping with random orthogonal rotations to match the multivariate distributions of both the WRF and AWS data. This approach has been shown to outperform univariate bias correction methods when used in hydrological modelling applications (Meyer et al 2019, Faghih et al 2021) and we consider it suitable for correction of cross-correlated variables in complex, high mountain regions. Using at least 5 years of AWS data at each site, we generate quantile correction factors that are applied to the full time series of WRF data at the extracted pixel of interest. The variable correlations and long-term trends are preserved in the bias-corrected data and found to be consistent with long-term climate stations for the different sub-regions (see SI).
With the bias-corrected time series of WRF data, we extrapolate the variables of interest to the elevations of the glaciers (table 1) using empirically determined lapses rates. Multiple station observations available in Langtang Valley (Steiner et al 2021) were used to generate hourly-monthly temperature lapse rates, and temperatures were adjusted for the boundary layer cooling effect of Yala using the on-glacier AWS temperatures. For Parlung 4, we consider the off-glacier temperature lapse rates derived from the data of Shaw et al (2021) and as applied by Jouberton et al (2022). Precipitation is distributed similarly to Jouberton et al (2022) who applied a correction factor of 1.75 and gradient of 14% 100 m−1 to account for the distinct precipitation regime between valley and the glacier. Given the differences in model forcing and structure, we recalibrate these gradients for the current study against ablation stakes and an upper elevation ice core record (table S3). No on-glacier AWS exists for Mugagangqiong, though the off-glacier AWS is very close to the glacier and is considered to experience a partial cooling effect associated with the glacier boundary layer (e.g. Shaw et al 2021). For this site, we distribute temperature considering the lapse rates derived for the Mugagangqiong basin (Yang et al 2022). Precipitation gradients and correction factors were calibrated against multi-year ablation stake observations. Use of a precipitation correction factor implicitly accounts for unknown quantities of AWS pluviometer under-catch that were not represented by the bias correction of WRF data.
2.4. Energy/mass balance modelling
We simulate hourly glacier energy and mass balance using the snow, ice and hydrological components of the Tethys-Chloris (T&C) land surface model (Fatichi et al 2012, 2021, Mastrotheodoros et al 2020, Botter et al 2021, Fyffe et al 2021, Fugger et al 2022) applied in a semi-distributed manner using 50 m intervals for the full range of elevations at each site (table 1). T&C's cryospheric component constitutes a fully-physical energy balance model that simulates the energy fluxes of the ice/snow surface and subsurface, including sublimation. Precipitation phase partitions are dynamically considered based upon the air temperature, relative humidity and air pressure (Ding et al 2014) and utilised directly in the albedo model developed by Ding et al (2017). We adjust the mean incoming radiative fluxes and snow avalanching according to the topography of each elevation band and the modelled elevational mass balances are area-weighted by time-evolving hypsometries from co-registered DEMs and glacier outlines since the 1970s to produce a continuous time-series of glacier mass balance (figures S16–S18). Avalanching on Parlung 4 Glacier was modelled given a fully-distributed TOPKAPI-ETH simulation of the catchment by Jouberton et al (2022) and used to update end-of-year mass balances for the appropriate elevation band. The model is run for 1980–2019 and the results analysed for 1981–2019, taking 1980 as a spin-up year. Temperature and precipitation distribution parameters are perturbed in 1000 Monte Carlo simulations to provide an estimate of mass balance uncertainty. More details about the model are provided in the supplementary information section 2.3.
2.5. Characterisation of the moonsoon
As an estimate of the regional onset of the monsoon, we consider the horizontal wind shear index (HWSI) of Prasad and Hayashi (2005), as previously considered in studies of this type (Mölg et al 2012, Li et al 2018). Due to the large scale feature of the monsoon, we utilise ERA5 850 hPa zonal wind data to derive this index. Alternative means to classify local monsoon timing (e.g. Bombardi et al 2020, Brunello et al 2020) resulted in spatial-temporal inconsistencies between study sites for certain years and were thus not applied here. In this study, we analysed the results of the glacier energy- and mass-balance in relation to the monsoon (i) onset dates; (ii) cessation dates; (iii) duration and; (iv) intensity (figure S27). Moreover, we analyse the May–June precipitation amount and phase during the pre-monsoon to monsoon transition and examine its potential influence on the glacier energy and mass balance during the summer. The relevance of the monsoon characteristics is then placed into the context of the prevailing meteorological conditions for the summer. Early (late) onset/cessation dates are considered as those which are less (greater) than one standard deviation from the mean of the whole period and monsoon intensity is taken as the normalised mean HWSI for June–September.
3. Results
3.1. Patterns of monsoon climate
The regional monsoon index reveals a tendency towards an earlier monsoon onset (−3.3 days dec−1) and later cessation (+11.6 days dec−1) between the 1980s and the early 2000s (figures 1(b) and S27), coinciding with a period of relatively strong monsoon intensity (figure 1(c)). Since 2005 the monsoon has arrived later and withdrawn sooner, shortening its total duration and becoming weaker in its intensity (figures 1(c) and S27). All sites see an increase in total precipitation coinciding with this expansion of the monsoon duration (figures 2(c)–(h)), especially for Parlung 4, which also demonstrates a period of relatively cool temperatures and increased cloudiness during the early 2000s, interrupting the overall warming trend (figure 2(d)). The entire HMA reveals a significant warming trend over the past four decades (figure S28), though with markedly different patterns at the study sites: summer (JJAS) temperatures at Yala continue almost unabated at a rate of 0.17 ∘C dec−1; the stronger warming at Parlung 4 (0.23 ∘C dec−1) combines a period of relative cooling and no clear trend pre-2000s, with a much stronger warming pattern since 2005, and; Mugagangqiong demonstrates a coincident increase in mean annual air temperature and precipitation during the early millennium (figure 2(e)).

Figure 2. JJAS precipitation (PP) correlation to monsoon intensity (a) and May–June precipitation correlation to onset timing (b) across HMA (1981–2019), whereby positive correlations in (b) indicate increased precipitation for a later monsoon. Correlations (detrended) not significant to the 0.95 level are shown in white. Trends in mean JJAS TA (c)–(e) and total JJAS PP (f)–(h) are given for YALA (c), (f), PAR4 (d), (g) and MUGA (e), (h). Faded lines for (f)–(h) indicate the annual precipitation sum. Annotations also show the correlations of May–June TA and PP with the monsoon onset timing (level of significance (p-value) given in parentheses). Scales for (f)–(h) are equal.
Download figure:
Standard image High-resolution imageA higher intensity monsoon produces increased total precipitation for Parlung 4 and Yala, but has no significant correlation with precipitation at Mugagangqiong (figure 2(a)). An early monsoon arrival relates to increased precipitation (negative correlation) for much of southeastern and south central Tibet during May–June (figures 2(b) and S48), but shows no clear correlation for the Nepalese Himalaya (figures 2(b) and (f)). The increase in monsoon duration is governed by a tendency towards later cessation (figure S27) and has a more notable influence on summer temperature for the eastern Tibetan Plateau, though with few statistically significant correlations (figure S36). The patterns of radiative fluxes, cloudiness and humidity equally show few statistically significant trends across HMA for the full 40 year period (figures S28–S34), though at the glacier sites, the inter-decadal and long-term patterns suggest an increasing cloudiness and humidity alongside reduced shortwave radiation (figure S35).
3.2. Long-term glacier response to climate
The long term glacier mass balance of Mugagangqiong is highly distinct to the lower elevation, southerly sites (figure 3(a)) with a near-neutral, negative mass balance that has changed little since the 1980s. This is characteristic of its low temperatures, dry environment and low mass turnover rates (figure S44). Yala and Parlung 4, meanwhile, exhibit a much larger total mass loss over the past 40 years, despite significant differences in their inter-annual and inter-decadal mass balances (figure 3(a)). The mass balances of Yala and Parlung 4 closely reflect the inter-annual variability of air temperature and total precipitation (figure 2). Yala, however, experiences an almost continuous mass loss since 1980 with few positive mass balance years (figure 3(c)). Conversely, the mass loss at Parlung 4 is a combination of largely negative mass balance years interspersed by extended periods of positive or near-neutral mass balance (figure 3(d)) resulting in more mass loss during the drier 1980s (mean of −0.35 ± 0.11 m w.e. a−1 compared to −0.24 ± 0.20 m w.e. a−1 of Yala) followed by minimal mass loss from 2000 to 2005 (mean of −0.03 ± 0.13 m w.e. a−1 compared to −0.28 ± 0.17 m w.e. a−1 of Yala) and finally a period of more rapid mass loss continuing until 2019 (−1.00 ± 0.12 m w.e. a−1 vs. −1.01 ± 0.19 m w.e. a−1 at Yala). Patterns of mass balance at Mugagangqiong indicate no extended periods of negative or positive mass balance, but rather year to year fluctuations between weak positive and negative mass balances (figure 3(e)). On average, modelled glacier mass balances were −0.59 ± 0.20, −0.55 ± 0.12 and −0.04 ± 0.09 m w.e. a−1 for Yala, Parlung 4 and Mugagangqiong, respectively.

Figure 3. Modelled cumulative hourly (a) and annual specific (b)–(d) glacier mass balance for the three glacier study sites. Shaded areas in (a) indicate the Monte Carlo uncertainties derived from 1000 runs of varying forcing parameters. Panel (a) indicates the observed geodetic-derived mass balances (markers) from the literature (see supplementary material) with the observed uncertainties given as errorbars. Positive and negative bars for (c)–(e) indicate the cumulative positive and negative balances for each calendar year.
Download figure:
Standard image High-resolution image3.3. Key drivers of distinct glacier mass loss
A key driver of the energy budget at all sites is the pre-monsoon and monsoon snowfall (figures 4 and S43), which dictates the increases in early monsoon albedo and reduction in net shortwave radiation (figure S47). While all sites behave similarly in this regard, the mass balance of Mugagangqiong shows a stronger correlation to both pre-monsoon and monsoon snowfall (figure S43), as its low melt rates and notable sublimation (constituting 20% of total ablation vs 8% at Yala and 3% at Parlung 4) are highly controlled by radiative fluxes under cold temperatures.

Figure 4. (a), (c), (e) Precipitation phase (solid lines) and cumulative snowfall (dashed lines) during the May–June transition from pre-monsoon to monsoon conditions. Data are presented for the mean of early (blue) and late (red) onset years for YALA (a), (b), PAR4 (c), (d) and MUGA (e), (f). (b), (d), (f) shows the cumulative glacier mass balance since May 1st, where thin lines represent individual years, coloured by the monsoon onset classification and thick lines represent the average conditions for early and late monsoon onset. Vertical dashed lines indicate the mean dates for early (blue) and late (red) onset years. Boxplots to the right indicate the end-of-year mass balances given the early or late monsoon onset.
Download figure:
Standard image High-resolution imageFigure 4 emphasises the distinct patterns of snowfall and precipitation phase during the pre-monsoon to monsoon transition in May–June. At Yala, an early monsoon onset coincides with earlier snowfall at the glacier, though the total amount of snowfall is larger (∼37 mm on average) when the monsoon arrives late (figure 4(a)), which appears to be strongly linked to the higher fraction of solid precipitation for those years (figure 4(a)). Despite this average increase in May–June snowfall to the glacier, a late monsoon onset does not significantly alter the mass balance of Yala for the remainder of the year (figure 4(b)).
At Parlung 4, a later monsoon produces slightly cooler average conditions (figure S47), delaying liquid precipitation events during May compared to an early onset year (figure 4(c)). However, because of the substantial decrease in precipitation (∼130 mm on average), a late monsoon onset can sizeably influence the summer mass balance of Parlung 4 (figure 4), because the onset timing itself can explain 32(27)% of the variability in pre-monsoon (monsoon) snowfall. Due to the reduced surface albedo (figure S47—which can explain up to 87% of glacier mass balance variability) and heightened net shortwave radiation, mass balances are almost 0.5 m w.e. more negative on average than early onset years (figures 4 and 5), despite that only a weak correlation (−0.18, p = 0.2) to the monsoon onset itself exists (figure S43). While a late monsoon onset produces a consistent mass balance response for Parlung 4, early onset years result in a wide range of potential mass balances for the summer months (figure 4(d)). The summer and annual glacier mass balances are, however, significantly distinct between early and late onset years (p = 0.05, figure 4(d) boxplots).

Figure 5. The relationship of cumulative annual mass balance and monsoon onset (a)–(c), cessation (d)–(f), duration (g)–(i) and intensity (j)–(l) for YALA (a), (d), (g), (j), PAR4 (b), (e), (h), (k) and MUGA (c), (f), (i), (l). Thicker lines indicate the mean of each condition highlighted by the legend. Note: cessation colours are the inverse of that for monsoon onset.
Download figure:
Standard image High-resolution imageInterestingly, for years where the monsoon arrived late, May–June precipitation at Mugagangqiong was augmented (40 mm (58%) increase—figure 4(e)), suggesting a stronger role of westerly storm events in the absence of the monsoon precipitation (figure 1(a)—correlation = 0.27, p = 0.1). Given its elevation, however, no notable differences in precipitation phase are apparent for Mugagangqiong during this transition period (figure 4(e)). Average differences in cumulative mass balance are only apparent until late August, however, and are typically ∼0.04 m w.e. Variability in onset timing produces negligible correlations (−0.15) with the amount total monsoon snowfall at this site. As later monsoon onset years were typical for the cooler period of the simulation (figure S40), we also tested early vs late monsoon years only for the pre-2000s period and found a consistent pattern of May–June precipitation amount and phase for all glaciers as described above (figure S45).
Annual mass balances of Parlung 4 are generally affected less by the monsoon cessation date (figure 5). The mass balances of Yala and Mugagangiong are, however, more responsive to the cessation timing of the monsoon, but for different reasons: a later cessation at Yala relates to prolonged warmer air temperatures (figure S48(a)) which drives more melting and more negative mass balances; for Mugagangqiong, a later cessation date provides a longer period with precipitation (up to 200 mm on average compared to early cessation years—figure S48(f)), and thus produces a more positive mass balance. However, a more positive post-monsoon mass balance at Mugagangqiong does not significantly impact to the spring mass balance in the following year (not shown).
Monsoon duration itself balances many of the aforementioned processes to reveal no clear relationship to annual or summer mass balance (figure 5). The years with the weakest monsoon intensity, however, coincide with recent, warmer conditions (Yao et al
2022), producing a consistently more negative mass balance at all sites: up to 1 m w.e. more mass loss on average at Yala; 0.45 m w.e. greater mass loss at Parlung 4 and; 0.13 m w.e. more mass loss at Mugagangqiong relative to strong monsoon intensity years. Controlling for the effect of increasing air temperatures in recent years, the monsoon intensity is able to explain ∼50% of the variability in Yala summer mass balance (partial correlation r = 0.498, p = 0.001), but only 15% for Parlung 4 and  3% at for Mugagangqiong.
Monsoon characteristics (i.e. onset timing) can be associated with variable responses in glacier mass balance at our study sites, but the variability in meteorological conditions during the summer, which are only be partly influenced by the monsoon itself (up to 20% variability in (pre-)monsoon precipitation explained by monsoon timing or intensity—figure S43), play a dominant role in determining surface conditions and resultant mass loss. Figure 6 indicates that air temperature is the strongest control on glacier mass balance for Parlung 4, largely through its impact on the phase of monsoon precipitation (Jouberton et al 2022—figures 6(k)and S49(h)) and surface albedo (figure S49(k)—Zhu et al 2022). Controlling for the effect of air temperature itself, changes in the solid fraction of precipitation can explain 41% of the variability in glacier mass balance at Parlung 4. Meanwhile, precipitation phase changes had a smaller impact on Yala and Mugagangqiong, and mass balances were mostly responsive to the total amount of monsoon precipitation (figures 6, S49 and S50). Although the role of turbulent heat fluxes was more distinct between each site, increases in net shortwave radiation were consistently associated with the most negative mass balance years for all glaciers (figure S50).

Figure 6. As figure 5, but mapping cumulative annual glacier mass balance of Yala (top), Parlung 4 (middle) and Mugagangqiong (bottom) against anomalously cool (blue) and warm (red) conditions (a)–(c), anomalously wet (blue) or dry (red) pre-monsoon (d)–(f) and monsoon (g)–(i) snowfall and anomalously high (blue) and low (red) solid precipitation fraction (phase) (j)–(l). Anomalies are given as those years above or below 1 standard deviation from the mean of all years. Thicker lines indicate the mean of each condition highlighted by the legend. No anomalously high solid precipitation fraction (phase) years are evident at Mugagangqiong (average is near 1) so no blue line is given.
Download figure:
Standard image High-resolution image
4. Discussion
Earlier studies have emphasised the stark differences in the surface energy balance of different glaciers in HMA (Zhu et al 2015, 2018, Fugger et al 2022), and the relationship of glacier energy balance with the monsoon (Mölg et al 2012, Li et al 2018, Fugger et al 2022). However, while these works have demonstrated a detailed response of glaciers to prevailing conditions for a number of individual years, few studies, to the authors' knowledge, have provided a long-term perspective on glacier energy/mass balance and monsoon characteristics (Arndt et al 2021). Our results reveal a long-term pattern of glacier mass loss (figure 3) Shaw et al (2022) consistent with warming trends present in the WRF simulations (figure S28) and ground based climatologies (Ren et al 2017, de Kok et al 2020) (figure S5). However, notable wet periods during the early 2000s are superimposed on this long-term pattern of decline and have contrasting consequences for the mass balance of our three study glaciers.
Because of the larger elevation range of Parlung 4 in the southeastern Tibetan Plateau (table 1), its mass balance sensitivity is more strongly determined by the combination of pre-monsoon snowfall amounts (figure 4(c)) and precipitation phase during the monsoon (Zhu et al 2018, Jouberton et al 2022), particularly at elevations near the inter-annual ELA (5200 m a.s.l.), which are more responsive to a late arrival of the monsoon (figure S44). Evidence during the May–June period (figure 4) suggests that the large decreases in total precipitation received during these anomalously late monsoon years (figure 1(b)) were sufficient to overcome the relatively higher fractions of solid precipitation during the cooler pre-monsoon conditions at Parlung 4 and can dictate the mass balance of the entire summer (figures 4 and 5). This suggests that the tendency towards a later monsoon onset (figure S35), combined with the increasing liquid precipitation events during the summer (Jouberton et al 2022), could further exacerbate glacier health in the south-eastern Tibetan Plateau.
In contrast to this, the small Nepalese glacier (Yala) was much less sensitive to the wetter conditions at the start of the Millennium, resulting in a more continuous mass loss (figure 3), consistent with modelled long term mass balances in northwestern Nepal (Arndt et al 2021). Although the size of the glacier and its limited accumulation area (Stumm et al 2021, Sunako et al 2020) may have dictated its reduced sensitivity to the expansion of the monsoon period, an early monsoon actually produces less snowfall during the monsoon transition period (May–June) at this glacier, despite shifting the occurrence of snow sooner. A weakening monsoon intensity and drier conditions, coinciding with warmer air temperatures of recent decades (figure 2) can explain half of the mass balance variability at this glacier, but the amount of snowfall during late June is also of great importance (figure 6).
Because of its relatively high elevation, cold temperatures and arid conditions characteristic of our central Tibetan glacier (Mugagangqiong), long term changes, while evidently negative over the course of four decades (figure 3), are ∼14 times less negative than Yala. Because of its location on the border of the monsoon dominated region (figure 1(a)), a late monsoon arrival actually results in a greater May–June precipitation, perhaps due to an increasing incidence of westerly storm fronts. This re-emphasises the potential importance of westerly circulation patterns for glacier accumulation regimes on the Tibetan Plateau, as shown by Mölg et al (2014) and Li et al (2018), and might explain the correlation of increased active monsoon periods with more negative glacier mass balance at Mugagangqiong (figure S43). However, this finding contrasts somewhat with those aforementioned studies in which an earlier and stronger monsoon onset resulted in higher accumulation patterns for Zhadang and Qiangtang No.1 glaciers. This might be explained in part by the location of those glaciers further east within the inner Tibetan Plateau, whereby westerly intrusions are weakened and result in a less dominant source of pre-monsoon snowfall, but also may relate to the different methodological approaches, datasets and time-frame of this current work. An early retreat of monsoon conditions, especially in the absence of westerly disturbances during late summer, produces a more negative post-monsoon mass balance at Mugagangqiong (figure 5), due to the large reduction of precipitation and the limited westerly activity during those months.
Ultimately, our results indicate that warmer atmospheric conditions, which coincide with a weakening of the summer monsoon (figure 1(c)), are the main driver of continued mass loss at glaciers across HMA (principally through increased net shortwave radiation (figure S50)) and are comparable to the patterns of glacier sensitivity suggested by Sakai and Fujita (2017). While a late monsoon arrival and reduced snowfall can dictate much of the mass loss for Parlung 4 Glacier (figures 4(c) and 5(b)), the annual mass balance of summer-accumulation glaciers (Yala and Mugagangqiong) are less controlled by the timing of monsoon. Rather, for those sites, the intensity of the core monsoon season and its impact on (i) the total amount of snowfall and (ii) its interaction with westerly storm events (Mugagangqiong) have greater impact (figures 4 and 6). This highlights the non-uniform response of glaciers in HMA to the monsoon and the need for a greater focus on sub-regional monsoon intensity and its interaction with westerly storms and general warming trends of the last half century.
In general, high elevation, long-term measurements are still too scarce to piece together a full picture of the monsoon's influence on glacier mass balance across all HMA, and even then, uncertainty surrounding the elevation gradients of precipitation may still hamper our ability to identify clear signals relating it to regional climatic drivers. Of particular benefit would be the inclusion of rare meteorological and mass balance datasets in understudied regions of the western Kunlun Mountains and western-central Tibetan Plateau (e.g. Zhu et al 2018, 2022, Yang et al 2022) that would help clarify the spatial limits of the monsoon's influence beyond our three selected sites. The inclusion of debris-covered glaciers would additionally benefit the understanding of glacier response to the monsoon across HMA (Fugger et al 2022), though those glaciers are currently subject to greater uncertainties with respect to spatial variability in debris cover thickness and properties that evolve over multi-decadal time scales.
Here we were able to generate longer term insights into the variable changes of glaciers in different climatic sub-regions of HMA which cannot be revealed by diverse and discontinuous, geodetic observations alone (figures 3(a) and S20, Bhattacharya et al 2021, Hugonnet et al 2021). Nevertheless, our forcing data are still subject to uncertainties that stem from parameter choices (table S1) and its coarse spatial resolution (9 km) which may mis-represent the dynamical processes governing the timing and magnitude of precipitation at very local scales (e.g. Bonekamp et al 2018). Further still, our long term analysis is made computationally feasible by the adoption of a physically-based, but semi-distributed modelling framework. Though we have confidence in the robustness of the approach to derive glacier-wide mass balances, there are likely feedbacks due to local topography and ice-atmosphere interactions as glaciers shrink (Florentine et al 2018, Shaw et al 2021) that we cannot represent with the adopted methodology in this study. Advancements in kilometre/sub-kilometre resolution atmospheric models (Collier and Immerzeel 2015, Bonekamp et al 2018, Zhou et al 2021) and the increasing availability of high elevation meteorological networks in high mountain, glacierised regions (e.g. Zhu et al 2018, Yang et al 2022) should continue to improve our ability to represent local glacier responses to regional scale monsoon dynamics moving forward.
5. Conclusions
We apply a multi-decadal (1980–2019) land surface model, driven by hourly bias-corrected WRF outputs to simulate the changing mass balance of three distinct glaciers in HMA and their relation to the summer monsoon. Our results demonstrate a differing response of glacier energy and mass balance to the patterns of the monsoon at the three sites, governed principally by the surface albedo and affected by the role of pre-monsoon/early monsoon snowfall amount and phase and by the intensity of the monsoon period. While all three glaciers have experienced long-term mass losses (ranging from −0.04 ± 0.09 to −0.59 ± 0.20 m w.e. a−1) in line with widespread warming across the region, inter-decadal variability in the timing and strength of the monsoon precipitation has strongly modulated the glacier surface conditions at the site in the southeastern Tibetan Plateau. This is largely in line with the notable increases of early 2000s precipitation due to the expansion of the monsoon duration. Considering the critical May–June transition period, we highlight that a late monsoon arrival generates significantly less total snowfall for the glacier (∼130 mm on average) in the southeastern Tibetan Plateau, producing consistently more negative mass balances (−0.5 m w.e. on average compared to early onset years).
Conversely, the arrival of the monsoon has less impact on the annual mass balance of the Himalayan glacier, which is more sensitive to the temperature and snowfall amount of the core monsoon season and its cessation. For the arid central Tibetan Plateau, a later arrival of the monsoon results more positive mass balances, likely due to the greater role of westerly storm events in providing early summer snowfall. The monsoon cessation determines a greater variability in post-monsoon energy balance at this site, however, due to the amount of monsoon precipitation in the absence of post-monsoon westerlies. Nevertheless, we found that the monsoon timing is less important than the overall intensity of monsoon conditions for the mass balance of summer-accumulation glaciers in the Nepalese Himalaya and central Tibet. Our findings elaborate on the complexity of glacier response to the diverse sub-climates in the region and we suggest the need for more high elevation observations combined with highly resolved atmospheric model simulations and long-term, fully distributed energy/mass balance studies.
Acknowledgments
This work was supported by the SNF Sino-Swiss Science and Technology Cooperation (SSSTC) Project (IZLCZ0_189890) 'Understanding snow, glacier and rivers response to climate in High Mountain Asia (ASCENT)' and by JSPS and SNSF under the Joint Research Projects (JRPs: 20191503) scheme. The National Natural Science Foundation of China (41961134035) financially supported the data collection on Mugagangqiong and Parlung No. 4 glaciers. D Chen is supported by the Swedish Research Council (VR: 2019-03954). The computations of the 9 km WRF were enabled by resources provided by the Swedish National Infrastructure for Computing (SNIC) at the National Supercomputer Centre in Sweden (NSC) partially funded by the Swedish Research Council through Grant Agreement No. 2018-05973. We acknowledge funding from the European Research Council (ERC) under the European Union's Horizon 2020 research and innovation program Grant Agreement No. 772751, RAVEN ('Rapid mass lossess of debris covered glaciers in High Mountain Asia'). We recognise the hard fieldwork efforts of Utrecht University, ETH and ICIMOD in providing data for the Langtang catchment. S Sunako is thanked for the provision of updated glacier DEMs and outlines for Yala Glacier. W Immerzeel, R de Kok and members of the WSL HIMAL group are thanked for their valuable discussions at early stages of this work. We thank the editor and two anonymous reviewers for their constructive comments that improved the quality of the manuscript.
Data availability statement
9 km WRF simulations are publicly available at: http://biggeo.gvc.gu.se/TPReanalysis/. Data for the Langtang catchment are publicly hosted by the ICIMOD RDS at: http://rds.icimod.org/.
Reconstructed WRF time-series data at each glacier site and key model outputs are hosted at the following repository: https://doi.org/10.5281/zenodo.6418550.
The source code of the T&C model is available at https://doi.org/10.24433/CO.0905087.v2.
The data that support the findings of this study are openly available at the following URL/DOI: https://doi.org/10.5281/zenodo.6418550.
Conflict of interest
The authors declare that there are no conflicts of interest in the submission of this work.
Ethics statement
The authors declare that there are no ethical issues arising from this work.
Supplementary data (17. MB PDF)