

Abstract
Understanding the human water footprint and its impact on the hydrological cycle is essential to inform water management under climate change. Despite efforts in estimating irrigation water withdrawals in earth system models, uncertainties and discrepancies exist within and across modeling systems conditioned by model structure, irrigation parameterization, and the choice of input datasets. Achieving model reliability could be much more challenging for data-sparse regions, given limited access to ground truth for parameterization and validation. Here, we demonstrate the potential of utilizing remotely sensed vegetation and soil moisture observations in constraining irrigation estimation in the Noah-MP land surface model. Results indicate that the two constraints together can effectively reduce model sensitivity to the choice of irrigation parameterization by 7%–43%. It also improves the characterization of the spatial patterns of irrigation and its impact on evapotranspiration and surface soil moisture by correcting for vegetation conditions and irrigation timing. This study highlights the importance of utilizing remotely sensed soil moisture and vegetation measurements in detecting irrigation signals and correcting for vegetation growth. Integrating the two remote sensing datasets into the model provides an effective and less feature engineered approach to constraining the uncertainty of irrigation modeling. Such strategies can be potentially transferred to other modeling systems and applied to regions across the globe.
Export citation and abstract BibTeX RIS

Original content from this work may be used under the terms of the Creative Commons Attribution 4.0 license. Any further distribution of this work must maintain attribution to the author(s) and the title of the work, journal citation and DOI.
1. Introduction
Irrigated agriculture contributes to 40% of total food produced worldwide. Freshwater withdrawals from both surface and groundwater systems allow for production intensification and crop diversification as compared to rainfed agriculture and cover about 20% of cultivated land over the globe (FAO 2020). The understanding of irrigation in altering the water and carbon cycles (Baker et al 2012, Scanlon et al 2012, Troy et al 2015, Asoka et al 2017, Jasechko et al 2017, Rodell et al 2018, Zaveri and Lobell 2019), repartitioning the surface energy balance (Kueppers et al 2007, Lobell et al 2008, Pokhrel et al 2012, Lawston et al 2020), its sensitivity to climate variability (Schewe et al 2014, Russo and Lall 2017, Condon et al 2020), and its reflection and interaction with the human water management strategies (Guan et al 2017, Lund et al 2018, Wang et al 2018, Deines et al 2019) has been advanced in recent decades. Such irrigation related processes and feedbacks have been increasingly recognized as an important component that should be included in earth system models, advancing the understanding of the water demand shift under climate change, thus informing preparedness for water and food security (Döll et al 2012, Wada et al 2017, de Graaf et al 2019, Condon and Maxwell 2019).
Despite the importance of reliable irrigation estimates for management of global freshwater withdrawals, large uncertainties exist among model estimates, surveys, and reports across scales (Huang et al 2018, Puy et al 2021). These uncertainties can be sourced from the choice of acquiring approach, input datasets, modeling structure, irrigation parameterization approaches, among others. Irrigated area explains more than half of the irrigation variability at the global scale; however, it remains a highly uncertain variable for some regions (Puy et al 2021). Climate forcing is another factor contributing to the uncertainty of modeling irrigation. Wisser et al (2008) demonstrated that choice of the forcing input can lead to as large as 70% variability in irrigation estimation relative to mean values at the national level. Additionally, features such as crop types, irrigation efficiency, and soil hydraulic parameters can contribute to irrigation uncertainty in various ways (Puy et al 2021).
While most irrigation uncertainty assessments have focused on comparisons across input sources and differences among models (Wisser et al 2008, Wada et al 2013, Scanlon et al 2018), few studies have quantified irrigation uncertainty from the parameterizations within a single model (DeJonge et al 2012, Lawston et al 2015). The model parameters to which irrigation estimation may be potentially sensitive are often determined on a strong empirical basis or calibrated to variables that may not be directly relevant to irrigation amounts. Some models have a more sophisticated representation of irrigation where processes such as prognostic vegetation, soil infiltration, and runoff generation all play important roles in irrigation estimation and its associated impact on other fluxes. For instance, in most irrigation schemes in land surface models (Haddeland et al 2006, Ozdogan et al 2010, Harding and Snyder 2012, Pokhrel et al 2012, Leng et al 2013), the triggering of irrigation depends on vegetation condition while the irrigation water use is based on a soil moisture deficit approach. In such models, physics associated with vegetation conditions and soil moisture states are essential in determining the timing and magnitude of irrigation. Consequently, both the parameters in the irrigation schemes and the physics that are linked to irrigation may introduce uncertainties in the irrigation estimation. Though many studies have quantified parameter sensitivities on various land surface models simulating natural processes (Demaria et al 2007, Hou et al 2015, Cuntz et al 2016, Arsenault et al 2018), specific examination of the sensitivities and uncertainties related to anthropogenic water use such as irrigation has not been conducted.
Incorporating remote sensing (RS) measurements via data assimilation or parameter estimation have been proven to benefit irrigation estimation by constraining or correcting for model states such as soil moisture (Felfelani et al 2018, Lei et al 2020), vegetation, and groundwater (Nie et al 2019). However, these studies have not investigated how effective these constraints might be given the underlying parameter sensitivities. In other words, the effectiveness of utilizing RS measurements may be parameter-dependent and a configuration which worked well for one region might show nontransferable skill for another (Nie et al 2022). Quantifying the dependence of RS constraints on key parameters is, therefore, necessary to understand how perturbations of model parameters may affect the irrigation estimation and whether and by what means the incorporation of RS constraints may affect the irrigation uncertainty brought by parameter perturbations.
The main goal of this paper is to assess the uncertainty of irrigation estimation to key irrigation parameters in an advanced land surface model—Noah-MP (Niu et al 2011, Yang et al 2011), and how vegetation and soil moisture RS constraints may affect the model uncertainty and provide guidance towards a more generalized and robust estimation of irrigation withdrawals. First, we identify and perturb three key irrigation parameters to generate an ensemble of 25 simulations representing irrigation uncertainty introduced by parameter selection. We then conduct four experiments with or without the two RS constraints, each consisting of 25 ensemble members (with a total of 100 experiments) and evaluate the irrigation estimation against the United States Department of Agriculture (USDA) report for the year 2018. The study also evaluates the propagation of irrigation uncertainty to evapotranspiration (ET) and soil moisture, given the importance of these variables in coupled land–atmosphere systems and water resources applications.
2. Methods
2.1. Noah-MP model and irrigation
We use the Noah-MP land surface model within the NASA land information system (Kumar et al 2006), with a configuration established in a previous study (Nie et al 2021), which has been evaluated over the contiguous United States (CONUS) with reasonable skill in demonstrating irrigation impacted water and energy budgets. The irrigation scheme was originally built into Noah-MP based on Ozdogan et al (2010) and further adapted by Nie et al (2018), Nie et al (2021) to account for the spatiotemporal variation of irrigation area and source water partition (More details can be found in the supplementary text S1).
In this study, we create 25 combinations of the two vegetation ( ) and one soil moisture (
 ) parameters (supplementary text S1 and table 1) to generate the ensemble members for each experiment as they play a vital role in determining the timing, frequency, and amount of irrigation estimation. The values of A and B are selected based on choices made by previous practices (Ozdogan et al
2010, Lawston et al
2015, Nie et al
2018), while C is bounded by 0.4–0.58 with an interval of 0.02. The combination of these parameters is selected in a way that is general enough to represent an irrigation spread from a relatively loosely to a more strictly parameter-constrained condition. We then perform four experiments with or without RS constraints to investigate how these constraints may affect parameter-induced irrigation uncertainties.
) parameters (supplementary text S1 and table 1) to generate the ensemble members for each experiment as they play a vital role in determining the timing, frequency, and amount of irrigation estimation. The values of A and B are selected based on choices made by previous practices (Ozdogan et al
2010, Lawston et al
2015, Nie et al
2018), while C is bounded by 0.4–0.58 with an interval of 0.02. The combination of these parameters is selected in a way that is general enough to represent an irrigation spread from a relatively loosely to a more strictly parameter-constrained condition. We then perform four experiments with or without RS constraints to investigate how these constraints may affect parameter-induced irrigation uncertainties.
2.2. Data sources and experimental design
We select two RS datasets to explore whether and by what means incorporating them into a generic irrigation rule may constrain irrigation uncertainties. One dataset is the 500 m Moderate Resolution Imaging Spectroradiometer (MODIS) MCD15A2H version 6 Leaf Area Index (LAI) product available at 8 d interval (Myneni et al 2015); and the other is the 1 km daily soil moisture (referred as RS soil moisture hereinafter) disaggregated from the soil moisture active passive (SMAP) (Chan et al 2018, SMAP; O'Neill et al 2019) product using the thermal hydraulic algorithm (Thermal Hydraulic Disaggregation of Soil Moisture (THySM); Liu et al 2022). Vegetation condition is an important indicator for irrigation season while the SMAP soil moisture retrievals, that we utilize for this study, has been proved to have higher information content (Kumar et al 2018) and capability of detecting irrigation signal over the CONUS (Lawston et al 2017, Felfelani et al 2018). We design four experiments with each experiment including 25 ensemble members populated by the parameter combinations of A, B, and C as mentioned above:
Open-loop experiment (OLirr): We perform an open-loop run in which neither MODIS LAI nor the RS soil moisture is incorporated into the model. The prognostic vegetation module is turned on to simulate the vegetation growth on its own.
MODIS-based LAI constrained experiment (LAIDA): The MODIS LAI dataset is incorporated into the model by assimilating the LAI values using the ensemble Kalman filter algorithm following Kumar et al (2019) (More details are provided in supplementary text S2).
RS soil moisture constrained experiment (SSMTC): Irrigation demand computed in the model should be informed by soil moisture signal prior to irrigation instead of soil moisture condition that is already impacted by irrigation. Therefore, rather than assimilating RS soil moisture into the model which may violate the rationale of the irrigation routine, here we introduce RS soil moisture as an additional timing constraint to the existing irrigation rules. Irrigation is triggered if RS soil moisture is larger than the model predicted surface soil moisture by a certain threshold (supplementary text S3 provides more details).
MODIS-based LAI and RS soil moisture constrained experiment (LAI-SSM): In this experiment, both LAI and soil moisture constraints are incorporated into the model concurrently.
All simulations are conducted for the year 2018 at a spatial resolution of 0.125° considering the availability of both the SMAP dataset and USDA irrigation reports. The model is forced by the combination of the Integrated Multi-satellitE Retrievals for Global Precipitation Measurement (Huffman et al 2015) near real-time final run and the NASA's Modern Era Reanalysis for Research and Applications version 2 (Gelaro et al 2017) product.
2.3. Evaluation metrics
We use the irrigation survey of the year 2018 conducted by the USDA National Agricultural Statistics Service to evaluate the simulated irrigation amount. We first identify five water resource regions (figure 1) that cover most of the intensively irrigated areas for analyses, including the Pacific Northwest region (PNR), the California region (CR), the Missouri region (MR), the Arkansas-White-Red region (AWRR), and the Lower Mississippi region (LMR). Further, to investigate the agreement between simulated and USDA-reported irrigation amount in terms of spatial pattern and magnitude, we fit a linear regression to the annual state-level total irrigation amount and the linear regression slope for the 25 ensemble members for each experiment is reported. The ensemble members are then arranged based on the ascending order of the simulated irrigation total over the CONUS for OLirr. We calculate the Spearman's rank correlation for the state-level irrigation amount to further explore how different RS constraints affect the spatial correlation and across the ensemble members within each experiment.

Figure 1. Comparison between simulated and USDA-reported total irrigation water amount in 2018 for the five water resource regions, the boundaries of which are highlighted on top of the irrigation fraction map over the CONUS. Colored symbols for each experiment set denote the amount simulated by the 25 simulation members with only the irrigation parameters being different. Gray bars represent the standard deviation within each experiment set centered on the mean. Black dashed lines denote the USDA-reported irrigation water amount for the corresponding region. Also shown are RMSD values with respect to the USDA report for each experiment.
Download figure:
Standard image High-resolution imageTo illustrate the dependency of ET uncertainty on the irrigation uncertainty, we fit the linear slope and estimated Spearman's correlation for state-averaged annual total ET between the simulations and the gridded 5 km daily atmosphere-land exchange inverse (ALEXI; Anderson et al 2007) product. Only actively irrigated grid cells within each state are selected to calculate the state-average ET to eliminate the impact brought by non-irrigated areas. The same analysis is also conducted for ET within effective growing seasons. However, the results and conclusions are not sensitive to the choice of annual total versus growing season total as the magnitude of ET is dominated by the growing season ET in most cases.
Since the SMAP data is only used as a timing constraint for irrigation, we use it also as a reference dataset to explore and evaluate how irrigation uncertainty propagates into surface soil moisture by computing the Kullback–Leibler divergence (KLD; Kullback and Leibler 1951) between SMAP and the simulations. The KLD metric measures the statistical distance between the probability distribution of two datasets, with lower KLD values indicating a closer match between the two datasets and vice versa. The climatological seasonal cycle is removed from the daily surface soil moisture before estimating KLD. The KLD values for actively irrigated grid cells are organized by water resource regions with the median, the lower, and the upper quartile reported.
3. Results and discussion
3.1. Irrigation spread reduced by applying the constraints
Five water resource regions are selected for analyses, which covered most of the intensively irrigated areas over the CONUS. Figure 1 demonstrates the simulated annual total irrigation water amount in 2018 for each experiment compared against the USDA report. Results suggest that irrigation estimation is sensitive to the choice of irrigation parameters in OLirr for all of the selected water resource regions. The spread of estimated irrigation amount for Pacific Northwest, Missouri, Arkansas-White-Red, and Lower Mississippi encompassed the USDA reported amount, implying that with adjustments within the range of the perturbed parameters, one could possibly estimate the magnitude of the irrigation water demand comparable to the reported values. The tendency to underestimate for CR is, however, less likely to be overcome by adjusting these parameters, as the variability in irrigation estimation that adjusting parameters can produce is much smaller than its drift from the observations.
Assimilating LAI (LAIDA) increased the spread of the simulated amount among the members, implying that the sensitivity of the model to the selection of irrigation parameters would be increased by introducing vegetation information as a constraint for irrigation estimation. Moreover, LAIDA also leads to larger estimated irrigation amounts, although this might be beneficial for California. The estimated amount for the other four regions, however, are overestimated when compared to the USDA report. Applying RS soil moisture as a timing constraint (SSMTC) reduced the irrigation spread by limiting the occurrence of irrigation events within effective growing seasons. This brings the simulated amount in closer agreement with the USDA report for Pacific Northwest and Missouri; however, SSMTC greatly underestimates the amount for California and Lower Mississippi, likely due to the misrepresentation of the coherence between vegetation and soil moisture states. Reduced spread and better estimation in amount are found especially for California and AWRR when incorporating both constraints into the model (LAI-SSM), the root mean square difference (RMSD) of which has been reduced by 55%, 16%, respectively (figure 1).
Generally, the impact of RS constraints on irrigation amount and spread indicates an increase by LAIDA and a decrease by SSMTC for all five regions. However, when combining the two constraints, irrigation amount and spread for AWRR are further reduced while the changes are estimated in between LAIDA and SSMTC for the other four regions. Overall, our results reveal a degree of uncertainty in modeling irrigation amount from perturbing key irrigation parameters. However, conclusions regarding the accuracy of the estimation in magnitude relative to the USDA report are difficult to make as diverse sources (some subjective) contribute to the uncertainty of the report. Moreover, the limited temporal scale of the available report limits the evaluation of the seasonality of irrigation patterns. The main finding of these results is that the vegetation and soil moisture inputs play relatively opposite roles in constraining the irrigation uncertainties stemming from the choice of irrigation parameters.
3.2. The role of LAI and soil moisture differ but are both important
To understand the role of LAI and soil moisture constraints in altering irrigation estimation, figure 2 shows the seasonal profile of the estimated irrigation amount along with the greenness vegetation fraction (GVF) (bottom row) for each experiment. We find that the contribution of LAIDA is mainly towards modifying the seasonality of irrigation. Assimilating LAI shifts the peak and the magnitude of GVF, with an earlier peak growing season and much larger peak values for Pacific Northwest, California, and MR as compared to OLirr, implying that the default prognostic vegetation process within Noah-MP may have delayed the vegetation growth and underestimated the carbon assimilation amount. This deficiency has been reported in the literature (Ma et al 2017, Niu et al 2020), partially due to the simplified parameterization of the effect of soil water stress on transpiration and carbon assimilation, and root dynamics. For Arkansas-White-Red and LMR, LAIDA largely modifies the evolution of vegetation growth. In particular, the summer peak and the following fast decay of irrigation amount are simulated in LAIDA, which is represented differently in OLirr. The difference in the seasonal pattern of GVF largely explains the seasonal difference in irrigation estimation in OLirr and LAIDA. However, this correction in the vegetation dynamics, especially in the magnitude, results in a greater spread among the ensemble members, as the irrigation amount estimation is sensitive to the rooting depth, which is parameterized by GVF.
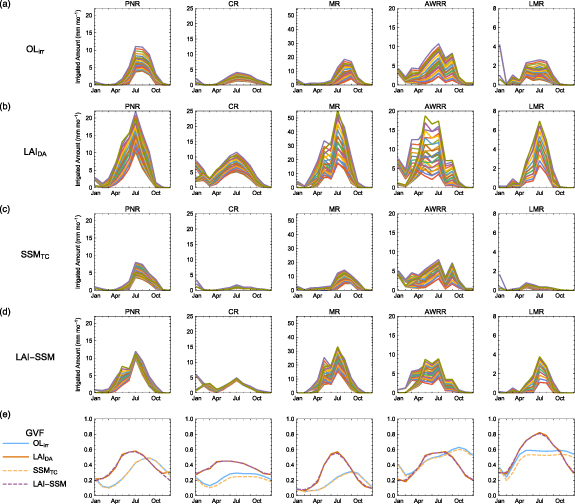
Figure 2. Evolution of monthly irrigation water amount averaged over the five water resource regions within the 25 members (colored lines) for (a) OLirr, (b) LAIDA, (c) SSMTC, and (d) LAI-SSM. Figure (e) shows the corresponding mean monthly GVF across the 25 members for each experiment set.
Download figure:
Standard image High-resolution imageApplying the RS soil moisture constraint has little impact on GVF. Minor impacts are found for California and LMR, in response to the interaction between irrigation impacted soil moisture stress and vegetation growth. For these regions, irrigation amount has been greatly reduced by SSMTC, leading to less water availability, decreased leaf carbon assimilation, and thus smaller GVF. In fact, SSMTC is more effective in constraining the irrigation spread, with the standard deviation among the 25 ensemble members being reduced by 22%–72% across the five water resource regions. The constraining in irrigation timing, by design, has also reduced the irrigation amount, which is controlled at a daily scale by LAI alone.
By incorporating both constraints into the model, we find although LAI-SSM does not constrain the spread as effective as SSMTC, the standard deviation is still reduced by 7%–43% across regions except for Missouri. With the shift in the seasonal irrigation signal, LAI-SSM yields improvements, in particular, for California and AWRR. These findings highlight that improved vegetation and soil moisture information is essential for irrigation estimation, and that the two RS datasets have the potential to constrain irrigation uncertainty at different scales, with less parameterized formulations.
3.3. Improved spatial distribution in irrigation and ET
To examine how the two constraints affect the spatial distribution of irrigation, we apply (a) a standard linear regression and (b) Spearman's rank correlation to the state-averaged annual total irrigation amount against the USDA state-level report over the CONUS. The same metrics are also applied to simulated annual ET against the ALEXI ET dataset to understand how the impact on irrigation can propagate into energy fluxes (figure 3). For the irrigation amount, the linear regression slope in OLirr ranges between 0.4 and 1.5 among the ensemble members. The strong influence of LAI data assimilation on vegetation conditions makes the model very sensitive to selected irrigation parameters. Depending on parameter combinations, the fitted slope can differ by up to four orders of magnitude, indicating a strong tendency to overestimate the amount as well as the spatial variability (figure 3(a)). However, although LAIDA increases the irrigation uncertainty and overestimated the amount, the benefit of correcting the vegetation growth toward improving the monotonic spatial distribution is robust, with a much higher Spearman's rank correlation than that of OLirr (figure 3(b)). Applying the soil moisture constraint substantially stabilizes the fitted slope for irrigation, but its impact on rank correlation is negligible. By combining the two constraints, LAI-SSM narrows down the range of the fitted slope closer to one attributed mainly by the soil moisture constraint and maintains the high rank correlation benefited from the LAI constraint.
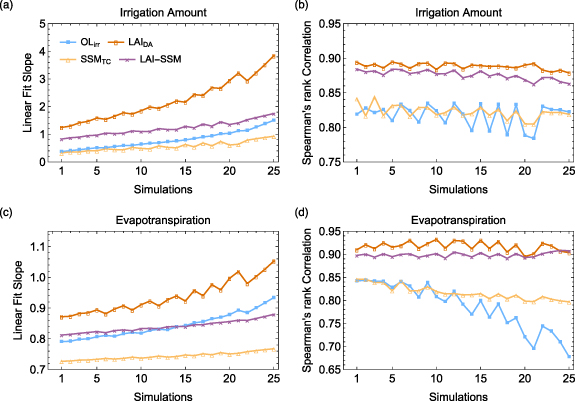
Figure 3. The linear fit slope and Spearman's rank correlation for state-averaged irrigation amount (a) and (b) compared against USDA-reported and ET (c) and (d) compared against ALEXI dataset. The simulation members are displayed in ascending order according to the total amount simulated by OLirr.
Download figure:
Standard image High-resolution imageThe relative impact on ET in terms of the fitted slope is similar to that of irrigation amount, except that the magnitude of ET seems to be better represented by LAIDA. Note that the ALEXI estimates are also subject to uncertainties and biases in representing the response of ET to irrigation and that the reliability of ALEXI ET is mainly in describing the spatial pattern and seasonality (Hain et al 2015). Therefore, the comparison of ET magnitudes shown in figure 3(c) is less reliable. Unlike the simulated irrigation, the rank correlation comparison is relatively insensitive to parameter choices. Figure 3(d) shows the degradation in the model's ability to capture the monotonic spatial distribution in ET. The correlation coefficient decreased from 0.84 to 0.68 as the simulation index increased. In this case, the LAI constraint (LAI-DA and LAI-SSM) not only improves the correlation of ET but also decouples the dependence of ET on the choice of parameters.
3.4. Impact on soil moisture distribution
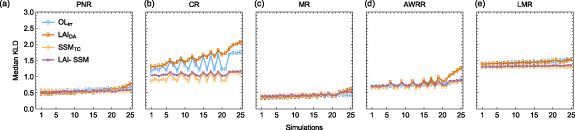
Although SMAP data is utilized in the SSMTC and LAI-SSM runs, the way it is incorporated into the model could be regarded as a loose constraint, as sub-daily and seasonal scale of soil moisture variation still heavily relies on the model physics itself. Therefore, we regard the RS soil moisture here as a reference dataset to examine whether and how irrigation affects surface soil moisture distribution. We use the KLD metric to measure the probability distribution difference between the simulated and RS soil moisture anomalies. Simulations with lower KLD values indicate a closer match with the RS soil moisture anomaly distribution. Figure 4 shows the median, along with the lower and the higher quartile of KLD for actively irrigated areas stratified by each water resource region.
Figure 4. KLD estimates for all simulation members stratified by the five water resource regions. Solid lines represent the median and the corresponding shades represent the upper and lower quartile of the KLD.
Download figure:
Standard image High-resolution image
For Pacific Northwest, Missouri, and Lower Mississippi, there is a subtle difference among the experiments and across the ensemble members. One possible explanation is that the irrigation signal is not strong enough to make a difference in the soil moisture distribution as these regions are relatively wet and the soil moisture anomaly distribution might be dominated by natural processes. The possible overlap of the growing season for irrigation with the rainy season in these regions causes soil moisture change to be dominated by the precipitation signal. In such instances, irrigation plays a secondary role in influencing soil moisture. The situation is different for California and AWRRs where the overestimation of irrigation has a clear impact on the KLD pattern. LAIDA results in a much greater increase in KLD as the simulation index gets larger, with less agreement to SMAP. On the other hand, by applying the soil moisture constraints, SSMTC and LAI-SSM lead to smaller KLD values across the ensemble members, with the difference between the median being comparable and larger than the range of the quartiles within each experiment, especially for the CR. This indicates that the irrigation impact on surface soil moisture might be more obvious for dry regions such as the central Great Plains, and for regions like California, where the main growing season is mostly rain-free. Our results align with Lawston et al (2017) showing that the irrigation signal detected by SMAP is strongest for the California central valley as the irrigation signal is consistent and extensive in the rain-free summer.
4. Summary and conclusions
The results of the remotely sensed vegetation and soil moisture constraints impact on irrigation estimation, its uncertainty, and the associated fluxes indicate that both soil moisture and vegetation states are important for model realism in irrigation estimation in Noah-MP. Assimilating LAI enables corrections to the vegetation growth seasonality while imposing the RS soil moisture constraint further informed the irrigation occurrences at daily scales. Combining the two constraints are important as applying LAI constraint alone may increase the model sensitivity to irrigation parameters, subjecting to potentially greater bias if a suitable set of parameters are not provided, while applying soil moisture constraint alone may misrepresent seasonal irrigation signal given the model weakness in prognostic vegetation process. In addition, soil moisture constraints also improve anomaly conditions, particularly in dry regions, and vegetation constraint leads to a more consistent agreement in the spatial pattern of ET.
Satellite RS of vegetation conditions is relatively consistent and robust while it has been a challenge to date for passive soil moisture retrievals to detect irrigation. SMAP soil moisture retrievals have been proved to have higher information content (Kumar et al 2018) and capability of detecting irrigation signal over the CONUS (Lawston et al 2017, Felfelani et al 2018). From this study, we conclude that the approach of incorporating both remotely sensed vegetation and soil moisture constraints to a generic soil moisture deficit-based irrigation routine can improve the spatial distribution of irrigation estimation and reduce its dependence on specific parameterizations. Our approach highlights the importance of correctly representing vegetation seasonality in irrigation estimation and provides a simple but more reliable way to extract information from remotely sensed soil moisture measurements for irrigation detection. Integrating the two constraints provides an effective and less parameter-dependent approach to reduce the uncertainty of irrigation modeling. With proper adaptation, the approach can be employed in other modeling systems and applied over different regions, to improve the quantification of anthropogenic water use for irrigation.
Acknowledgments
This work was supported by the NASA sponsored Earth Information System (EIS) pilot project. Computational resources were provided by the NASA's Center for Climate Simulation (NCCS).
Data availability statements
The data that supports the findings of this study are openly available via the Johns Hopkins University Data Archive: https://doi.org/10.7281/T1/0EYOMQ.
Conflict of interest
We declare no conflicts of interest.
Supplementary data (0.2 MB PDF)