

Abstract
Long-term monitoring shows evidence of persistent changes in the magnitude and timing of the seasonal pattern of nitrate concentrations in streams, with possibly grave effects on aquatic ecosystems. Seasonal patterns of stream nutrient concentrations are determined by a complex interplay of inputs, transport, and turnover. Over multi-decadal periods, each of these factors may change due to socio-economic factors such as consumption patterns, governance regimes, or technological control measures. Here we test the hypothesis that observed multi-decadal changes in stream nitrate seasonality could be explained by changes in the relative importance of catchment nutrient sources over time. We analyze 66 years of shifting nitrate seasonality in a large, central-European river (Elbe) during a period of significant socio-political changes (1954–2019), with correspondingly significant changes in the sources of anthropogenic nitrate emissions. We develop a mixed-source succession model to test how the multi-decadal evolution of the composition of nitrate sources (point and diffuse) influences in-stream seasonality. We show that the in-stream nitrate seasonality of the River Elbe changed significantly from a weak seasonal pattern with peak concentrations during summer in the 1950s to a strong seasonal pattern with peak concentrations during winter in the 1990s. We link these shifts to a succession of technical and political developments which influence the contribution of point and diffuse sources over time. Such shifts in seasonal concentration patterns can significantly impact the macronutrient (carbon, nitrogen, phosphorus) ratios in rivers, which in turn highly affect the health of aquatic ecosystems.
Export citation and abstract BibTeX RIS
1. Introduction
Human activities have dramatically altered global nutrient cycles, resulting in a remarkable rise of global nitrogen emissions since the 1950s (Steffen et al 2015), mainly stemming from fertilizers, wastewater, and atmospheric deposition (Caraco and Cole 1999, Fowler et al 2013). However, the effects of changes to the nitrogen cycle on aquatic ecosystem integrity are modulated not just by the amount but also by the timing (i.e. seasonality) of the nutrient availability (French and Petticrew 2007, Romero et al 2013, Rollinson et al 2021). The seasonality of nutrient concentrations in rivers is controlled by discharge, the nutrient sources (e.g. wastewater or agricultural fertilizers) and in-stream processing (Worrall and Burt 1998, Van Meter et al 2020). Many studies have investigated the effects of changes in nutrient sources over multiple decades at the catchment scale, but usually with a focus on inter-annual changes based on the temporal aggregation of intra-annual in-stream concentrations or loads (Billen et al 2001, Worrall et al 2014, Van Meter and Basu 2015, Westphal et al 2019). In fact, temporally aggregated annual data hide information about seasonal variability, which are important determinants of riverine ecological functions (Romero et al 2013, Van Meter et al 2020). Aquatic biota such as phytoplankton form assemblages according to the seasonal patterns of environmental factors including light, temperature, and nutrient availability (Alstyne 2016, Snell et al 2019). Changes in nutrient seasonality can therefore change algae assemblages or lead to blooms, which affect higher trophic levels (Alstyne 2016, Snell et al 2019). On the decadal scale, seasonal shifts of nutrient concentrations have been found to correlate with Chlorophyll-a concentrations and impact pH and oxygen dynamics, indicating the biogeochemical relevance of nutrient seasonality (Minaudo et al 2015). Therefore this study focuses on long-term shifts in seasonal riverine nutrient concentration patterns over a multi-decadal trajectory of changing coupled human-water-systems interactions. This trajectory, which ranges from decades of mid-twentieth century intense pollution to recent recovery periods, is characteristic of typical long-term human-water-systems interactions (Vörösmarty et al 2015). We examine in-stream nitrate concentrations and their drivers for a 66-year record (1954 through 2019), including the socio-economic transition of post-socialist to market-based economies at the scale of a large transboundary river catchment (Elbe River, approximately 148 000 km2). This study aims to address the following research question: Is the changing relative importance of catchment nutrient sources over time driving multi-decadal changes in in-stream nitrate seasonality? We posit that point and diffuse nitrate sources have distinct seasonal patterns, which leads to the hypothesis that changes in nitrate source composition propagate to changing in-stream nitrate seasonality. To test this, we developed a mixed source succession model (MSSM) for a nitrate in-stream seasonality trajectory based on ratios of point and diffuse source contributions to in-stream concentrations, which we relate to different periods along the pollution/recovery trajectory.
2. Background
The effects of point and diffuse source pollution are expected to change over time corresponding to levels of economic development (Meybeck and Helmer 1989, Garcier 2007). We conceptualize this development with the hierarchical evolution of needs theory (Maslow 1943) which predicts that humans will only tackle complex needs when their basic needs are met. This theory has been applied to water quality problems, where water management first prioritizes human health needs, followed in turn by economic interests and environmental needs (De Haan et al 2014, Arden and Jawitz 2019). We apply the theory to predict a multi-decadal succession of patterns of in-stream nitrate concentration seasonality. In figure 1 we present a conceptual model of how a human needs-based temporal evolution of nitrate source attenuation (panel (a)) results in changing ratios of the relative contributions of point and diffuse sources, thus driving a corresponding succession of seasonality states (panels (b) and (c)). To conceptualize the succession, we illustrated how four major socio-technological developments affect nitrate seasonality: (a) collection and disposal of urban wastewater via sewers (human health needs), (b) the widespread use of mineral nitrogen fertilizer (economic needs), (c) pollution control through denitrification in wastewater treatment plants (WWTPs, environmental needs) and (d) diffuse source control (environmental needs).

Figure 1. Conceptual model of nitrate seasonality regime shifts of the Elbe river based on the propagation of (a) technological and societal developments into (b) resulting seasonal riverine nitrate concentrations and (c) corresponding seasonality metrics. Panel (b) shows hypothetical nitrate chemographs which are the results of different mixing rations between point (p) and diffuse (d) nitrate contributions, represented as two out-of-phase sine waves, as we assume that p has a negative and d a positive relation with discharge. The d + p curve was based on the long term water quality trends conceptualized by Meybeck and Helmer (1989) consisting of a period with pollution succeeded by partial recovery. In panel (c), the curves  represent the contributions of point and diffuse sources to annual mean in-stream concentrations and are hypothesized from the succession of technological and societal developments shown in (b). The seasonality metrics (c) are based on linear interpolations between the different seasonality stages shown in (a).
  is a measure for the strength of the seasonal variability and
  represents the day of the year with the highest nitrate concentrations (see equation (1)).
Download figure:
Standard image High-resolution imageCollectively, the transitions between these stages form a trajectory, in which the first two developments represent the pollution and the latter two recovery efforts. Although the timing of implementation of these developments will be different between catchments, some were only made possible by particular technological inventions that are well dated. For example, while sewer systems date to 3000 BC, they only became widespread after 1850 (De Feo et al 2014). The fixation of nitrogen for use in fertilizers was only made possible by the Haber-Bosch process, developed in the early 20th century (Steffen et al 2015). Removal of point source nitrate emissions from WWTPs via denitrification became feasible between the 1960s and 1980s (Seeger 1999, Lofrano and Brown 2010). Diffuse source control is not linked to the development of a specific technology, but is usually achieved by the improvement of agricultural management practices (Roebeling et al 2015). However, the implementation of those management practices generally follows efforts to limit point source emissions (Grizzetti et al 2012, Reusch et al 2018).
We illustrate the impacts of the succession of those four developments on in-stream nitrate concentrations at five stages along the trajectory (figure 1(b)) at the catchment outlet, and visualize how linear changes between those stages would affect nitrate seasonality (figure 1(c)).
To quantitatively describe the seasonality of environmental parameters, we use a sine function of the form:

where aZ
corresponds to the annual mean value ( ), bZ
is the amplitude (
), bZ
is the amplitude ( ), i.e. the strength of the oscillation around aZ
, t indicates the day of the year, φZ
is the day of the calendar year with the maximum value, and ω is the angular frequency set as 2π/365 days. The subscript Z represents either nitrate concentrations, the long-term average intra-annual discharge or river water temperature. aZ
, bZ
have the same unit, which is either mg l−1 (for nitrate concentrations NO
), i.e. the strength of the oscillation around aZ
, t indicates the day of the year, φZ
is the day of the calendar year with the maximum value, and ω is the angular frequency set as 2π/365 days. The subscript Z represents either nitrate concentrations, the long-term average intra-annual discharge or river water temperature. aZ
, bZ
have the same unit, which is either mg l−1 (for nitrate concentrations NO N), m3 s−1 (for discharge Q) or ∘C (for water temperature T). We use the normalized amplitude
  as a proxy for the strength of the seasonal oscillations and refer to it as seasonal amplitude in the following.
  means constant values in all months, while
  represents oscillations of the same size as the annual mean.
As a starting point of this trajectory, we assume a low-impact stage (stage 1) in which nitrate stems mostly from landscape sources (diffuse sources). During a subsequent stage of urbanization, population growth, and industrialization, the widespread building of sewers leads to the discharge of urban wastewater to streams without treatment (stage 2), making point source nitrate the dominant source. Growing use of mineral nitrogen fertilizers in agriculture (stage 3) is characterized by a strong increase in the contribution of diffuse source nitrate, with the potential to exceed the point source contribution. A combination of high point and diffuse source contributions could lead to similar concentrations throughout the year with a low seasonal variability between the stages 2 and 3, as described e.g. by Worrall and Burt (1998), Van Meter et al (2020). Stage 4 marks the beginning of the recovery part of the trajectory with the implementation of denitrification in WWTPs, which substantially decreases the point source contribution without affecting the diffuse source. As diffuse source control is not yet implemented, we assume that its contribution further increases or at least stagnates in this stage. Stage 5 is characterized by the implementation of diffuse source emission controls, but with diffuse sources contributions still greater than at low-impact levels. We also expect to see further improvements on point source control, but less pronounced compared to changes occurring before stage 4.
We assume changes in point and diffuse source nitrate to propagate into seasonal riverine concentrations for the following reasons. Correlations between nitrate sources and riverine nitrate seasonality (or concentration discharge relationships) have been reported over significant spatial gradients (Worrall and Burt 1998, Van Meter et al 2020, Ebeling et al 2021). For example, Nitrate concentrations in agriculturally dominated catchments have been found to be positively correlated with discharge (Van Meter et al 2020, Ebeling et al 2021). If the agricultural contribution to the catchment decreases, e.g. in favor of urban areas, this correlation decreases and similar concentrations throughout the year prevail (Worrall and Burt 1998, Van Meter et al 2020).
Furthermore, catchments with a negative concentration discharge relationship have been found to be strongly correlated with a high population density indicative of the prevalence of wastewater and other urban point sources (Van Meter et al 2020). We therefore expect the following relationship between riverine seasonality and nutrient sources: if, concentrations in summer/fall (low discharge conditions) changed but concentrations in winter/springhigh discharge) were hardly affected (i.e. negative concentration-discharge relationship), we interpret this as a change in point source contributions. On the other hand, trends which mostly affect winter/spring concentrations are interpreted as changes in diffuse source contributions.
Changes in seasonal riverine nitrate concentrations should also be reflected in the changes of the of the seasonality metrics  and
and  : if summer/fall and winter/spring concentrations converge,
  will decrease as concentrations become more similar throughout the year (figure 1(c)). In case of their divergence (e.g. decrease of winter/spring with constant summer/fall concentrations), the amplitude will increase. If a change from e.g. a point source to a diffuse source-dominated stage occurs, we expect that
  should temporarily reach zero as during this change, point and diffuse source contributions must be equal for a short time (figure 1(c)). The timing of the seasonal pattern (
 ) directly reflects the season with the highest concentration. For example when the winter/spring concentrations are higher,
  is between day 335 and 150 and vice versa.
3. Data and methods
3.1. The Elbe catchment
The River Elbe has a length of 1094 km (66.4% in Germany, 33.6% in the Czech Republic) and a catchment size of approximately 148 000 km2 (IKSE 2005). Between 1949 and 1990, approximately 80% of the German Elbe catchment belonged to the German Democratic Republic (GDR) territories. The upper Elbe (until 96 km downstream of the Czech–German border) flows through the Czech Giant and Bohemian Forest mountain ranges, the middle Elbe (until 585 km downstream of the Czech–German border) passing through the north German lowlands, and the lower Elbe is the tidally influenced section to the North Sea (figure 2(a)). Its catchment is situated in the temperate climate zone and marks the transition between continental and maritime regimes (IKSE 2005). Mean annual temperature ranges from 1 ∘C in the Czech mountains to 9 ∘C in the German lowlands (IKSE 2005). Mean annual precipitation ranges from 1810 mm yr−1 (upstream mountain ranges) to less than 450 mm yr−1 (lowlands), with a catchment average of 628 mm yr−1 (IKSE 2005). The discharge regime of the Elbe is pluvio-nival (Hübner and Schwandt 2018), with spring maxima and autumn minima (figure 2(c)). Mean discharge at the outlet in Geesthacht is 716 m3 s−1 and 318 m3 s−1 at the Czech–German border (IKSE 2014). While the Elbe River is free-flowing in the German part of the catchment, the Czech sub-catchment contains 59 reservoirs and 29 dams (Hübner and Schwandt 2018). The land cover is 56% agricultural areas, 30% forests, 8% artificial surfaces, and 3.5% wetlands and water bodies (EEA 2018, figure S1 (available online at stacks.iop.org/ERL/17/064039/mmedia)).
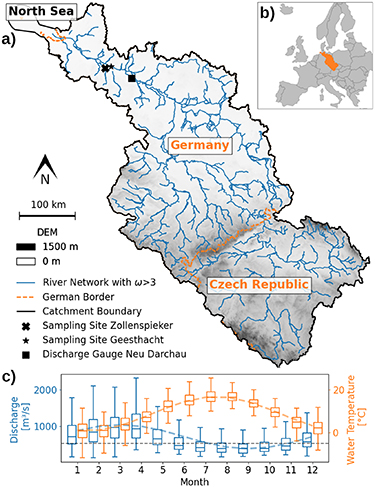
Figure 2. (a) The Elbe catchment river network (draining into the North Sea) and elevation map. The EU-Hydro river network model (EEA 2019) was used to show river segments with a Strahler order ω > 3. The EU-DEM digital elevation model (EEA 2016) serves as the basemap. (b) Position of the catchment in Europe. (c) Boxplots of monthly river water temperature, discharge records and their sine wave fits from Neu Darchau (mean ± inter quantile range) based on data from 1954 to 2019. The dashed black line shows the median discharge.
Download figure:
Standard image High-resolution imageWith the onset of the industrial revolution in the late 19th century, chemical pollution of the Elbe increased significantly, primarily from wastewater originating from urban areas, industry, and mining (Petermeier et al 1996). In the early 20th century, many sewer systems were built across Germany to collect and discharge urban emissions (Blackbourn 2011). During the so-called agro-industrial revolution in the GDR between the 1960s and 1980s, the use of fertilizers increased rapidly (Bauerkaemper 2004, figure S2). By the end of the 1980s, large amounts of wastewater from German and Czechoslovakian cities and industrial areas reached the stream untreated (Netzband et al 2002). After the collapse of the GDR, the subsequent closing of many industrial branches and rapid construction of WWTPs (figure S2, bottom) in the 1990s led to a decrease in chemical pollution from point sources, which caused a rapid improvement of water quality in the Elbe (Adams et al 2001). The decreased pollution also led to changes in trophic state of the river, which was dominated by heterotrophic processes before German reunification and became autotrophic afterward (Lehmann and Rode 2001). In 1991, just after the German reunification, the European Union (EU) introduced the Nitrates Directive to tackle high diffuse source nitrogen inputs into water bodies, by observing and limiting mineral fertilizer and manure application for agricultural practices (European Commission 1991).
Starting in 2010 and initiated by the Water Framework Directive (WFD), many measures were undertaken or planned to achieve at least good ecological status for all European surface water bodies by 2027 (European Commission 2000). In the Elbe catchment, these measures included the restoration of floodplains, the connection of oxbow lakes to rivers, the removal of transverse structures, and the further reduction of point and diffuse source nutrient inputs (Damm 2013). Measures that targeted point source emissions showed fast results: for example, nitrogen inputs from wastewater were reduced from 4300 to 2400 tons per year between 1994 and 1998 and reached 336 tons in 2008 (IKSE 1998, 2010). On the other hand, diffuse source nutrient inputs remain, together with morphological alterations, the most critical pressures preventing good ecological status of surface water bodies in the Elbe catchment (IKSE 2010). Averaged over the years 2006–2010, 84% of nitrogen inputs into the Elbe river network stem from diffuse sources (IKSE 2018).
Despite all its alterations, the Elbe is a rare European case of a free-flowing river along 622 km of its main course (IKSE 2010). Its remaining flood plains are recognized as hotspots of biodiversity (Meyerhoff and Dehnhardt 2007). In its current ecological state, the Elbe is an essential contributor to nitrogen attenuation (attributed to phytoplankton assimilation, seston deposition, and denitrification (Ritz and Fischer 2019)), which can collectively attenuate up to 30% of the nitrogen inputs (Deutsch et al 2009, Ritz and Fischer 2019, Kamjunke et al 2021). The pollution-recovery trajectory of the Elbe summarized above is consistent with the experience of other major European and North American rivers over the last century (Billen et al 2007, Minaudo et al 2015, Van Meter and Basu 2017), although with distinct differences related to the German experience.
3.2. Time series data
Nitrate, water temperature, and ammonia were measured at the tidal weir in Geesthacht (stream kilometer 586, figure 2(a)) weekly from 1954 to 1988, biweekly from 1992 to 2005, and monthly from 2006 to 2019. A five-year gap from 1988 to 1993 was filled with data from Zollenspieker (figure 2(a)), 12 km downstream of the tidal weir. Although the latter site is influenced by the tides, in 26 years of data overlap, the nitrate time series from both sites showed very good correspondence (root mean square error = 0.25 mg l−1, percent bias of 1.1%, figure S3). Samples at Zollenspieker were collected weekly until 1991 and bi-weekly afterward. Daily mean discharge records from 1954 to 2019 were measured at the gaging station Neu Darchau (figure 2(a)), located ca. 50 km upstream of Geesthacht. The areal difference between the two sub-catchments (Neu Darchau and Geesthacht) is less than 3% (IKSE 2005, Mudersbach et al 2016).
3.3. Methods
3.3.1. Seasonality analysis
To visualize long-term trends in in-stream nitrate concentration without the influence of inter-annual discharge variability, we calculated flow-normalized concentrations using the weighted regression on time, discharge and season (WRTDS) function of the R package EGRET (Exploration and Graphics for RivEr Trends, Hirsch and DeCicco 2014). The WRTDS function simulates daily solute concentrations based on daily discharge and low-frequency solute concentration measurements. By smoothing techniques, WRTDS decomposes the variability into long-term trends, seasonal effects, discharge-related effects, and random variations. The raw data used for the WRTDS function is shown in figure S4. The higher-flow season (December–May) and lower-flow season (June–November) were based on the annual median discharge (figure 2(b)).
We analyzed the seasonality of nitrate concentration, discharge, and river water temperature by investigating the strength and the timing of their seasonal oscillation. Following the approach from Dupas et al (2017), we extract the seasonal oscillation parameters aZ
, bZ
and φZ
by fitting equation (1) to observed values of riverine nitrate concentrations, river discharge and river water temperature. The parameters aZ
, bZ
, and φZ
of equation (1) were fitted to observed data using the curve_fit() function with the Levenberg–Marquardt algorithm implemented in the Python package SciPy (Virtanen et al
2020). In addition to the day with annual maximum φZ
we use the notation ψZ
to denote the day of annual minimum values ( ).
).
As we aim to investigate long-term changes in nitrate seasonality, we apply a 5-year moving window to the unprocessed time series to minimize the known effects from inter-annual discharge variability on solute concentrations (Harned et al
1981). To estimate the uncertainty of this analysis, we perform 1000 bootstrap resamplings for each 5-year window and use the results to calculate 90% confidence intervals for the seasonality metrics  and
and  . We further estimate the median sine parameters for water temperature T and discharge Q as references for nitrate. We assume no trend of these parameters and therefore perform the above-mentioned bootstrapping approach once for the entire Q and T time series.
3.3.2. MSSM
To test our hypothesis, we developed the MSSM considering only mixing ratios of point and diffuse source components (ad
and ap
) to explain in-stream nitrate concentration seasonality. The seasonal oscillations are, as for the time series analysis described above, approximated with sine functions. As any sine function can be expressed as a composite of multiple sine functions with the same period (Smith 2007), we express the total nitrate concentrations  as a composite of point and diffuse source nitrate:
where the subscripts p and d represent nitrate contributions stemming from point and the diffuse sources, respectively. The sine function parameters ( ,
,  and
and  ) can be derived using the following trigonometric equations (Smith 2007):


The procedure of choosing values for the parameters ap , bp , φp , ad , bd , φd and estimating their uncertainties is described in detail in sections S1.3–S1.5. In summary, we base the diffuse source sine parameters bd and φd on parts of the time series where diffuse source pollution is assumed to be responsible for most of the riverine nitrate. The parameters for point source nitrate are based on the seasonality of discharge, assuming constant effluent loads over the year with varying dilution by river discharge. ad and ap are conceptualized based on the above described, nitrate relevant socio-technological transitions (figure 1(a)).
4. Results and discussion
4.1. Mean concentrations and seasonality metrics
The annual mean nitrate concentration at the catchment outlet generally increased from 2.7 mg l−1 in 1954 to 4.2 mg l−1 in 1992, with an interim peak of 3.5 mg l−1 in approximately 1972 (figure 3(a)). After 1995, the annual mean concentrations declined, reaching the mid-1950s level of ca. 2.7 mg l−1 in 2010. The double peaks in 1972 and 1992 are much less visible when ammonia and nitrate concentrations are summed (figure S5), which suggests variability in transformation between both nitrogen species. A possible explanation for this could be different rates of nitrification due to changes in oxygen concentrations in the river. Adams et al (2001) linked abrupt changes in nitrate concentrations of the Elbe around 1990 to this mechanism.

Figure 3. Characteristics of the long-term nitrate–N concentration time series measured at Geesthacht, near the Elbe outlet: (a) flow normalized annual and seasonal mean nitrate–N concentrations. Shaded areas represent 90% confidence intervals. (b) Seasonal amplitude  derived from the observed time series and simulated by the mixed source succession model (MSSM), (c) phases φ, for nitrate (simulated), river discharge (Q) and river water temperature (T). ψ represents day of the year with the minimal value. For Q and T, φ and ψ are the median results of 1000 sine fits on bootstrapped data from 1954 to 2019. For
  and
and  1000 sine fits on bootstrapped data were computed for moving windows of five years length, with 90% confidence intervals shown with error bars. The vertical dashed lines separate the stages as described in our hypothesis (figure 1) but their exact position is uncertain.
Download figure:
Standard image High-resolution imageHowever, in addition to these relatively well understood (Worrall et al 2014, Ehrhardt et al 2019, Westphal et al 2019) long-term changes in mean concentration, we also observed multi-decadal changes in nitrate seasonality (figures 3(a)–(c)).
The period 1954–1958 showed a low seasonal amplitude ( ) and highest concentrations during summer/fall (
 ). From 1958 to 1972, the seasonal amplitude remained low but
  decreased to
  . In 1972, the first regime shift in seasonality occurred, marked by simultaneously increasing winter/spring and decreasing summer/fall concentrations, gradually increasing
  and an abrupt change in
  from
from  to
to  .
.  changes abruptly from
  to
to  but the
  shows only a gradual increase. The confidence interval of
  also decreased strongly after 1972, with the earlier large uncertainty a consequence of the low seasonal amplitude (determining which day has the highest concentrations is difficult when concentrations are similar around the year). After the rapid changes around 1972, all seasonality metrics remain similar until
  , even though annual mean concentrations continued to rise, as described above.
We interpret the period from 1954 to 1990 as the pollution part of the trajectory (stages 2 and 3), containing the shift from higher concentrations in summer/fall (1954–1958) to constant concentrations throughout the year (1959–1972), and then maximum concentrations in winter/spring after 1993. Both stages are characterized by low seasonal amplitudes, which fits our hypothesis of a change from point to diffuse source dominated stage.
It is remarkable that before 1972, changes in annual mean concentrations did not propagate into seasonality changes (figure 3(a)). Following our hypothesis, this would mean that both point and diffuse source contributions changed almost in concert. Processes that preserve a given seasonal pattern even though nutrient sources change (e.g. agricultural nitrogen surplus figure S2) are not known to us.
After 1972, summer/fall and winter/spring concentrations diverged, indicating a change in the relative importance of nitrate sources. This period coincides with the agro-industrial revolution in the GDR, which included intensified fertilizer use (Bauerkaemper 2004) and thereby nitrogen surplus from agricultural areas (figure S2). This increase in diffuse source contributions is consistent with the observed increase in winter/spring concentrations during this period (figure 3(a)). The slight decrease on summer/fall concentrations was not expected by our hypothesis. Possible reasons could be changes in in-stream nitrification as described above or improvements in waste water treatment.
The distinct seasonality signatures observed during the period from 1990 to 2019 are consistent with the proposed pollution recovery stages 4 and 5, which also align with the expected timing of water quality improvements due to socio-economical changes associated with the German reunification. The seasonal amplitude  increased from 0.2 to 0.5 between 1990 and 2005, indicating different trends in point and diffuse source contributions.
Also, beginning in approximately 1990 the summer/fall concentrations started a 15-year decreasing trend, which matches the vast improvement of wastewater treatment that succeeded the German reunification (IKSE 1998, Adams et al 2001). We interpret 1990 as the beginning of Stage 4, which is characterized by a decrease of point sources without a reduction of diffuse sources. Evidence of Stage 5, characterized by decreases in diffuse source contributions, did not appear for several more years, with decreases in Winter/spring concentrations beginning in approximately 1995 and continuing steadily until the end of the time series.
From calculated agricultural nitrogen surplus rates (figure S2) and the literature (Bauerkaemper 2004) we know that the collapse of the GDR economy had a strong and immediate impact on agriculture. However, the response of winter/spring concentrations appeared only some years afterwards. Similar lagged responses of nitrogen concentrations have been observed by many authors and are mostly linked to subsurface travel times (Wang et al 2013, Van Meter and Basu 2015, Worrall et al 2015, Ehrhardt et al 2019).
Another sign of recovery is the decrease in  : before 1990, the annual maximum of nitrate concentrations
  were very similar to the annual maximum of discharge (≈day 70 figure 3(c)) indicating a positive relationship between them. A causal explanation for this is that in-stream nitrate concentrations are driven by mobilization from nitrate source zones in the discharge producing part of the catchment (Musolff et al
2015). After 1990,
were very similar to the annual maximum of discharge (≈day 70 figure 3(c)) indicating a positive relationship between them. A causal explanation for this is that in-stream nitrate concentrations are driven by mobilization from nitrate source zones in the discharge producing part of the catchment (Musolff et al
2015). After 1990,  decreased to
  , coinciding with the annual minimum of river water temperature. Inverse relationships between nitrate and temperature have been reported e.g. by Van Meter et al (2020) and linked to controls of biological processes (e.g. denitrification, assimilation) on in-stream concentrations. In their study Van Meter et al (2020) found this behavior in less human-impacted catchments with large shares of forests and wetlands. Therefore this decrease in
  can be interpreted as a change from a pure source-controlled seasonal regime to one in which concentrations are actively modulated by sinks, such as biological processes.
The MSSM captures the overall observed changes in nitrate seasonality and demonstrates that long-term changes in the mixing ratios of point and diffuse source are a plausible explanation for the observed seasonality changes. The mean model performance for the seasonal amplitude is roughly consistent over all time periods (RMSE 0.06–0.1, figures 4(a)–(c)) while the prediction of the phase improves with time (from 64 days to 16 days). This gradual improvement is expected, as we used data from 2010 to 2016 to define the seasonal parameters of the diffuse source contribution. While the observed seasonal amplitudes mostly lie within the confidence interval of the MSSM, they show a large scatter around the mean predictions. We assume this to be caused by inter-annual variability in the nitrate concentrations, which is not considered in the MSSM (scatter of observations in figures 4(d)–(f)). In the phase  however, we find considerable deviation of the predicted means before 1990. We find a consequent overestimation between 1965 and 1985 (figures 3(b) and (e)). Furthermore, the predictions show a gradual decrease of
  before 1992, while the observed data show step changes in 1958 and 1973. As noted above, the 1958 step change could be intensified by our data analysis, as phase estimation is highly uncertain when the seasonal amplitude is low. The step change around 1972 is unlikely to be an artifact, as it is also visible in flow-normalized values from the WRTDS method (figure 3(a)).

Figure 4. Observed and simulated seasonality metrics (a)–(c) for three periods along the temporal trajectory. The distributions for the parameters are based on 100 bootstrap resamplings of observed and simulated data. Mean root mean square errors (RMSE) and their standard deviations are shown based on the same 100 resamplings. Panels (d)–(f) show the simulated mean nitrate seasonality for each period together with all nitrate concentration records.
Download figure:
Standard image High-resolution image
4.2. The role of in-stream nitrate retention
Our simple model approach did not explicitly include in-stream retention of nitrate, which is known to play a large role in the Elbe—at least after 2005 (Deutsch et al
2009, Ritz and Fischer 2019). In-stream processes were estimated to have attenuated up to 30% of nitrogen inputs to the Elbe during summer (Ritz and Fischer 2019), but it is unknown how this quantity changed over the pollution/recovery trajectory. As we base the diffuse source component on concentration data measured near the outlet after the year 2010, in-stream processing is implicitly included in our parameterization of diffuse source seasonality. While we did not include temporal changes of the in-stream retention, we tested how those changes would affect the observed seasonality parameters  and
and  . Our findings suggest that increased retention will lead to higher
  and lower
  values (figure S8) which is consistent with the seasonal trends observed over large parts of the time series. However, the magnitudes of the observed
  changes cannot be explained by realistic changes of in-stream retention (section S1.3.4). Therefore we conclude that, while changes in in-stream retention might have occurred, they can only contribute to but not cause the observed seasonal changes.
4.3. Limitations of this study
The findings of our study should be viewed with consideration of its limitations: In our hypothesis, we separated five distinct seasonality states of which we were able to identify four in our data. We speculate that the results might be different considering longer time series which are currently unavailable in this catchment. We were not able to validate the proposed point and diffuse source ratios as (a) no historical data on wastewater nutrient loads or their proxies are available for Germany and (b) even though agricultural nitrogen surplus may be estimated, it remains unknown which parts of that reach the river network. Also not considered here were potential time lags from subsurface transport, or mixing of nitrate from different compartments.
4.4. Environmental implications
Independent from our hypothesis we showed that annual mean concentrations and seasonal behavior of riverine nitrate can be completely decoupled. Furthermore, our results showed that the stark changes in nitrate seasonality observed in the Elbe over the last 66 years can be explained by human actions. To our knowledge, those changes were unintentional and unnoticed, at least from an environmental management perspective. These changes in seasonality have potentially dramatic implications for ecosystems: For example, changes in the seasonality of nutrient inputs to Lake Eerie have been linked to the re-occurrence of cyanobacteria blooms (Stumpf et al 2012, Stow et al 2015). Correlations between algae blooms and seasonal nutrient availability have also been reported for Lake Taihu, China (Xu et al 2015) and Europes coastal zones (Romero et al 2013).
While we only focused on nitrate seasonality, we consider changes in other nutrients such as phosphorus and carbon likely, as their fluxes are also anthropogenically influenced (Grizzetti et al 2012, Asmala et al 2019). These changes may either buffer or enhance alterations in the overall riverine carbon, nitrogen, and phosphorus ratios with unknown consequences. Finally, we note that long-term changes in nutrient seasonality may also be expected to follow successive development stages in other catchments, with local adjustments to the conceptualisation. For example, the Thames (Worrall et al 2014), Seine (Billen et al 2007) and the Vltava River (Kopáček et al 2013) show similar pollution-recovery trajectories of annual mean nitrogen or nitrate concentrations to the Elbe case study. Their trajectories have been linked to changes in nutrient sources (Billen et al 2007, Kopáček et al 2013, Worrall et al 2014) but the changes in nitrogen seasonality that we would expect based on our findings have not been investigated. However, paths other than the pollution-recovery trajectory demonstrated by many developed countries are also possible. For example, Vörösmarty et al (2015) point out that Switzerland and Singapore took proactive measures early and thereby avoided vast pollution of their rivers.
5. Conclusions
Using a parsimonious model approach considering mixing ratios of point and diffuse source nitrate inputs over a multi-decadal trajectory, we developed a mechanistic explanation for significant changes in the in-stream nitrate seasonality of Central Europe's fourth-largest river, the Elbe, in the period 1954–2019. We hypothesized temporal transitions in the contributions of point and diffuse sources to stream nitrate seasonality, based on societal responses to water quality problems in a hierarchical needs-based model. Our model predictions showed strong correspondence to observed changes in the patterns of nitrate seasonality in the Elbe catchment. Transitions from summer peaks with weak seasonal amplitudes to winter peaks with high amplitudes were attributed to multi-decadal shifts in the mixing ratios of point and diffuse source nitrate inputs. We showed that over decadal scales human activities can completely change nutrient seasonality and that annually aggregated values may be decoupled from seasonal behavior, which argues for the further consideration of nutrient seasonality in the management of aquatic ecosystems.
Acknowledgments
We thank the Flussgemeinschaft (FGG) Elbe for supplying the water quality and discharge data from the Elbe river. A W was funded by the Helmholtz International Research School TRACER, Grant No. HIRS-0017. J W J was supported in part by the National Science Foundation under Award Number 2000649. This project was supported by the GlobeWQ project (Project Number: 02WGR1527A) financed by the BMBF funding measure Water as a Global Resource (GRoW).
Data availability statement
Nitrate, discharge and river water temperature time series can be downloaded from the FGG Elbe web portal www.elbe-datenportal.de/FisFggElbe/.
The data that support the findings of this study are available upon reasonable request from the authors.
Author contributions
D B, S J and A W conceptualized the paper, with feedback from all other co-authors. J W J supervised the data analysis and model simulations. A W carried out the data analysis, model simulations and visualization of the results. A W wrote the manuscript with contributions from all authors.
The data used in this work was downloaded on 8 June 2020.