

Abstract
One of the greatest challenges for land managers is to maintain a multitude of ecosystem services while reducing hazards posed by wildfires, insect outbreaks, and other disturbances accelerating due to climate change. In response to limited available resources and improved technical abilities, natural resource managers are increasingly using geospatial data to plan and evaluate their management actions. Large amounts of public resources are invested in research and development to improve geospatial datasets, yet there is limited knowledge about the specific data types and data characteristics that clients (e.g. land managers) prefer. Our overall objective was to investigate what geospatial data characteristics are preferred by natural resource professionals to monitor and manage forests and fuels across large landscapes. We performed an online survey and collected supplemental data at a subsequent workshop during the 2020 Operational Lidar Inventory meeting to investigate preferred data use and data characteristics of data users of the Pacific Northwest. Our online survey was completed by 69 respondents represented by managers and natural resource professionals from tribal/state, federal, academic, and industry/consulting entities. We found that metrics related to species composition, total biomass/timber volume, and vegetation height were the most preferred attributes, yet preference differed slightly by employment type. From the workshop we found that metric preferences depend upon which management priorities are central to the management application. There was preference for data with Landsat pixel-level (30 m) spatial resolution, annual temporal resolution, and at regional spatial extents. To maintain viable ecosystem services in the long term, it is important to understand the metrics and their data characteristics that are most useful. We conclude that our study is a useful way to understand (a) how to improve the data utility for the users (clients) and (b) the development and investment needs for the data developers and funders.
Export citation and abstract BibTeX RIS

Original content from this work may be used under the terms of the Creative Commons Attribution 4.0 license. Any further distribution of this work must maintain attribution to the author(s) and the title of the work, journal citation and DOI.
1. Introduction
Climate change is increasing the need for accurate information for land managers to overcome climate-induced challenges to sustainably manage our collective natural and cultural resources (Keenan 2015, Herold et al 2019). Recent focus has been on adaptive ecosystem management, in which decision-makers operate flexibly in the face of uncertainty, learning from their desired outcomes and unintended consequences, and adjusting practices accordingly (Gray 2000, Williams 2011). As research has mainly focused on impacts of climate change and assessment of vulnerabilities, multi-disciplinary approaches are emerging to improve decision making across different institutions, agencies, and stakeholders (Keenan 2015). However, to improve adaptive management and increase learning opportunities for natural resource managers, we need appropriate geospatial data that managers can utilize to evaluate management actions or constrain management alternatives. Managers include decision-makers of public land management agencies at federal, tribal, state, and local levels, as well as forest industry lands. Recent improvements in remote sensing (including data availability, analysis and accuracy, software development, and geographic information system (GIS) skills of natural resource managers) have led to opportunities to improve adaptive forest management (e.g. Andrus et al 2021). A key uncertainty, however, is information about the attributes and characteristics of the data that are most useful to managers or other data users.
Geospatial data products are commonly used for monitoring and managing landscapes. For instance, geospatial data products are used for monitoring vegetation cover (Sexton et al 2013), vegetation structure (Falkowski et al 2009), biodiversity (Gould 2000), fuel loads (Keane et al 2001), forest inventory (McRoberts and Tomppo 2007), and carbon stocks (Hudak et al 2020). In addition to monitoring, these data are also used for management applications, such as planning of fuel treatments, thinning projects, or invasive species control. Furthermore, multi-temporal remote sensing can be used for assessing change across the landscape related to disturbances (e.g., fire: Eidenshenk et al 2007; bark beetles: Meddens and Hicke 2014) useful for planning salvage logging, erosion control, and/or revegetation efforts. Remote sensing is a powerful tool to evaluate and assess management effectiveness for informing adaptive management (Camarretta et al 2020), due to regular revisit times and synoptic views (i.e., wall-to-wall information over large areas) (Lechner et al 2020).
Common data characteristics of geospatial data include the spatial resolution, temporal resolution, thematic resolution, and extent of the data. This is often based on the sensor(s) characteristics used to develop metrics (i.e., individual measurements (e.g. tree height)) from a dataset, but sometimes practical considerations, image fusion, and/or image enhancement techniques are used to improve spatial, temporal, spectral, and/or thematic resolution. There are multiple readily available global datasets such as carbon stocks (e.g. European Space Agency Biomass Maps; Santoro and Cartus 2019) and landcover (e.g. Copernicus Land Cover Data; Buchhorn et al 2020), and regional/continental datasets such as fire severity (e.g. MTBS data; Eidenshenk et al 2007) and vegetation/fuel characteristics (e.g. Landfire; Rollins 2009). Also, remote sensing scientists are constantly developing new products with higher spatial, temporal, and thematic resolutions over large extents. These characteristics of remotely-sensed data products traditionally have been limited by technical considerations, such as constraints of sensor characteristics (such as spectral resolution, spatial resolution, and temporal resolution; Key et al 2001) and computing storage and processing capabilities (Ma et al 2015). However, in recent years, advanced remote sensing equipment and computing technologies have allowed for an expanded range of data preparation and sharing (Kennedy et al 2009). In addition, natural resource managers are becoming more capable in using geospatial technologies (e.g. GIS and digital mapping software; Merry et al 2007), partly due to recently improved processing capabilities (e.g. Google Earth Engine) (Gorelick et al 2017, Stahl et al 2021). This situation presents a window of opportunity to consider the information needs of users and the data characteristics they desire.
Large amounts of resources are invested by federal science agencies (e.g. NASA and USGS), land management agencies (e.g. USFS and BLM), state agencies, and universities to collect and analyze geospatial data (e.g. NASA 2021), yet there is limited knowledge about the specific data characteristics that clients prefer. Furthermore, information regarding differences in data usage between clients (e.g. industry versus governmental natural resource professionals) or differences between management objectives (e.g. placing of fuel treatments versus timber harvest plans) can further specify data needs. Interactive social science techniques—for example surveys, workshops, and interviews (Patton 2002, Rodriguez-Franco and Haan 2015)—provide a novel approach to potentially improve data utility for desired applications (e.g. Martinez et al 2019, Feyisa et al 2020). Therefore, allocating funding to projects designed to include these interactive techniques might offer a good return on investment for agencies or institutions. We propose that in the long run, interactive techniques will allow agencies and institutions to expand knowledge to maximize the utility of remote sensing data, especially in areas where geospatial information is needed or desired. Here, we draw upon data collected through an online survey and a subsequent regional workshop that focused on preferred datasets and data characteristics of forestry professionals in the Pacific Northwest.
Our overall objective was to investigate geospatial data characteristics preferred by natural resource professionals to monitor and manage forests and fuels across large landscapes. We assess which individual data attributes (hereafter referred to as metrics) are the most useful for our stakeholders and subsequently assess desired characteristics of the geospatial data (i.e. spatial resolution, temporal resolution, extent, precision, and format). We draw upon data collected through an online survey and a subsequent regional workshop that focused on data attributes and data characteristics preferred by forestry professionals in the Pacific Northwest, a region relatively rich in geospatial data types and where forest and fuel management issues are important ecologically, economically, and socially.
2. Methods
We organized an interactive session during the 2020 Operational Lidar Inventory (OLI) meeting that centered around data use and preferred data characteristics. The OLI meeting is a regional meeting that has been held annually for the last six years in Olympia, Washington since 2016 and is attended by federal, tribal, and state forest managers, forest industry professionals, consultants, and academics. Attendance has increased annually from approximately 35 people in 2016 to approximately 85 people in 2020. The OLI meeting focuses on the exchange of remote sensing techniques and ideas that have applicability in forest inventory and forest mapping applications. The main themes of the OLI 2020 meeting included discussions and presentations of the latest lidar technology in carbon monitoring, fuels mapping, and species mapping for forest management. Participants are tasked with developing, delivering, and/or utilizing geospatial data for forest management purposes in their profession and attend the OLI meeting to learn about novel (lidar) remote sensing techniques and state-of-the-art forest inventory methodologies.
In preparation for our interactive session prior to the 2020 OLI meeting we sent out an online survey to meeting registrants with initial questions about people's professional background (e.g. employment sector) and their preferences for geospatial data characteristics for forest and fuel management applications. The pre-workshop survey was packaged as an element of the meeting registration form, which contributed to a high response rate (94.5%; 69 out of 73 registrants completed the survey). Subsequently, we used the preliminary survey data to develop an interactive session centered around six questions during the interactive session at the workshop.
2.1. Pre-workshop survey
The online survey—Mapping vegetation structure and fuel attributes for natural resource management (appendix
2.2. Pre-workshop survey data analysis
We ranked the perceived usefulness of the geospatial metrics according to the survey participants and plotted the mean and standard deviation of the Likert scale (with very useful: 4, useful: 3, somewhat useful: 2, and not useful: 1. In addition to the provided metrics for which we had a Likert score, we also ranked the 'other useful geospatial metrics' that were entered more than once and ranked the number of times these additional metrics were listed. Furthermore, we calculated the standard deviation of the mean importance score for each employment type separately to investigate whether there were different preferences by occupational background. To generate four groups with a sufficient number of participants for comparison, we categorized the occupational backgrounds of professionals with similar land management duties and data application procedures into four categories (i.e. tribal/state agencies, federal agencies, industry/consulting, and academics). A total of 159 individuals were directly invited (through email) to attend the OLI 2020 meeting and 73 individuals registered for the meeting. However, 4 individuals did not complete the entire registration/survey form, resulting in 69 respondents with approximate equal representation of tribal/state agencies (20%), federal agencies (14%), and academics (25%), and a higher proportion of industry/consulting (41%) employment type participants (figure 1). For each of the spatial resolution, data extent, and data precision characteristics, we standardized the responses as % relative preference by employment type and plotted the data as bar graphs to evaluate the general data characteristics preference and differences by employment type. With regard to the open-ended comments of survey section 3, the responses were coded and analyzed by type of data characteristic preference. These data supplemented the closed-ended data of survey sections 1 and 2.
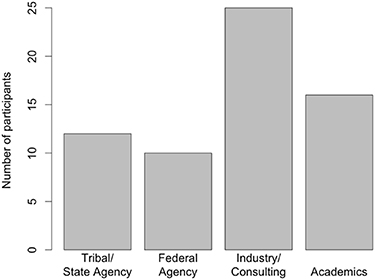
Figure 1. Number of online survey participants by employment type.
Download figure:
Standard image High-resolution image2.3. Workshop data
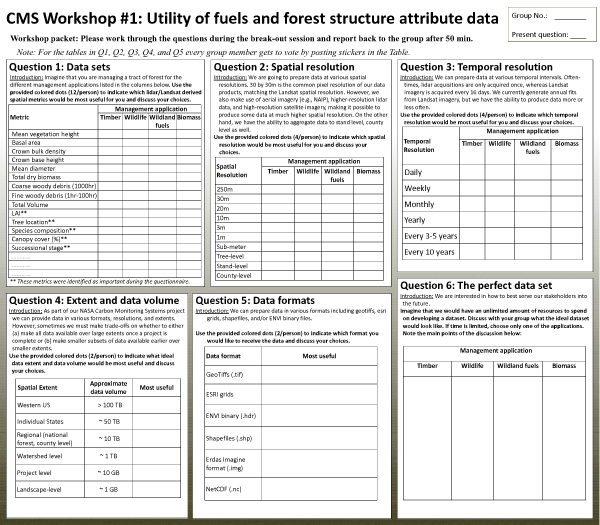
The interactive session at the OLI workshop was designed to further increase the understanding about the usefulness of geospatial metrics and their characteristics by facilitating a discussion of six pre-defined questions on a large poster (appendix
2.4. Workshop data analysis
The data collected during the interactive component of the workshop were analyzed to provide insight into the preferences of participants. For the geospatial metrics, spatial resolution, and temporal resolution, we analyzed the data as follows: We first summed the number of selections (i.e. each sticker represents one selection) separately by management objectives (i.e. timber, fuels, wildlife, and biomass) for each group. Next, we divided the number of selections by the total number of selections per category (e.g. species composition, vegetation height, etc) and multiplied that fraction by 100 to obtain a percentage (preference %). We then calculated the mean, standard deviation, and standard error for each category and management type across the six groups. For the desired spatial extent and data type we calculated the average preference (%) across the different categories as these questions were not split by management type. The data were plotted as bar graphs for interpretation and to assess differences in preferences of groups of workshop participants. In some instances, participants did not register a response for a particular data preference characteristic ('non-response'). Consequently, the number of responses varies by data preference characteristic.
3. Results
3.1. Online survey results
The meeting had a strong contingent of both industry and academic participants (41% and 25% respectively), with sizeable contingents of tribal and state (20%) and federal agencies (14%) (figure 1). The largest proportion of participants was mid-career employees (>10 years; 50% of respondents), with equal numbers of representing the moderately early-career employment classes (5–10 years, 1–5 years (24%)), and only 1% being new to the field (<1 year), thus overall suggesting substantial experience in this area by participants. Fifty-four survey respondents (78%) indicated that they used geospatial data frequently or very frequently, while only five survey respondents (7%) indicated that they used geospatial data little or never. Use of forest growth models was more variable, with 30 (43%) indicating that they used forest growth models frequently or very frequently, while 22 (32%) indicated that they used forest growth models little or never. Finally, only a small proportion used fuel or fire models in their profession; 8 participants (12%) indicated that they used fuel/fire models frequently or very frequently, while 40 participants (58%) indicated that they used fuel/fire models little or never.
Basal area, mean tree height, and timber volume were the three geospatial metrics that received the highest mean importance scores, i.e. higher mean value of 3 (corresponding with a relative high Likert score) (figure 2(A)). Fine woody debris and forest floor fuels received the lowest mean importance scores, i.e. lower mean values than 2 (corresponding to a relatively low Likert score) (figure 2(A)). Of the optional additional geospatial metrics (metrics that were not provided in the survey), trees per acre and species composition were entered 5 times (18%), while stand structure class and quadratic mean diameters were entered 4 times (14%) (figure 2(B)). Several other metrics, such as leaf area index and individual tree crown location were selected as well, but less than 4 times.
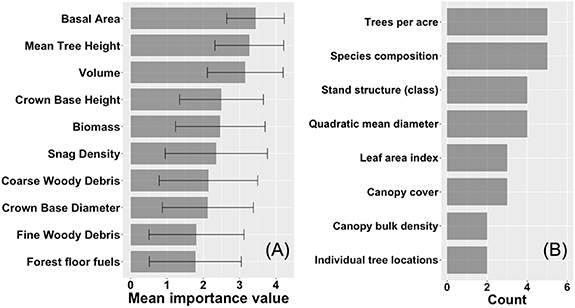
Figure 2. (A) Mean importance score (derived from a four-point Likert scale; error bars indicate standard deviation) for various geospatial metrics and (B) additional metrics identified in the survey by the participants. The metrics are ordered by importance from high to low.
Download figure:
Standard image High-resolution imageIn the mean importance score by employment type, we see slight differences in some metrics (figure 3). For instance, federal agency employees indicated that biomass is more important as compared to the other employment types. Academics indicated that timber volume was less important, and industry/consultant professionals indicated that snag density was less important as compared to the other employment types. All employment types registered 'important' for mean tree height and basal area, whereas all sectors scored 'less important' for fine woody debris and forest floor fuels.
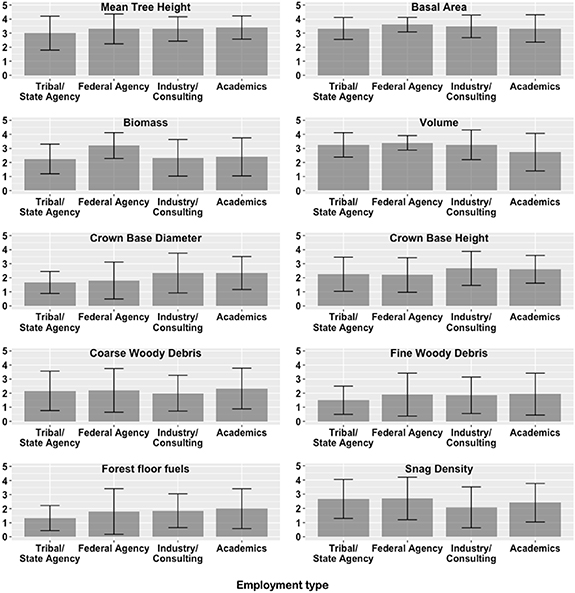
Figure 3. Mean importance score (derived from a four-point Likert scale; error bars indicate standard deviation) for various geospatial metrics by employment type of the participants.
Download figure:
Standard image High-resolution imageAcross all the employment types there was a clear preference for stand-level (0.5–5 acre) spatial resolution data, although more of the industry/consulting and academics participants indicated interest in higher resolution data (i.e. plot-level (1/10th acre) and pixel-level (30 m) data (figure 4(A)). Participants had a more variable response to the preferred data extent question, with all employment types indicating preference for larger extents, including national, regional, and/or national forest-level extents above a smaller project-level extent (figure 4(B)). More than 80% of state agencies and industry/consultant employment groups indicated the strongest preference for data with RMSE < 25% (i.e. very precise), while relative preference of federal agency and academics included a more mixed response, indicating that both data with RMSE < 25% or data with RMSE 25% or more but smaller than 50% (i.e. precise 25%< RMSE < 50%) fit their preferences and needs (figure 4(C)). None of the participants was interested in data with RMSE > 50%.
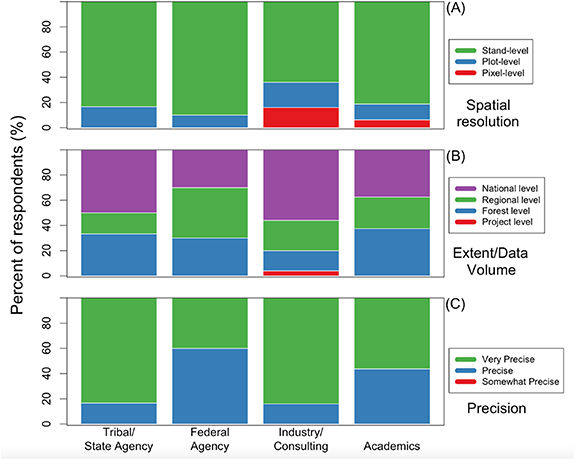
Figure 4. Percent of respondents (%) indicating preference for (A) spatial resolution, (B) data extent, and (C) precision geospatial data characteristics by employment type of the participants.
Download figure:
Standard image High-resolution image3.2. Workshop-derived data results
Mean preference for geospatial metrics—as calculated by the mean percentage of votes across groups—showed large variability by management objective (i.e. timber, wildlife, fuels, biomass) (figure 5). Species composition, total biomass, and vegetation height were the metrics that had the highest overall (mean of the 4 management objectives) preference (%), whereas fine woody debris, tree location, and leaf area index had the lowest preference (%). For the preference of the spatial resolution of data, there was more consistency across management applications, with the 30 m, sub-meter, and county-level spatial resolutions having the highest preference (%) (figure 6). According to the combined preference (%), there was a slight preference for fuels data having higher spatial resolution (e.g. the 3 m spatial resolution for the fuels application: ∼30% (figure 6)) as compared to the other management objectives. The preference for temporal resolution was more consistent across management objectives. Overall, there was a clear preference for annual data, with >40% across all management objectives. There was little interest in more frequent data for timber, biomass, and wildlife as compared to the fuels management objective, where there was some interest in daily data (figure 7). At least some people were interested in all data extents, but the middle extent ranges were the most popular, with regional extent (equivalent to a western US national forest) being by far the most popular extent with 33% of the votes. There was a large amount of variation in participant's interests in data extents, with regional data proving the most popular (figure 8). Vote proportions for standard raster or vector file formats, i.e. GeoTiffs (56%) and Shapefiles (25%), were substantially higher than proprietary file formats such as ERDAS, ENVI or ESRI grids or multidimensional file formats, i.e. netCDF (figure 9).
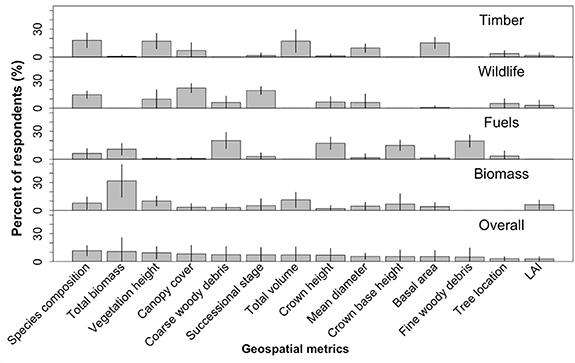
Figure 5. Mean percent of respondents (%) indicating preference for geospatial metrics split by four different management priorities (i.e. timber, wildlife, fuels, and biomass). The results are the mean and standard deviation of six different focus groups. The metrics are ordered by overall importance from high to low.
Download figure:
Standard image High-resolution image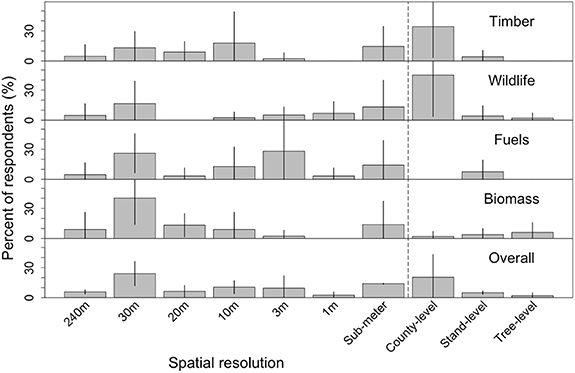
Figure 6. Mean percent of respondents (%) indicating preference of the desired spatial resolution of geospatial data split by four different management priorities (i.e. timber, wildlife, fuels, and biomass). The results are the mean and standard deviation derived from six different focus groups.
Download figure:
Standard image High-resolution image
Figure 7. Mean percent of respondents (%) indicating preference of the desired temporal resolution split by four different management priorities (i.e. timber, wildlife, fuels, and biomass). The results are the mean and standard deviation derived from 6 different focus groups.
Download figure:
Standard image High-resolution image
Figure 8. Mean percent of respondents (%) indicating preference of the desired spatial extent for management purposes. The results are the mean and standard deviation derived from six different focus groups.
Download figure:
Standard image High-resolution image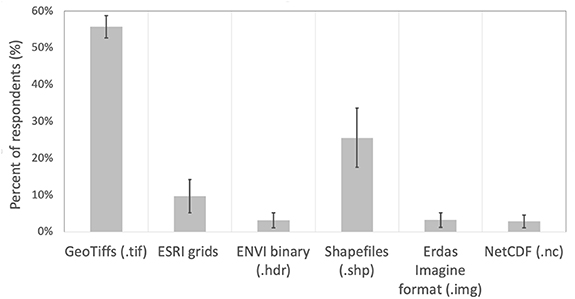
Figure 9. Mean percent of respondents (%) indicating preference of the desired geospatial data type for management purposes. The results are the mean and standard deviation derived from six different focus groups.
Download figure:
Standard image High-resolution image4. Discussion
To inform adaptive management for maintaining viable ecosystem services in the long term, it is important to understand which metrics and data characteristics are most useful to natural resource professionals (Kennedy et al 2009). We conducted an online survey and organized a subsequent interactive workshop to explore and improve the understanding of the types of data and data characteristics that are preferred for forest and fuels resource management applications (e.g. planning and evaluation of management activities). We found that metrics related to species composition, total biomass/timber volume (e.g. basal area and aboveground biomass), and vegetation height are most preferred. Besides a consensus on the usefulness of certain metrics, there were differences in perceived usefulness between other metrics depending upon the purpose or management application for which the data were used (figure 5). Furthermore, we found slight differences in the preference of some metrics by employment sector (figure 3). For instance, federal agency employees indicated a higher preference for a variety of metrics, including biomass and snag density, as opposed to other employment types. This is probably related to federal mandates and multi-purpose management strategies (Manning et al 2018, Spies et al 2018) as opposed to other organizations that might be more concerned with a narrower range of management goals, such as wildfire prevention, habitat preservation, or timber production.
This study provides geospatial data developers with information, disaggregated by employment sector and management objectives, about the preferences and needs of the users of their products. This information is a valuable reference to improve the development of new remote sensing data products. At the same time, geospatial data developers may find this study useful to bear in mind the variability among data users and may be conscientious about whether a particular product is designed to meet the needs of a particular employment sector or multiple employment sectors. If geospatial data developers have the flexibility to aim for the highest spatial and temporal resolution, largest extents, and provide many attributes, the products can be resampled, clipped, and subset to meet a broad variety of needs—although this will impose additional resource demand (cost, staff time) than coarser, smaller extent datasets with fewer attributes. The findings here can aid in targeting compromises in data configurations to best meet the greatest number of stakeholders needs with finite resources.
From the online survey, we found that there was a consensus in the need for precise to very precise data that span larger extents. The finding that data users prefer precise data with RMSE < 25% (or data with reduced uncertainty) aligns with an earlier study, in which the majority (>55%) of digital elevation model (DEM) users indicated that uncertainty is 'very' or 'somewhat' important (Wechsler 2003). Even though we found that precision is important for data users it is still unclear to us what scale of precision data is useful to the users. Precision (or uncertainty) is often communicated through a (global) measure of fit (e.g. an R2, RMSE, or overall accuracy). While it is possible for many data developers/modelers to quantify the uncertainty at the pixel-level (e.g. Mauro et al 2016), most available geospatial data do not have this associated spatially explicit uncertainty data (but see Hudak et al 2020). More research is needed on the particular metrics (e.g. standard deviation, confidence intervals, # of votes from a randomForest model) and scale (e.g. global or pixel level) of uncertainty that data clients/users prefer and how this uncertainty data influences decision making. In addition, more information is needed to understand what kind of trade-offs users are willing to accept (e.g. receiving data with higher spatial resolution at smaller extents versus coarser spatial resolution data at larger spatial extent) is an important topic for future research.
The workshop responses provided further information and showed slight differences in preference of spatial and temporal resolution for different management applications. For instance, we showed that there was a slight preference for higher spatial and temporal resolution for forest fuel data applications compared to most other metrics. We note that we intentionally broadly defined the management applications; for instance, the fuels application was not further defined into more specific categories, such as suppression, emission, or fire prevention. Future research could further specify data use within a specific target group (e.g. fuels managers) and further investigate the use and needs of geospatial data for more specific uses.
By combining two interactive techniques (an online survey and an in-person workshop) we could provide additional context to improve our understanding of natural resource professional preferences, which would not have been possible when using just a single interactive technique. These novel interactive techniques can improve the fit between product development and user needs by expanding insights related to data use and preference on one hand and possible development of novel datasets by scientists (e.g. university collaborators) and funding-agencies (e.g. NASA) on the other hand. For instance, we found that species composition is regarded as an important metric (e.g. Hudak et al 2009); however, many remotely sensing methods at moderate resolution (i.e. ∼30 m pixel resolution) are not able to resolve individual tree species within mixed conifer forests. This points to a need to develop tree species-specific maps and this research topic might thus be a strategic investment choice for funding agencies leading to accelerated data development with improved precision.
This study focused on stakeholder data needs with respect to spatial data products related to a recently completed NASA-sponsored project (Hudak et al 2020) that is currently expanding to other themes including forest structure (e.g. tree height and cover), volume, carbon, and forest fuels. We did not, for example, include inquiries into the usefulness of the many landcover products and other data types that may be available and useful (e.g. land ownership, wildland urban interface, DEMs, disturbance maps). We further note that by focusing on a specific meeting (i.e. the OLI 2020 meeting), we did not sample across a representative group of natural resource managers across the entire northwestern U.S. The meeting participants, and hence our respondents, are weighted towards professionals who have a positive outlook on remote sensing technologies and are already familiar with them since the emphasis of the meeting is on OLI (the name of the meeting) and related technologies. Our data does not represent the forest analyst community at large, yet it provides a quantitative characterization of the preferences of analysts who are most likely to make use of geospatial data products. We further note that by combining the online survey with the workshop registration and including an interactive section in the meeting itself, we were able to achieve very high response rates. These rates are tempered somewhat by the fact that the meeting has a mailing list of 159 participants, and these participants are individuals who already have an interest in this topic and generally some familiarity with the meeting organizers. Further work is needed to understand the forest analyst community at large.
5. Conclusion
This study quantified the data characteristics of geospatial data preferred by natural resource professionals with an interest in remote sensing forest monitoring methods. To our knowledge, previous research has not documented user perspectives on remote sensing preferred characteristics. We found that metrics related to species composition, total biomass/timber volume, and vegetation height were the most preferred by the participants in this study, with differences in perceived usefulness between other metrics depending upon the purpose or management objectives for which the data were used. In addition, we found differences in the preference of some metrics by employment sector. These results suggest that geospatial data developers have an opportunity to improve adaptive management by developing or improving products with these metrics or characteristics. At the same time, data developers should acknowledge variability among data users. As such, developers should have better insight into how to meet needs for a particular management objective or employment sector—or target multiple management objectives/employment sectors and develop a suite of products useful to a broader set of applications. Funders of data development may also consider tracking the relationship between stated preferences, such as those indicated in this study, and in outcomes or actual use in practice. These findings are useful for geospatial modelers, data developers, and funding agencies and show a desire for data-driven management decisions to improve assessments of forest productivity, ecosystem health, and fuel dynamics.
Acknowledgments
We would like to thank Maureen Duane (University of Washington) for help with developing the survey and all the individuals that participated in the survey and workshop. AJHM was supported by USDA NIFA, McIntire Stennis project WNP00009 and a NASA Carbon Monitoring System Program Award (80HQTR20T0002) to the USFS Rocky Mountain Research Station administered to Washington State University through a Joint Venture Agreement (20-JV-11221633-148). Consent was obtained for any human participants. WSU IRB Certificate of Exemption: IRB #18064-001 under 'Survey for mapping vegetation structure and fuel attributes for natural resource management'.
Data availability statement
The data that support the findings of this study are available upon reasonable request from the authors.
Appendix A.: Survey: ranking the importance of vegetation structure and fuel attributes for natural resource management

Download figure:
Standard image High-resolution image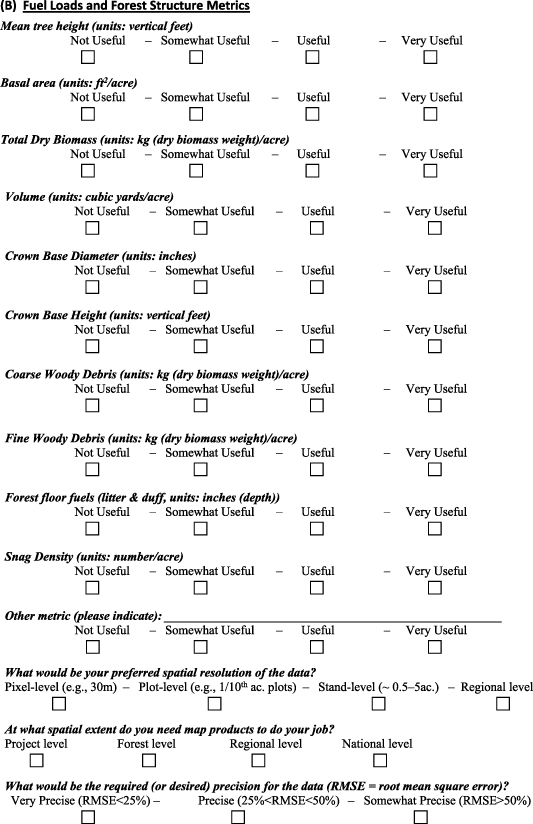
Download figure:
Standard image High-resolution image
Download figure:
Standard image High-resolution imageAppendix B.: Workshop poster for interactive session during OLI 2020
Download figure:
Standard image High-resolution image