

Abstract
Natural forest regeneration is a key component of global ecosystem restoration scenarios. Regenerated forests, however, may not persist and a better understanding of the drivers of forest persistence is critical to ensure the success of restoration efforts. We used 35 years of detailed land cover maps to quantify forest regeneration and study the drivers of regenerated forest persistence and longevity in the Brazilian Atlantic Forest, a restoration hotspot. We mapped over 4.47 Mha of native forest regenerated in the region between 1985 and 2019, of which, two thirds persisted until 2019 (3.1 Mha). However, mean age of ephemeral (i.e. cleared before 2019) forest regeneration was only 7.9 years, suggesting a rapid turnover of regrowing forests under certain conditions. Regenerated forests had greater longevity and probability of persistence in steeper slopes, close to rivers and existing forests, near permanent agriculture, and in areas with higher Gross Development Product and agricultural yield, but were less likely to persist in areas with higher rural-urban population ratios. Regeneration occurred predominantly in pasturelands and areas of shifting agriculture, but it was also less likely to persist within these dynamic landscapes. Specific public policies should stimulate forest regeneration in areas of consolidated agriculture, where forest permanence tends to be higher. The ephemerality of forest regeneration in the Brazilian Atlantic Forest highlights the importance of favorable conditions and policies that promote second-growth forest persistence in tropical regions. Conservation of regenerating forests is critical for meeting national and global restoration and climate mitigation goals.
Export citation and abstract BibTeX RIS

Original content from this work may be used under the terms of the Creative Commons Attribution 4.0 license. Any further distribution of this work must maintain attribution to the author(s) and the title of the work, journal citation and DOI.
1. Introduction
Natural forest regeneration (i.e. passive restoration) plays a major role in virtually every global restoration scenario (Chazdon and Brancalion 2019, Chazdon et al 2020) and is a cost effective strategy for achieving forest restoration goals (Crouzeilles et al 2020). Regenerated forests are expanding globally (Asner et al 2009, Song et al 2018) and currently account for more than half of tropical forests (Reid et al 2018). These forests have a vast potential to provide key ecosystem services, including biodiversity conservation, carbon sequestration and climate regulation and their protection is crucial for human well-being (Chazdon et al 2009, 2016, Poorter et al 2016, 2021, Strassburg et al 2016, Schwartz et al 2017). Nevertheless, it may take decades for regenerating forests to recover pre-disturbance species richness and biomass levels (Chazdon 2008, Poorter et al 2016, 2021, Reid et al 2018) and the many benefits they provide will only accrue if these persist over time (Reid et al 2018). Therefore, a better understanding of persistence of second-growth forests and its drivers is a crucial undertaking (Schwartz et al 2017, Sloan 2022).
Only a handful of studies, all conducted in Latin America, examined persistence of second-growth forests either at local (Reid et al 2017, 2018, Schwartz et al 2017) or larger scales. These have shown that regrowing forests have a high probability of being cleared within a few years of establishment (Reid et al 2017, 2018, Schwartz et al 2017, Nunes et al 2020) and that reversals of reforestation trends are common and may be widespread in the tropics (Schwartz et al 2020, Piffer et al 2021). Future studies of second-growth forest persistence at regional scales are paramount for designing policies that ensure landscape natural forest regeneration persistence and achievement of national restoration goals.
Moreover, our understanding of the factors that determine forest persistence is severely limited, as only a few studies examined the conditions under which second-growth forests persist. Furthermore, these few existing studies have yielded contrasting results, suggesting that the drivers of second-growth forest persistence can be highly variable and context specific (Schwartz et al 2017, Reid et al 2018). Our scarce knowledge of the drivers of regenerated forest persistence makes generalizations difficult and limits our ability to inform landscape management and conservation efforts (Schwartz et al 2017).
Here, we use a long-term, annual time series (1985–2019) of Landsat-derived land use cover maps (MapBiomas) to study, for the first time, the drivers of persistence of regenerated forests for an entire tropical forested ecosystem, the Brazilian Atlantic Forest (AF), a reforestation hotspot (Nanni et al 2019). We first map and quantify forest regeneration occurring across the AF, identifying regeneration that persisted or was re-cleared by the end of our study period. We then investigate the landscape and socioeconomic factors that influence three distinct metrics of regeneration dynamics: probability of forest regeneration, the number of years a regenerated forest persists, and the probability of survival of regenerated forests. Together, these three metrics encompass all the distinct stages of the forest regeneration process and allow for a more nuanced understanding of the drivers of forest regeneration and persistence in the region. Although it is expected that similar conditions that foster native forest regeneration should also lead to longer persistence, we do not know if these are indeed equivalent.
The AF is an ideal region for studying the persistence of second-growth forests. Numerous reports of increases in forest cover in the AF at both continental (Aide et al 2013, Nanni et al 2019, Schwartz et al 2020), regional (Crouzeilles et al 2020, Piffer et al 2021, Rosa et al 2021) and local scale studies (Rezende et al 2015, Bicudo da Silva et al 2017, Costa et al 2017, Molin et al 2017), mostly the result of natural forest regeneration (i.e. second growth), offer hope for the biome's conservation but also call for a better understanding of how long and under which conditions these new forests persist. Moreover, the region has long been a conservation priority, with an established legal framework designed to protect forests dating back to the early 90 s, and more recently with the AF Law of 2006. Given pressing conservation needs, high demand for ecosystem services and ambitious restoration commitments in the AF (Brancalion et al 2019, Crouzeilles et al 2020), this information is crucial.
2. Methods
2.1. Study area
The Brazilian AF is one of the most emblematic hotspots for biodiversity conservation (Myers et al 2000) and ecological restoration (Tambosi et al 2014, Brancalion et al 2019, Strassburg et al 2019, 2020). Previous studies estimate that about 28% of the original 129 Mha of native forest cover (figure 1) remains in the AF (Rezende et al 2018). Over 80% of the remnant forest is composed of patches <50 ha (Ribeiro et al 2009), resulting in highly fragmented landscapes (Rezende et al 2018). Furthermore, the ongoing loss of older forests in the region is masked by the increasing gains of younger forests, resulting in the overall rejuvenation of forest cover (Rosa et al 2021), posing challenges for the biome's conservation.
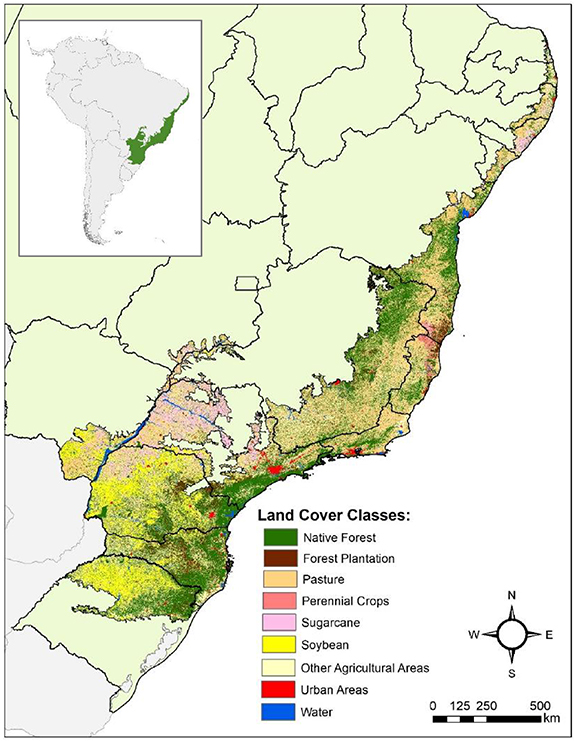
Figure 1. Land use and cover map of the Atlantic forest for the year 2019 (source data: MapBiomas collection 5). State boundaries are represented in black.
Download figure:
Standard image High-resolution image2.2. Forest cover data
We obtained native forest cover data from MapBiomas (Collection 5), a time series of annual land use and land cover maps from 1985 to 2019 derived from Landsat imagery using Google Earth Engine and Random Forests (Souza and Shimbo 2020). Global accuracy for land use and land cover maps is 90.7% and the product distinguishes native forest cover from forest plantations with 96% accuracy, allowing for more precise mapping of forest regeneration in the region (Rosa et al 2021).
2.3. Assessing second-growth forest persistence
To better understand forest regeneration and persistence processes, we tracked the fate of regenerated native forest pixels (30 m) over time using several criteria. First, we only classified a pixel as second-growth forest if it had been classified as a non-forest for at least three consecutive years prior to the 'regrowth' event, and the new forest pixel had to persist for at least three more years. We also excluded isolated native forest regeneration with less than 11 spatially connected pixels (approximately 1 ha) to reduce the influence of random noise or classification errors in the analysis. To ensure we captured forest regeneration processes and avoid the influence of possible classification errors in the first few years of the time series, we only considered pixels classified as natural forest regeneration on land previously classified as non-forest for the first four years of our study period (1985–1988). Finally, considering the large extent of plantation forestry in the region, we used a forest plantations layer (FBDS, 2019) to mask regenerated forest pixels located in places known to be silviculture and further eliminate potential classification errors.
We considered two types of regeneration in the AF (figure 2): (a) persistent regeneration, or those regenerated native forest pixels that persisted until 2019; and (b) ephemeral regeneration, or pixels that regenerated after 1989 but did not persist until 2019. We also characterized the longevity or age of regenerated forest pixels. For persistent regeneration, longevity was the number of years between the time a non-forest pixel was first classified as native forest and 2019, while for the ephemeral regeneration, longevity was the number of years between a regrowth event and the clearing event. Together, these two metrics provide a comprehensive measure of the duration of forest persistence in the AF over the study period.
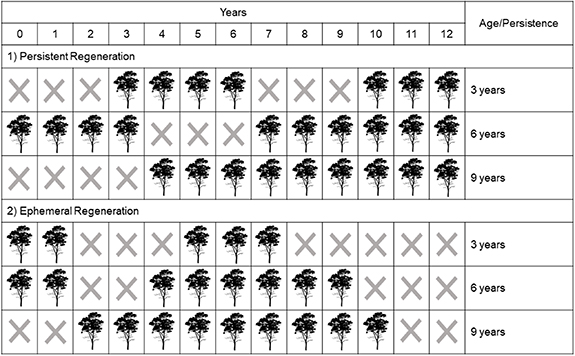
Figure 2. Illustrative diagram showing the two different types of forest regeneration mapped in the present study. The age of persistent regeneration is the time of permanence of the regenerated forests that survived until the last year of the analysis (here, in this example, year 12). The age of ephemeral regeneration is the longest permanence time of forests that regenerated after 1985, but were cut down before the last year of analysis (2019 or here year 12). This figure provides only six illustrative examples—it does not show every possible combination of regrowth and clearing events.
Download figure:
Standard image High-resolution imageTo characterize second-growth forest across the AF, we identified all regenerated forest fragments, both persistent and ephemeral, and produced regional maps by calculating several metrics for the two types of forest regeneration, including regenerated area in hectares, mean fragment size, and mean forest age. Finally, we calculated the percentage of native forest that regenerated (considering both persistent and ephemeral regeneration) in different land uses by using the 1985 land use cover map as reference, as well as the percentage of the ephemeral regeneration that was replaced by each land use by 2019. All analysis were conducted at the pixel scale (30 m) using the Google Earth Engine platform.
2.4. Landscape and socioeconomic data
We collected several landscape variables that may influence the persistence of forest regeneration, including slope, elevation, distance to roads, rivers and protected areas and surrounding land use/cover types in a 1 km buffer (native forest cover, agriculture, pasture, urban cover and silviculture). The choice of buffer radius was based on model performance for several potential radii (data not shown). Slope and elevation were calculated using the ALOS Global Digital Surface Model at 30 m spatial resolution. Distance to roads, rivers and protected areas were calculated using maps from the Brazilian Institute of Geography and Statistics (IBGE, 2019). Surrounding land use cover for a 1 km radius were derived from data from MapBiomas for 2000, the midpoint of our study period. Calculations were conducted in the Google Earth Engine platform.
We also collected socioeconomic data at the municipality scale that could determine persistence of second-growth forests (Schwartz et al 2017), including: (a) population density (rural, urban, rural-urban ratio and total); (b) percent of harvested area; (c) agricultural production; (d) agricultural yield; (e) number of farm jobs; and (f) municipal and per-capita gross domestic product. Socioeconomic data was collected at the municipality scale (total of 3014 municipalities) from periodical national census surveys by the Brazilian Institute of Geography and Statistics (National Agrarian and Demographic Census Surveys). All data are freely available at the SIDRA IBGE (https://sidra.ibge.gov.br) and at the Institute of Applied Economic Research (www.ipeadata.gov.br/) online databases. Percent harvested agricultural area for each municipality included both annual and perennial crops. We calculated agricultural yield by dividing total agricultural production in tons for each municipality (annual and perennial crops combined) by total harvested area.
2.5. Analysis of the drivers of second-growth forests persistence
We used generalized linear mixed models to investigate the drivers of second-growth forests persistence in the AF. To assess the factors influencing every potential stage of the forest regeneration process, we fitted models with three separate response variables: (a) probability of regeneration; (b) longevity/age of the regeneration; and (c) probability of clearance of regenerated forest pixels. Logistic regressions were used for probability of regrowth and clearance, and a negative binomial distribution was used for the longevity of regeneration since this variable was over dispersed. All three models included landscape and socioeconomic variables as fixed covariates (table 1) and municipality as a random effect to account for local scale factors that might affect second-growth forest dynamics. Analyses were conducted at the pixel level, allowing for a better understanding of the fine scale drivers behind regrowth and clearing processes, which rarely occur at the scale of entire forest patches in highly dynamic landscapes (Schwartz et al 2017). The complete dataset included between 78 000 and 133 000 30 m pixels (table 2).
Table 1. Socioeconomic, landscape and biophysical variables used in the analysis and their respective scale/resolution, source and year of reference. Socioeconomic variables were obtained from the Brazilian Institute of geography and statistics (IBGE).
| Explanatory Variables | Scale/Resolution | Source | Year |
|---|---|---|---|
| Socioeconomic | |||
| Population density (rural and urban) | Municipality | IBGE Demographic Census | 2002 |
| Municipal and per-capita GDP | Municipality | IBGE Demographic Census | 2002 |
| Percent harvested area | Municipality | IBGE Municipal Agricultural Production | 2000 |
| Agricultural production (tons) | Municipality | IBGE Municipal Agricultural Production | 2000 |
| Agricultural yield | Municipality | IBGE Municipal Agricultural Production | 2000 |
| Number of Farm Jobs | Municipality | IBGE National Agrarian Census | 2006 |
| Landscape | |||
| Elevation and slope | 30 meters | ALOS Global Digital Surface Model | — |
| Distance to roads and rivers | 30 meters | IBGE road and hydrography layer | — |
| Distance to protected areas | 30 meters | IBGE protected areas layer | — |
| Surrounding land use | 1 kilometer | MapBiomas land use cover maps | 2000 |
Table 2. Number of samples, probability distribution, AIC and R2 calculations for most parsimonious model for the longevity and probability of survival of regenerated forests in the Brazilian Atlantic forest.
| Model | Sample Size (pixels) | Probability Distribution | AIC | R2 | ||
|---|---|---|---|---|---|---|
| Fixed Effects | Random Effects | Full Model | ||||
| Probability of Regeneration | 84 569 | Binomial | 93 545 | 0.31 | 0.07 | 0.38 |
| Regeneration Longevity | 133 457 | Negative Binomial | 875 509 | 0.48 | 0.43 | 0.91 |
| Probability of Survival | 78 902 | Binomial | 83 479 | 0.32 | 0.11 | 0.44 |
To facilitate computation, minimize spatial autocorrelation, and ensure a representative sample of the data, we subset the data using several criteria. To include regenerated forest pixels of all possible ages (3–31 years), we used a semi-stratified sampling method, combining both persistent and ephemeral regenerated forest pixels. To investigate the factors driving forest regeneration, we sampled regenerated forest pixels as well as surrounding pixels in agricultural areas or pasturelands that could potentially regenerate but did not. For the analysis of regenerated forest survival, we sampled both regenerated forest pixels that persisted until 2019 and those cleared again before 2019, while the analysis of second-growth forest longevity included both the persistent and ephemeral regeneration pixels. Running separate models for the persistent and ephemeral regeneration yielded similar results so we grouped them in the final analysis (appendix figure 1 available online at stacks.iop.org/ERL/17/045009/mmedia). To ensure inclusion of pixels across the entire AF extent, we separately sampled each state. Finally, pixels were sampled with a minimum distance of 1.5 km threshold to avoid spatial autocorrelation.
Models were fitted using the 'glmmTMB' package in R statistical software (Brooks et al 2017). To facilitate interpretation and convergence, all predictor variables were standardized by z-score transformation (Gelman and Hill 2007). We checked for collinearity between predictor variables using correlation matrixes and highly correlated predictors (Pearson's correlation ⩾ 0.5) were excluded from the models. Post-hoc multicollinearity analysis using variance inflation factor (VIF) was also performed and all results were below a threshold of 3 (Zuur et al 2010). We used the 'drop1' function from the package MuMIN (Barton, 2019) for variable selection and models for each persistence/survival metric were compared using Akaike Information Criterion (AIC). Goodness of fit was calculated using the marginal and conditional R2 in the package MuMIN (Barton, 2019). All analyses were conducted using R Statistical software (R Development Core Team, 2008).
3. Results
3.1. Patterns of native cover regeneration
We mapped over 4.47 million hectares of native forest regeneration in the AF. Over two thirds (3.1 Mha) of the regeneration persisted until 2019 (table 3; figures 3 and 4). This persistent forest regeneration was distributed in 1035 639 fragments with mean size of 3.05 ha and mean age of 15.6 years (table 3; appendix figures 2 and 3). The remaining 1.37 Mha of regenerated native forests were cleared before 2019 (table 3; figures 3 and 4). This ephemeral forest regeneration was distributed in 611 580 fragments with mean size of 2.25 ha and mean age of 7.9 years (table 3; appendix figures 2 and 3). Although the area of persistent regeneration decreased steadily over the study period, the loss of older ephemeral regeneration was more pronounced, as the vast majority of ephemeral regeneration only persisted between four and eight years. Overall, approximately 50% of all regenerated forests had an age of twelve years or less (figure 3).

Figure 3. Age profile of the persistent and ephemeral regeneration (top figures; red vertical lines indicate the mean age for each regeneration type) and persistence of all the regeneration in the Brazilian Atlantic forest (bottom figure) showing that 50% of all forest regeneration had an age of twelve years or less (red horizontal line).
Download figure:
Standard image High-resolution image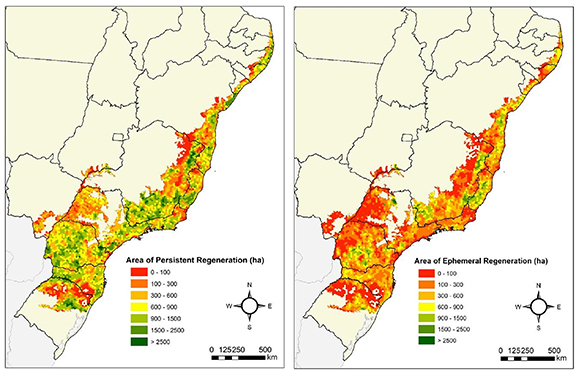
Figure 4. Area of the persistent (left) and ephemeral (right) native forest regeneration across the Brazilian Atlantic forest. Hexagons in the map represent 250 km2 landscapes.
Download figure:
Standard image High-resolution imageTable 3. Quantitative results for both the persistent and ephemeral native forest regeneration in the Brazilian Atlantic forest.
| Forest Regeneration Type | Persistent | Ephemeral |
|---|---|---|
| No of Pixels | 35.1 million | 15.2 million |
| Area (hectares) | 3.1 million | 1.37 million |
| No of Fragments | 1.03 million | 611 thousand |
| Mean Fragment Size | 3.05 ha (SD = 5.99) | 2.25 ha (SD = 3.18) |
| Maximum Fragment Size | 1542 hectares | 511 hectares |
| Mean Fragment Age | 15.6 years (SD = 6.23) | 7.9 years (SD = 3.30) |
Forest regeneration did not occur evenly across the AF. We observed higher rates of native forest regeneration in the southeastern states of São Paulo and Minas Gerais, as well as the southern state of Paraná and the northeastern state of Bahia (figure 4; appendix figure 4). The regeneration that persisted until 2019 occurred broadly across the entire AF region but ephemeral regeneration was highly clustered, occurring especially in the mid portions of the southern Paraná state, as well as in portions of the southeastern states of Minas Gerais and Espírito Santo and in the northeastern state of Bahia (figure 4; appendix figure 4).
The majority of native forest regeneration in the AF (∼70%), both persistent and ephemeral, occurred in areas dominated by pasturelands or mosaics of agro-pastoral land uses (∼71.3%), a land cover class in the MapBiomas products characterized by shifting annual agriculture and cattle ranching, while 26% of the forest regeneration occurred in areas previously occupied by native forest cover and only 1.86% occurred in former croplands (figure 5). Approximately 76% of the native forest regeneration either persisted until 2019 (71%) or was cleared and regenerated again (5%) before then, while almost 20% was converted back to either pasturelands or mosaic of agro-pastoral land uses and 3.5% was converted to permanent agriculture (figure 5).

Figure 5. Sankey chart showing the land use dynamics of forest regeneration in the Brazilian Atlantic forest including land covers that gave origin to regeneration areas, and those to which regenerated areas have been converted back to.
Download figure:
Standard image High-resolution image3.2. Drivers of second-growth forests longevity and survival
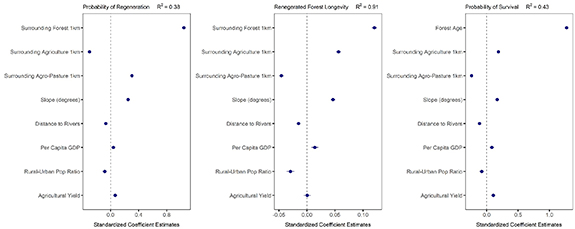
Our models performed well in predicting the longevity of regenerated forest pixels (R2 = 0.91) and models of probability of regeneration and survival explained 38% and 44% of observed variation in (table 2; figure 6). The proportion of neighboring forest around a regenerated forest pixel was the most important predictor of both probability of regeneration and forest longevity, with native forests regenerating and persisting longer in areas surrounded by native forests (figure 6; appendix table 1). Proportion of neighboring forest also had a positive significant effect on the probability of survival of second-growth forest pixels, but it was excluded from the final models due to high correlation with forest age, as forest age was the strongest determinant of persistence of regenerated forest pixels, with greater persistence with age (figure 6; appendix table 1). Forests were less likely to regenerate in areas dominated by permanent agriculture (either annual or perennial crops) but when they did regenerate in these areas, they had lower probability of being cleared and persisted longer (figure 6; appendix table 1). In contrast, forests in areas dominated by pasturelands and shifting agriculture (mosaic of agro-pastoral land uses) were more likely to regenerate but also had a higher probability of clearance and persisted for less time (figure 6; appendix table 1). Forest regeneration was more likely, persisted longer and had higher changes of survival in steeper slopes and closer to rivers (figure 6; appendix table 1).
Figure 6. Standardized parameter estimates (±2 standard errors) for effects of landscape and socioeconomic variables on the probability of regeneration (left), second-growth forests longevity (center) and probability of survival (right). Note difference in x-axis range.
Download figure:
Standard image High-resolution image
Forests were also more likely to regenerate, persist longer and survive in municipalities with high GDP and agricultural yield (figure 6; appendix table 1), although agricultural yield was not a significant predictor of second-growth forests longevity. Finally, forests in municipalities with high rural-urban population ratio were less likely to regenerate, persisted less time and had a higher probability of being cleared again, suggesting that urbanization can lead to forest regeneration and greater persistence of second-growth forests in the region. The remaining landscape and socioeconomic variables were either not significant or had high correlation with other predictors and were excluded from the final models.
4. Discussion
Our analysis of native forest regrowth and persistence in the AF showed that regeneration was substantial in the region over the past 35 years, with over 4.47 Mha of native regenerated forests of which 3.1 Mha persisted until 2019, representing more than 10% of the extant forest cover in the region (28 Mha) (Rezende et al 2018). Second-growth forests in the AF are persisting considerably longer (∼14 years) when compared to other tropical regions (Schwartz et al 2017, Nunes et al 2020, Smith et al 2020), but the average persistence of the ephemeral forest regeneration was only 7.9 years, suggesting rapid forest turnover rates under certain conditions. Finally, the drivers of second-growth forests longevity and survival/persistence in the region are, for most part, the same drivers of native forest regrowth. This is a major novelty of our study and the first step to a more comprehensive understanding of the conditions that allow regenerated forests to persist in tropical landscapes.
Second-growth forests in the AF are persisting longer and at higher rates when compared to other regions in Latin America. For example, 38% of mapped regeneration in the Brazilian Amazon and 50% in Costa Rica survived within 35 years (Reid et al 2018, Nunes et al 2020), while about 70% persisted in the AF within the same period. Furthermore, only 13.46% of the regeneration that persisted until 2019 was younger than five years of age, while very young forests (⩽5 years) accounted for about 44% of the second-growth forests in the Brazilian Amazon (Nunes et al 2020, Smith et al 2020) and almost 60% in a Peruvian Amazon region (Schwartz et al 2017). The average age of second-growth forests in the AF (∼14 years) was also considerably higher than for the Brazilian Amazon (7–8 years) (Nunes et al 2020, Smith et al 2020). Considering the strict conditions that we adopted in our analysis to identify forest regeneration, specifically not including data for the first four years of the study period, our estimates of regenerated forest age are probably conservative and a substantial proportion is likely to be older. This suggests that much of the observed regeneration may already be at later succession stages (>10 years) and thus protected by the AF Law.
Although our results reinforce the classification of the AF as a reforestation hotspot (Nanni et al 2019) and cast a positive scenario for the biome's future, the turnover of regrowing forests in the region still remains a pervasive issue, as indicated by the decline in total area of regeneration with age and increasing clearance rates of young forests in recent years (Rosa et al 2021). Considering the censored nature of our data, we cannot predict how much of the regeneration will persist past 2019, especially given that the ephemeral regeneration was short lived. The probability that very young forests (<8 years) will be cleared again after 2019 is high. The mean size of regenerated forest fragments was also relatively small (∼3 ha), suggesting that the potential of native forest regeneration to increase landscape connectivity in the AF may be limited by continuous re-clearing and isolation of regenerating forests (Rosa et al 2021).
A distinct feature of our study is that we analyzed the drivers of three metrics that encompass the distinct stages of the forest regeneration process, which allowed for a more complete understanding of the factors determining forest dynamics in the AF. Moreover, the fact that the drivers of second-growth forests longevity and persistence are, for most part, the same drivers of native forest regrowth is a crucial finding for future restoration efforts in the region. Native forests were more likely to regenerate in pasturelands or mosaics of agro-pastoral land uses than in areas of intensive agriculture (Bicudo da Silva et al 2017, Rosa et al 2021). However, regenerated forest pixels had shorter longevity and survival probability in these land uses relative to permanent agriculture. Although there is less land available for forest regeneration in intensive agricultural lands, once forests regenerate in marginal areas at the edges of crops or alongside riparian buffers they are more likely to persist. On the other hand, it is likely that land owners will clear regenerated forests in pastures and areas of shifting cultivation before they reach later stages of succession (>10 years) and become protected by the AF Law, preventing future use of the land (Sparovek et al 2015).
The most important predictor of native forest regeneration in the AF at the pixel level was the proportion of surrounding native forest, as reported elsewhere (Crk et al 2009, Molin et al 2017, Schwartz et al 2017, Crouzeilles et al 2020). Regeneration was also predominant at steeper slopes as previously reported at local scales in the AF (Teixeira et al 2009, Molin et al 2017, Calaboni et al 2018) and throughout Latin America (Crk et al 2009, Redo et al 2012a, 2013, Aide et al 2013, 2019, Nanni and Grau 2014, Borda-Niño et al 2020). Proximity to rivers was another important driver of native forest regeneration, which was expected considering that riparian vegetation is protected in Brazil (Teixeira et al 2009, Molin et al 2017, Rosa et al 2021). Lower rural-urban population ratios and higher agricultural yield also fostered forest regeneration, suggesting that agricultural intensification and urbanization can result in forest regrowth in abandoned marginal and less productive lands not suitable for mechanized agriculture, as locally observed in the AF (Molin et al 2017, Calaboni et al 2018) and elsewhere in Latin America (Yackulic et al 2011, Redo et al 2012a, 2012b, Aide et al 2019). Finally, our results also suggest that economic development can lead to reforestation, as per-capita GDP was a positive predictor of forest regrowth (Redo et al 2012b). Considering that regenerated forest pixels persisted longer and had higher chances of surviving on steeper slopes, closer to rivers, when surrounded by more forests, in more urbanized areas with higher per-capita GDP and agricultural yield, it shows that conditions that allow for forests to regenerate can also foster persistence (e.g. agricultural intensification and land abandonment due to urbanization) (Barretto et al 2013, Rudel et al 2016, Calaboni et al 2018).
Nevertheless, the drivers of secondary forest persistence can be context specific. As observed in Costa Rica (Reid et al 2018), secondary forests in the AF had higher chances of persisting when surrounded by more forests and in proximity to rivers, highlighting the importance of policies designed to protect native forests, as riparian buffers are protected in both countries (Reid et al 2018, Rosa et al 2021). In contrast, secondary forest pixels in the Pucallpa region in Peru were less likely to persist when occurring within larger patches or surrounded by higher proportions forest cover (Schwartz et al 2017). Regenerated forests in Pucallpa also had higher chances of persisting when far from roads and rivers (Schwartz et al 2017). Differences in development history, agricultural practices and land tenure systems could explain these distinct scenarios. In both the AF and Costa Rica, a stable land tenure system coupled with intensive agriculture and strong environmental laws allowed for longer persistence of secondary forests in areas with higher forest cover and alongside riparian buffers (Reid et al 2018, Rosa et al 2021). On the other hand, regenerated forest loss in agricultural frontiers such as Pucallpa usually occurs along rivers and roads and expansion of urban areas and commodities such as oil palm often leads to deforestation (Gutiérrez-Vélez et al 2011, Schwartz et al 2017). Although distinct regional dynamics play a role in determining the fate of regenerated forests, our results could be applicable to other highly developed tropical regions.
Identifying the different conditions that allow forest regeneration to occur and persist across broad geographical areas is critical to support future conservation efforts in tropical regions. The fact that secondary forests are persisting longer and at higher rates in the AF than in other tropical regions highlight the importance of strong mechanisms for forest protection such as the AF Law. However, young regenerated forests are still under pressure in the AF (Rosa et al 2021) and current policies may not suffice to protect young forests. This is demonstrated by the short average persistence of ephemeral regeneration, which reflects fallow dynamics in the region, where landowners can set aside portions of their land for recovery but are encouraged to clear the regeneration once again before a ten year period to avoid that these new forests become protected by law. Consequently, the maintenance of native forest regeneration appears as a new and important policy challenge.
By indicating the conditions in which natural regeneration is likely occur and persist, our study provides pivotal information to improve conservation policies and guide the planning and implementation of cost-effective restoration efforts in Brazil. Stimulating regeneration in areas of low opportunity cost (e.g. abandoned pasturelands) may be more attractive to land owners and a suitable pathway for rapid forest cover expansion, but new incentives or actions (e.g. payments for ecosystem services) should be considered to strengthen regeneration in areas of consolidated agriculture (Ruggiero et al 2019), where forest permanence tends to be higher. The AF still has a vast supply of suitable land for forest regeneration (Brancalion et al 2019, Crouzeilles et al 2020) and policies should aim to both foster native forest regeneration and ensure its persistence. This approach is essential for Brazil to reach its ambitious restoration commitments (Crouzeilles et al 2019).
Acknowledgents
We thank the MapBiomas project for making the data available and Drs. M Fagan, L Reid, and N Schwartz for invaluable insights in the conceptualization of our research questions.
Data availability statement
The data that support the findings of this study are openly available at the following URL/DOI: https://mapbiomas.org/.
Author contributions
P R P and M U conceptualized the paper. P R P, M R R, L R T and M U developed analyses methods. P R P conducted the formal analysis. P R P and M U wrote the first draft and all authors contributed to the final draft.
Conflict of interest
The authors declare that they have no competing interests.
Funding
P R P was supported by a Dean's and Kluge Graduate Mentor Fellowships from Columbia University.