

Abstract
Current estimates of the global land carbon sink contain substantial uncertainties on interannual timescales which contribute to a non-closure in the global carbon budget (GCB) in any given year. This budget imbalance (BIM) partly arises due to the use of imperfect models which are missing or misrepresenting processes. One such omission is the separate treatment of downward direct and diffuse solar radiation on photosynthesis. Here we evaluate and use an improved high-resolution (6-hourly), gridded dataset of surface solar diffuse and direct fluxes, over 1901–2017, constrained by satellite and ground-level observations, to drive two global land models. Results show that tropospheric aerosol–light interactions have the potential for substantial land carbon impacts (up to 0.4 PgCyr-1 enhanced sink) at decadal timescales, however large uncertainties remain, with models disagreeing on the direction of change in carbon uptake. On interannual timescales, results also show an enhancement of the land carbon sink (up to 0.9 PgCyr-1) and subsequent reduction in BIM by 55% in years following volcanic eruptions. We therefore suggest GCB assessments include this dataset in order to improve land carbon sink estimates.
Export citation and abstract BibTeX RIS

Original content from this work may be used under the terms of the Creative Commons Attribution 4.0 license. Any further distribution of this work must maintain attribution to the author(s) and the title of the work, journal citation and DOI.
1. Main
Atmospheric aerosol concentrations are changing over interannual and decadal timescales due to fossil fuel and biomass burning emissions, and volcanic eruptions [1–4]. Variability in these aerosols impacts the quantity and quality (fraction of light that is diffuse) of incoming solar radiation reaching the surface [5–10]. Increases in aerosols and subsequently diffuse light can enhance the light-use efficiency of plants and thus terrestrial productivity [11, 12]. By increasing diffuse light, aerosols enable higher canopy photosynthesis by providing light to otherwise shaded leaves, despite reducing the total amount of light that reaches the surface. This aerosol perturbation should be most efficient under clear-sky conditions, because when clouds are present, they already produce a lot of diffuse light on top of which changes in aerosols will have only a marginal effect.
However, there is a threshold in the ratio of diffuse to total radiation (diffuse fraction) above which the reduction in total radiation dominates to reduce whole plant productivity [13, 14] i.e. there's an optimum diffuse fraction whereby additional aerosol loading leads to a reduction in total radiation which outweighs the positive effect of diffuse radiation on photosynthesis. This optimum is location dependent, governed by biotic and abiotic factors (e.g. climate, vegetation type and coverage, cloud cover, aerosol type). Therefore, the precise influence of aerosols on the partitioning of solar radiation is key in determining their impact on terrestrial productivity [12, 15]. We therefore need models to ascertain the net effect of aerosols at the large scale, and their role temporally on the land carbon sink. Previously, one model showed how aerosols had an impact on both the post-Pinatubo period and the long-term carbon sink [16]. However, this study only covered the period up to 2000, and the results still need to be confirmed by a multi-model study with a common forcing.
Further, models currently underestimate the magnitude of the land carbon sink in the years following the Pinatubo eruption, in part due to the exclusion of aerosol-light effects on direct and diffuse radiation in the global carbon budget (GCB) analysis [17]. The GCB reports that every year the sum of estimated global emissions is not equal to the sum of estimated changes in the atmosphere, land and oceans [17]. This is because estimated sources and sinks of carbon do not equal, leading to a carbon budget imbalance (BIM = sources-sinks; see section 2), which provides a measure of the community's level of understanding of the carbon cycle [17, 18]. Until now, the community has not had a global solar radiation forcing dataset including these aerosol-light effects, to be able to reduce BIM.
In this study we first evaluate an improved global forcing dataset of total and diffuse radiation, i.e. improved aerosol scattering, higher temporal resolution, and extended study period to 2017 (see section 2 and supplementary section 1). We then investigate the impact of changes in atmospheric aerosols on the spatio-temporal land carbon sink and assess uncertainties and the implication for BIM using two global land surface models; JULES-ES [19] and ORCHIDEE_DF [20], employed over the extended period 1900–2017. We restrict our BIM analysis on the period 1959–2017, as widespread observations of atmospheric CO2 concentrations do no not exist prior to 1959. JULES-ES and ORCHIDEE_DF are both enabled to represent the effect of changing light quality on terrestrial carbon fluxes, and we evaluate model performance using forest site observations of photosynthesis and solar radiation (see supplementary section 2 for details).
To investigate the role of changes in atmospheric aerosol on land carbon uptake and the BIM we perform four primary model simulations over the period 1901–2017. Atmospheric CO2 and all climate variables (except for incoming short-wave radiation) vary throughout all simulations (section 2). In the historical simulation, total and diffuse shortwave radiation depend on the solar zenith angle, temporally varying cloud cover and aerosol optical depth of the whole atmospheric column. The individual and combined impacts of changes in tropospheric and stratospheric aerosols, i.e. volcanoes, are calculated by subtracting simulations with time-invariant tropospheric (FixedTropAero), stratospheric (FixedStratAero) and both (FixedAero), from the historical simulation (supplementary figure 6 and supplementary tables 2 and 3 (available online at stacks.iop.org/ERL/16/124072/mmedia)).
1.1. Surface solar flux evaluation
We evaluate the long-term mean and trends in simulated all-sky surface fluxes against regionally aggregated site-level observations (FLUXNET201521 and GEBA22, see supplementary section 1). We focus on Europe, USA, and China as these are three regions with high site coverage, long-term observational records (multiple decades), and all experienced substantial changes in atmospheric aerosol concentrations since the middle of the 20th century. Our model reproduces observed total solar and diffuse solar fluxes at the surface, but has a bias (of up to 40% in the USA), which is increased in some regions when introducing time-varying aerosols (figure 1). The bias in diffuse radiation in the historical simulation prompted the need for a bias correction, as described in supplementary section 1, and shown in figure 1 (Historical—Scaled). Following this evaluation, we scale the diffuse radiation time series from all simulations (FixedAero, FixedTropAero, FixedStratAero, and Historical) before use with the DGVMs. In general, including aerosols improves trends over the period 1960–present in both total and diffuse shortwave fluxes over China. This region has experienced a strong increase in aerosol loads over the 1960–present day period. The impact of aerosols on trends is less clear over Europe and North America, suggesting that aerosols play a secondary role to cloudiness in driving temporal changes in surface radiation in those regions. In addition, we also perform a global evaluation, and show the scaling of surface diffuse radiation improves agreement with observations in all regions (figure S3).
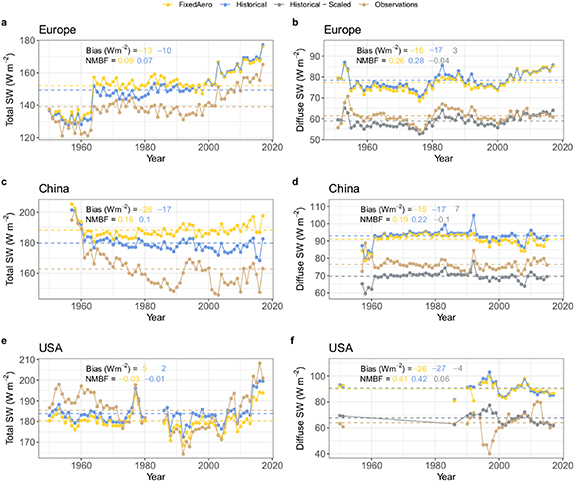
Figure 1. Comparison of observed and simulated shortwave total radiation and diffuse fraction at surface sites in three regions. Annual mean site (GEBA and FLUXNET) observations (brown), and two simulations and FixedAero (yellow) and Historical (blue) are shown (see table S2 for simulation descriptions). We apply a global scale factor of 0.75 to both clear-sky and cloudy-sky surface diffuse radiation fields (see section S1) to align with surface observations, named here as Historical—Scaled (grey). The Historical—Scaled data are used to drive the DGVMs. Thin dashed lines show averages over the observational period. Regional mean values are calculated from annual mean site values with the number of sites varying between years. Sites included in each region are listed in table S1.
Download figure:
Standard image High-resolution image1.2. DGVM evaluation
The degree to which we can accurately quantify aerosol impacts on carbon uptake and BIM depends on the ability of JULES and ORCHIDEE to capture observed patterns of canopy photosynthesis in a variety of light conditions. We therefore evaluate the performance of simulated canopy GPP using half-hourly or hourly values of eddy flux data and meteorology from four forest sites; tropical broad leaved tree Tapajos, Brazil (BRA) (54.96°W, 2.86°S) and Guyaflux, French Guiana (52.92°W, 5.28°N), boreal broad leaved tree Saskatchewan, Canada (106.20°W, 53.63°N), and boreal needle leaved tree Hyytiala, Finland (24.29°E, 61.85°N) from the FLUXNET201521 dataset. For this evaluation we kept model photosynthetic parameters (e.g. Vcmax) at the global values which could lead to biases in our site level evaluation. However, both JULES and ORCHIDEE_DF capture the observed GPP fluxes in both clear and diffuse conditions (figure 2), with no significant biases in a range of light conditions (high/low and/or clear/diffuse). Further, both models simulate the mean and inter-annual variability in observed GPP at these forest sites (figure S5). Overall, both JULES and ORCHIDEE have been evaluated previously and again here (now with common forcing and observational data), and are found to have high agreement with observations of canopy photosynthesis in a variety of light-regimes [16, 20–22].
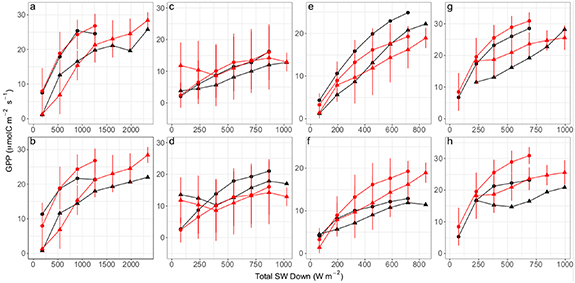
Figure 2. JULES-ES and ORCHIDEE_DF model evaluation. Observed in red (error bars, 1 s.d.) and modelled in black, light response of GPP to both direct (triangles) and diffuse (circles) surface solar radiation at four forest sites: (a), (b) Tapajos, Brazil (2004-06-01–2006-01-15), (c), (d) Saskatchewan, Canada (2003-05-14–2010-12-30), (e), (f) Hyytiala, Finland (2010-01-01–2014-11-03), (g), (h) Guyaflux, French Guiana (2007-09-26–2009-12-29) for (a), (c), (e), (g) JULES-ES and b,d,f,h, ORCHIDEE-DF. Site-level evaluation was performed using hourly data, with data split into 'diffuse' and 'direct', using diffuse fractions >0.75 and <0.3 to discriminate between these two cases. Site data is from the FLUXNET2015 dataset [30].
Download figure:
Standard image High-resolution image1.3. How do varying aerosol-light effects impact terrestrial carbon uptake?
The land models indicate that variability in atmospheric aerosols have a substantial impact on the interannual variability of the land carbon sink (figure 3), with significant enhancements in the land carbon sink (up to 0.9 ± 0.2 PgCyr-1) occurring during years of large volcanic eruptions (1963/4, 1982/3, 1991/2). Volcanic aerosol substantially increases the diffuse fraction of surface solar radiation (with only small reductions in total surface radiation; supplementary figure 7), due to the high scattering efficiency of stratospheric sulphate aerosol (supplementary figure 8), which drives the large carbon response in both models.

Figure 3. Global impacts of aerosols on land carbon uptake. Change in the land carbon sink over 1959–2017 as simulated by (a) JULES-ES and (b) ORCHIDEE_DF due to increases in stratospheric (orange) and tropospheric (blue) aerosol concentrations, with the combination (black) of the two also shown. These effects are calculated by forming the difference between simulations with fixed and varying aerosol concentrations (see supplementary tables 2 and 3).
Download figure:
Standard image High-resolution imageVarying tropospheric aerosol has a more modest (although relatively uncertain) impact on the land carbon sink (0.1 ± 0.3 PgCyr-1, on average over 1959–2017; figure 3). Large uncertainty arises predominantly due to opposing tropical (<30°) carbon uptake responses to increased fossil fuel and biomass burning aerosol (supplementary figure 9). In contrast to volcanic sulphate aerosol, additional fossil fuel and biomass burning aerosols substantially reduce total surface radiation as well as increasing the diffuse fraction. The models show a similar response to the enhanced diffuse fraction (0.13 ± 0.04 PgCyr-1, on average over 1959–2017; supplementary figure 10). Thus, the disparity between the modelled responses to increased tropospheric aerosol can be explained by differing responses of tropical forest productivity to reductions in total surface radiation. In JULES-ES, the reduced radiation outweighs any benefit from increased diffuse fraction (supplementary figure 10), implying that tropical photosynthesis in JULES-ES is light-limited, perhaps due to the high cloud cover at these latitudes [23]. ORCHIDEE_DF shows a widespread increase in productivity due to dimming induced soil moisture increases, except in the wettest rainforests of South America and Southeast Asia (SEAS) (supplementary figures 9–11). Overall, for ORCHIDEE_DF, the dimming induced increase in global carbon uptake is double that of the associated increase in diffuse fraction (supplementary figure 10).
1.4. What effect does varying aerosol concentrations have on BIM?
In simulations that do not account for variations in aerosols, in the years following large volcanic eruptions (1963/4, 1982/3, 1991/2), the land models generally underestimate the land carbon sink (positive BIM; figure 4(a)). This highlights potential systematic biases (e.g. underestimation of diffuse fraction) in model simulations excluding aerosol effects on surface solar radiation. Incorporating volcanic aerosol-light effects in the land models reduces BIM (by enhancing the land carbon sink) in these years, on average by 0.5 PgCyr-1 (figure 4). Assuming this carbon response is broadly representative of the land models used in the GCB [17, 24], we can expect to reduce BIM in volcanic years by approximately 55% (GCB 2020 BIM = 0.95 PgCyr-1 in volcanic years; figure 4). This result therefore indicates that the incorporation of diffuse radiation effects could substantially improve the GCB. Overall, BIM still persists, indicating non-radiative drivers (e.g. water or temperature) of carbon uptake and decomposition are potential other remaining sources of the BIM if originating from land [18].

Figure 4. Role of volcanic aerosol in reducing the carbon budget imbalance. (a) Global carbon budget imbalance (BIM) from GCB2020 [17] (solid black line) and our corrected BIM (dashed black line). The corrected BIM is calculated by subtracting the volcanic induced carbon response (mean of JULES-ES and ORCHIDEE_DF response; see figure 2) from GCB2020 BIM. (b) Mean BIM over the six years; 1963/4, 1982/3, 1991/2. The arrows represent the improvement in the land sink estimate with the inclusion of varying aerosol-light effects for each model.
Download figure:
Standard image High-resolution image1.5. Where is the volcanic induced BIM reduction located and what drives regional variability?
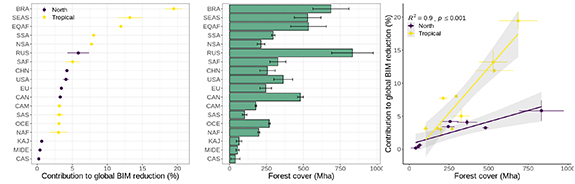
An ensuing regional scale analysis highlights the dominant role tropical regions have in the reduction in BIM in the year following volcanic eruptions, with BRA, SEAS, and Equatorial Africa contributing 45 ± 2% of the global carbon response (figure 5(a)). The regional distribution of aerosol-induced additional carbon uptake can be explained (R2 = 0.90, p< 0.001) by variability in the total forest cover (figures 5(b) and (c)). Forests generally have high photosynthesis along with closed canopies and high leaf area index (>2–3 m2 m−2), all of which largely determine the diffuse radiation fertilization effect [25, 26] due to the higher LUE of shaded leaves compared to sunlit ones [27]. The sensitivity of regional carbon response to forest cover is mediated by latitude, with the tropics having a larger response than northern lands with similar forest cover (figure 5(c)). Over the duration of the eruptions (year of eruption and year following), northern lands have a smaller diffuse radiation perturbation (ΔSW Diffuse = 2.1 Wm−2) compared to the lower latitudes (ΔSW Diffuse = 3.6 Wm−2), where the eruptions were located. Further, a shorter growing season in northern latitudes, compared to the tropics, limits the timeframe extratropical forests can respond to the relatively short-lived (∼2 years) diffuse radiation perturbation.
Figure 5. Regional contribution to the global carbon response to volcanic aerosol. (a) Percentage contribution to the global reduction in BIM following volcanic eruptions (1963/4, 1982/3, 1991/2). (b) Total forest cover (Mha) in each region as simulated by the land models, with error bars representing ±1 s.d among models. (c) Regional carbon response regressed against forest cover, with regions grouped by latitude (North or Tropical). Shading represents the standard error and error bars representing ±1 s.d among models. Regions are defined in figure S3.
Download figure:
Standard image High-resolution image
The significant role of atmospheric aerosols on land carbon uptake shown here is in line with previous studies [11–13, 15, 16, 21, 22]. Tropospheric aerosol-light interactions have the potential for substantial land carbon impacts at decadal timescales, however large uncertainties remain, with models disagreeing on the direction of change in carbon uptake due to differential responses to the reduction in total SW radiation. These opposing responses to dimming highlight the complex interactions between the surface energy budget, and water and carbon cycles and the challenge in modelling the responses to environmental change accurately. These results also provide motivation for additional multi-model studies to further address and disentangle the impact long-term dimming has had on the land carbon sink.
The tropospheric aerosol response contrasts with the substantial (and robust result across both models) influence of volcanic eruptions on surface diffuse radiation and carbon uptake [11]. Our global net carbon uptake response following the Mt. Pinatubo eruption is similar to that of Mercado et al [16] (1.2 PgC yr−1 compared to 0.9 PgC yr−1 (multi-model mean) in this study). However, the regional attribution differs, as our results indicate a dominant role of tropical forests as opposed to northern lands suggested previously [16].
This is the first study to quantify the impact of changes in atmospheric aerosols on the carbon BIM. Our results lead to a significant reduction in BIM (55%) in years following large volcanic eruptions. This indicates that accounting for aerosol-light effects in land models is necessary to be included in GCB assessments, but is not sufficient to fully close the GCB. This study has been accomplished by utilizing satellite [28, 29] and in-situ [30–32] observations to accurately simulate the spatial and temporal distribution of atmospheric aerosol and solar radiation reaching the surface [33], along with land modelling. Our study reveals the significant impact aerosols can have on the carbon uptake of forests, especially in the tropics. Therefore, we recommend that the separation between direct and diffuse surface radiation and distinct influences on canopy carbon uptake needs to be included in land models to improve land carbon sink estimates and GCB assessments.
2. Methods
2.1. Carbon budget terms
The GCB [17] defines the major components of the (human perturbed) carbon cycle as emissions from (a) fossil fuel combustion (EFF); (b) land-use change (ELUC); and their partitioning among (c) atmospheric growth in CO2 (GATM); (d) ocean carbon uptake (SOCEAN); and (e) terrestrial carbon uptake (SLAND). Due to errors in these estimates, the sum of sources (EFF + ELUC) does not equal the sum of sinks (GATM + SOCEAN + SLAND). This leads to a 'budget imbalance' (BIM) term: EFF + ELUC = GATM + SOCEAN + SLAND + BIM. In GCB, SLAND is estimated with a suite (n = 16) of land models which are forced with observed atmospheric CO2 concentrations and gridded climate reanalysis. Here we attempt to reduce BIM by improving the estimate for SLAND.
2.2. Modelling setup
To estimate the impact of changes in aerosols on surface solar radiation and land carbon fluxes, we use a three-step modelling process. First, the distribution of atmospheric aerosols was simulated using a climate model (HadGEM2-ES) [33] over the period 1901–2017. The impact of aerosols and clouds on surface solar radiation was simulated using a radiative transfer model (Streamer). Total surface solar radiation along with the diffuse fraction of radiation was then used to drive two land-surface models (JULES and ORCHIDEE). To separate the contributions of tropospheric and stratospheric aerosols, we perform four main Streamer simulations, where aerosol fields are either fixed or varied (see supplementary figure 6 and supplementary table 2). The surface solar fluxes from these four simulations are then used as input to the land-surface models. After each modelling step, model output is bias corrected (see below), which ensures the aerosol fields and surface solar fluxes are realistic prior to use in the next step in the modelling process. A similar methodology has been used previously [16, 21, 22].
2.3. Surface solar fluxes
We use 6-hourly distributions of the downward direct and diffuse surface shortwave fluxes over the period 1900–2017. Radiative transfer calculations are based on monthly-averaged distributions of tropospheric and stratospheric aerosol optical depth, and 6-hourly distributions of cloud fraction. The time series of speciated tropospheric aerosol optical depth is taken from the historical and RCP8.5 simulations of the HadGEM2-ES climate model [33]. To correct for biases in HadGEM2-ES, tropospheric aerosol optical depths are scaled over the whole period to match the global and monthly averages obtained by the CAMS Reanalysis of atmospheric composition (2003–2017) [26], which assimilates satellite retrievals of aerosol optical depth. The time series of stratospheric aerosol optical depth is taken from the climatology by Sato, Hansen, McCormick, & Pollack, (1993) [34], which has been updated to 2012. Years 2013–2017 are assumed to be background years so replicate the background year 2010. That assumption is supported by the Global Space-based Stratospheric Aerosol Climatology time series (1979–2016) [29]. The time series of cloud fraction is obtained by scaling the 6-hourly distributions simulated in the Japanese Reanalysis (JRA) [35] to match the monthly-averaged cloud cover in the CRU TS v4.03 dataset [36]. Surface radiative fluxes account for aerosol-radiation interactions from both tropospheric and stratospheric aerosols, and for aerosol–cloud interactions from tropospheric aerosols, except mineral dust. The radiative effects of aerosol–cloud interactions are assumed to scale with the radiative effects of aerosol-radiation interactions, using regional scaling factors derived from HadGEM2-ES. This first order approximation works very well on longer temporal scales and larger spatial scales, as noted by Bellouin et al [37]. Rapid adjustments of cloud cover to aerosol radiative forcing are implicitly included in the observed cloud fraction used in this study, but physical understanding is not yet sufficient to isolate them confidently [37]. Atmospheric constituents other than aerosols and clouds are set to a constant standard mid-latitude summer atmosphere, but their variations do not affect the diffuse fraction of surface shortwave fluxes. Prior to use in the land-surface models, we scale the surface solar fluxes to match in-situ observations (BSRN, FLUXNET2015, and GEBA, see supplementary section S1).
2.4. Land model setup
This study uses JULES-ES (with an improved vegetation canopy scheme) [19], and ORCHIDEE_DF [20], with both models capturing observed canopy photosynthesis at various (broadleaf and needleleaf) forest sites, under a range of light conditions (supplementary section 2 and [20]).
Land model simulations are based on the methodology from GCB [17]. The models are forced with atmospheric CO2 concentrations from NOAA [38] and gridded CRUJRA (merged sub-daily JRA-55 reanalysis [35] with monthly CRU observations [36]) climate reanalysis, but with updated surface shortwave fluxes. JULES-ES updates natural vegetation cover using the TRIFFID dynamic vegetation model [19, 39, 40], and updates the land-use fraction annually based on HYDE cropland and pasture extent [41]. ORCHIDEE_DF updates the global vegetation map each year using the ESA-LUH2v2/HYDE plant functional type data [42].
We spin the models to equilibrium (carbon pools and fluxes) using conditions from 1900 for CO2 concentrations, nitrogen deposition, and land-use fraction, and cycle 1900–1920 climate conditions. The experiment simulations then run from 1900 to 2017 with all drivers varying but with various surface solar flux scenarios (see supplementary table 2).
2.5. Statistical analysis
When evaluating the modelled surface solar radiation, we use the Normalised Mean Bias Factor (NMBF) as a measure of performance. The NMBF is defined as:
We choose to use NMBF as it is a symmetrical metric between over and under estimation [43]. NMBF > 0 (<0) indicates the model overestimates (underestimates) by (NMBF*100)%.
Data availability statement
The data that support the findings of this study are openly available at the following URL/DOI: 10.5281/zenodo.5658676.
Acknowledgments
M O S, P F and S S have received funding from the European Union's Horizon 2020 research and innovation program under Grant Agreement No. 821003 (project 4C), and the Newton Fund through the Met Office Science for Service Partnership Brazil (CSSP Brazil). Surface solar radiation fields were produced by N B and can be found at https://figshare.com/authors/Nicolas_Bellouin/10653083
Author contributions
M O S, L M, S S, Y Z, and P C designed the study. M O S, Y Z performed land model simulations. M O S, I H prepared cloud fields. N B prepared aerosol fields and performed the radiative transfer calculations. M O S analysed the data and produced the figures. M O S wrote the manuscript with contributions from all authors.
Conflict of interest
The authors declare no competing interests.