

Abstract
Labour exposure to heat stress driven by climate change will increase significantly with the rising global temperatures. Under heat stress, workers have to reduce work intensity and take longer breaks from work to prevent occupational illness and injuries. This study explores how the global warming and the resulting increase in heat stress can directly affect productivity of workers and indirectly impact upon the broader economy. Occupational statistics for 269 European regions are combined with daily heat stress indicator derived from a set of high-resolution climate scenarios. The novel approach, enabled by using a set of published exposure-response functions, assesses workers productivity losses differentiated by occupations. A macro econometric model of the European economy is then used to asses implications of change in productivity in monetary terms. The study finds that, compared to nowadays, productivity of labour can be 1.6% lower in Europe in 2080s, with a clear geographical gradient showing that southern and eastern regions are much more affected (e.g. up to 5.4% productivity loss in Greece). Furthermore, regions where the dominant occupations have relative lower earnings would also experience higher productivity loses. The analysis also focuses on the potential role of adaptation to reduce the productivity and economic losses, via air conditioning and a preliminary assessment of the potential of wearable robotics, which can reduce damages by 30%–40%.
Export citation and abstract BibTeX RIS

Original content from this work may be used under the terms of the Creative Commons Attribution 4.0 license. Any further distribution of this work must maintain attribution to the author(s) and the title of the work, journal citation and DOI.
1. Introduction
1.1. Background
Labour exposure to heat stress is to increase drastically with climate change (ILO 2019). The number of people exposed globally to heat-humidity extremes can increase from 275 million now to 1.22 billion annually in 3 °C warming scenario (Li et al 2020). The increase in labour exposure to heat stress could have direct consequences for workers' health and performance, and indirect economic implications. If operating under heat stress, workers have to reduce work intensity and take longer breaks from work to prevent an increase in internal body temperature which, if too high, can lead to mental fatigue, impaired decision-making, physical exhaustion, heat stroke and collapse (Sawka et al 2003, Blażejczyk et al 2014, Parsons 2014, Lee et al 2019). The resulting economic implications of losses in productivity of workers can be substantial. Some estimates have concluded that global gross domestic product (GDP) could be lower by 2.6%–4% in 2100 (Takakura et al 2017), amount comparable to the mitigation costs of reaching the 2 °C target of the Paris Agreement. Orlov et al (2020) estimate relevant global losses of 1.8% GDP by 2100 relative to no climate change scenario. There are very few dedicated assessments of heat stress impacts on labour productivity for Europe. Orlov et al (2019) evaluated effects of heatwaves in August 2003, July 2010 and July 2015 on workers productivity in agriculture and construction in Europe, and estimated the direct losses in the two sectors between $41 and $90 per worker, and the indirect social cost between $1.6 and $2.7 per capita, with Cyprus, Italy and Spain disproportionally more affected then the rest of Europe. Casanueva et al (2020) analysed heat stress in summer months, and conclude that workers productivity loses from heat stress can reach more than 50% in some locations in Spain, Italy, Greece and Cyprus at the end of the century under high warming scenario.
1.2. Impact functions
The literature has addressed the direct relationship between heat stress and workers' productivity with the use of exposure-response function, hereafter 'impact function'. The published impact functions distinguish between cognitive tasks and physical work, with the latter being further classified into light, moderate and heavy physical effort. There are two general approaches underpinning the impact functions: standards and empirics.
The standards approach is based on protective guidelines regarding the frequency and duration of rest breaks for occupational work under different levels of heat stress, developed to reduce heat stress risks to human health. The main standards in use comprise International Organization for Standardization (ISO 2017) and National Institute for Occupational Safety and Health (NIOSH 2016). Using the ISO and NIOSH guidelines, Kjellstrom et al (2009a) developed a set of impact functions for different work intensities. The NIOSH standards were also used by Dunne et al (2013) to develop impact functions for heavy, moderate and light physical work, and by Takakura et al (2017) to obtain the function for labour performance corresponding to the heat stress and work intensity. The impact functions based on standards have a prescriptive character, and do not necessarily describe the actual workers' behaviour.
The 2nd branch of the literature is based on empirical evidence, even if very limited in scope: Sahu et al (2013) derived an empirical impact function based upon evidence from observing agricultural rice harvesters in India. Wyndham (1969) developed an impact function from observational data on gold mine workers in South Africa. Nag and Nag (1992) reported results from a controlled experiment in an environmental chamber. Results from those three studies were integrated (Bröde et al 2018, Kjellstrom et al 2018) to produce a set of empirical continuous impact functions for light, moderate and heavy physical work. Separate to the impact functions concerning physical work, Pilcher et al (2002) performed a meta-analysis of 23 primary studies to derive an impact function concerning attentional, perceptual, reasoning and memory tasks, and Niemelä et al (2002) investigated the effect of air temperature on workers' productivity in telecommunication offices.
1.3. Economic implications and adaptation
Several studies investigated indirect economic implications of the reduced productivity of workers, usually assuming that impact functions are specific to economic sectors, rather than to occupations. For example, Kjellstrom et al (2009b) applied their impact functions to estimate workers productivity losses in services (assuming light physical work), industry (moderate intensity) and agriculture (heavy work). Kjellstrom et al (2018) and Orlov et al (2019), (2020) assumed all labour in agriculture and construction to be high physical intensity jobs, of moderate intensity in manufacturing, and of low intensity in services. This assumption, that the entire labour in an economic sector is subjected to the same impact function, does not allow to account for different sensitivity of occupations to heat stress within the economic sectors.
It is important to note that few studies have attempted to model adaptation to heat stress. Gosling et al (2018) assume a labour-wide adjustment in work shifts from the day-time to night-time, while Takakura et al (2018) model endogenous shift in working time required in order to maintain the base-period level of labour capacity. Orlov et al (2020) considered diffusion of air-conditioning for low physical intensity workers, and used diffusion of tractors in agriculture as an indicator of mechanisation in agricultural and construction sectors.
In this article we report a comprehensive, occupation-based analysis of future heat stress impacts on workers' productivity, and the consequent indirect economic implications for Europe. The results are reported for 2020s, 2050s and 2080s, with attention to the distributional aspects across regions and occupations.
The reminder of the article is organised in three sections. The next section summarises the main methodological elements of the study. Section 3 presents and analyses the results, and section 4 concludes. Complementary information and results are provided in the supplementary material (SM) (available online at stacks.iop.org/ERL/16/105002/mmedia).
2. Methods
Following IPCC AR5 risk framework (IPCC 2014), we structure the analysis around three components that determine the productivity loss: hazard (heat stress), exposure (location, quantity and occupational composition of labour) and vulnerability (susceptibility of different occupations to the heat stress represented by the impact function). The components are further discussed below.
Heat stress is represented by the wet bulb globe temperature (WBGT)—a temperature equivalent that characterises humans' thermal stress by combining the relevant environmental variables: temperature, humidity, wind speed and solar exposure. We compute two separate WBGT indexes for workers: those working outdoors in the sun, and those working outdoors in the shade and indoors. Only workers in the agriculture and construction sectors are assumed to work outdoors in the sun. To account for climate modelling uncertainty, we derive daily WBGT index from a climatic data ensemble (Dosio and Fischer 2018) of 11 high-resolution (0.11°), bias-adjusted regional climate models (RCMs) from EURO-CORDEX 1 for the 8.5 W m−2 representative concentration pathway (RCP 8.5, van Vuuren et al 2011) (see SM 1). The climate ensemble is consistent with that used in, for example, Dottori et al (2018), Neumann et al (2021) and the JRC PESETA project (Feyen et al 2020). The WBGT computation (SM 2) follows the established method by Lemke and Kjellstrom (2012).
Vulnerability and the impact functions determine workers' productivity losses from heat stress, and depend on type of work and its physical intensity. We group published impact functions into four categories representing varying occupational vulnerability to heat stress (figure 1). The 1st category relates to workers undertaking range of cognitive, perceptual, reasoning and memory tasks, and is represented by the impact functions derived by Pilcher et al (2002). The remaining three categories encompass different intensities of physical work (light, moderate and heavy), and are represented by the functions from Dunne et al (2013) (derived from prescriptive guidelines) and Kjellstrom et al (2018) (derived from empirical epidemiological experiments). An additional empirical impact function for heavy physical work is provided by Sahu et al (2013). The physical work intensity categories are distinguished using literature-based thresholds, which are specified as less than 200 kcal h−1 or 230 W for light labour, in range of 200–350 kcal h−1 or 230–407 W for moderate labour, and in range of 350–500 kcal h−1 or 407–580 W for heavy labour (Dunne et al 2013). Bröde et al (2018) specifies the respective thresholds at 200 W, 300 W and 400 W. Overall, the sensitivity of the impact models increases with the intensity of work. The standards-based models are more sensitive to increase in WBGT than the empirical models at the lower range of WBGT, but the empirical models show greater productivity losses at a higher range of WBGT temperature.
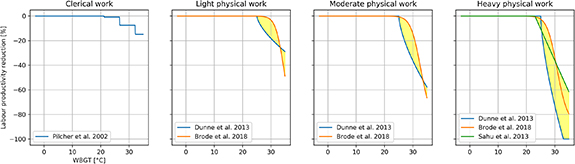
Figure 1. Impact functions representing varying occupational vulnerability to heat stress. The yellow shading indicates the range of impacts analysed to account for the impact function variation. The legends provide the references to the corresponding functions.
Download figure:
Standard image High-resolution imageLabour exposure captures the geographical location of workers, their number and occupations. In contrast to previous studies, which assumed that labour within sectors is homogenous and have the same vulnerability to heat stress, we consider an approach where labour consists of different occupations with their individual work intensities and a corresponding individual vulnerability to heat stress. We define four occupational groups corresponding to the impact function categories defined above, by analysing definitions of the International Standard Classification of Occupations 2 (ISCO) and combining them with data on physical intensity of occupations (Deyaert et al 2017) (SM 3). The regional employment in the four occupational groups is based on the labour force survey 3 (LFS) data. Specifically, employment in the first occupational group (cognitive work) includes workers undertaking light work indoors (attentional, perceptual, reasoning and memory tasks) and comprises the following ISCO major groups: managers (except hospitality and retail), professionals, and clerical support workers. We use data on physical intensity of occupations to compute quantity of workers in the three physical work categories. Regional employment corresponding to light physical work comprises all workers who's occupations are of less than 250 W intensity, the employment in moderate physical work includes all occupations with intensity between 250 W to 350 W, and employment in the heavy physical work covers all occupations with work intensity above 350 W (SM 4). In this study we assume that workers are acclimatised: although the immediate reaction of individuals to heat stress would depend on usual climate they inhabit, those differences are reduced with short-term acclimatisation (Sawka et al 2011, Périard et al 2016), and are not considered in analysis of gradual, climate-induced warming. The shape of the impact function would also depend on other demographic characteristics of workers, such an age, which are not reflected in this study.
2.1. Computation of productivity losses
Daily regional productivity losses are determined for each of the four occupational categories by the regional heat stress and according to the relevant impact function, and are annualised by adding up the daily losses. The regional employment in the four occupational groups, is used to aggregate the occupational losses into a single metric representing regional labour productivity loss. The results report 30 year average future losses (for the 2020s, 2050s and 2080s) from the average base period, 1990s (SM 5).
Economic impacts of changing productivity of labour are assessed with a dynamic growth model à la Solow (SM 7). The model is specified at country level and is calibrated using the Eurostat projections for labour and productivity growth (European Commission 2015), which allows to juxtapose changes in labour productivity in different climate scenarios with the labour force active and exposed in that particular year. In addition to the direct effect of the labour productivity shock, the model also captures the dynamic, long-term cumulative effects that operate through the capital investment processes. Economic impacts are presented as changes in annual GDP in 2013 Euros.
Adaptation that could alleviate the negative impacts of heat stress, is analysed in this study through two measures: further diffusion of space cooling and increase in the use of robotic exoskeletons (SM 6). Space cooling allows reducing heat stress by controlling the workers' immediate environment. Due to the specificity of workers' tasks, we assume that space cooling eliminates heat stress for workers in cognitive and light physical work occupational groups, according to the rate of air conditioning penetration in the country. The 2050 projections of the EU countries penetration rates for service sector (previous studies used residential space cooling penetration rates as a proxy) are taken from the POTEnCIA model (Mantzos et al 2019). For the subsequent period, we apply the average growth rate of the 2030–2050 period.
We also consider a preliminary assessment of adaptation potential of emerging robotic solutions, in particular wearable robotics or exoskeletons. The economic and ergonomic potential of this type of robots is considered to be significant (Yeem et al 2019). There are several aspects motivating the choice to model labour adaptation to heat stress through diffusion and use of exoskeletons. Firstly, they represent general-purpose technology able to physically support workers across the economy, irrespective of specific sector of their employment. Secondly, the technology is anticipated to diffuse rapidly in the next decades hence potentially offering a timely adaptation solution to the heat stress induced by the climate change. Finally, by modelling the future diffusion of the technology among countries based on their historical robotisation rates, we attempt to address question of how different countries could benefit from technological adaptation to heat stress if their future overall trends in technological adaptation would reflect their historical robotisation rates. The use of wearable robotics allows reducing the physical workload of humans so that it is assumed that heavy physical work becomes a moderate physical work. From global forecast of installation of wearable robotics (Blagoeva et al 2020, BRC 2018) and the historical European shares in the global stock of robots (IFR 2020), we compute the number of wearable robotics units in Europe until 2040; the results are further used to calibrate a logistic diffusion model, which extends the forecast until 2085. The future aggregate EU number of exoskeletons is distributed across the countries according to historical data on robot density in industry (more details in SM 6). Although introduction of wearable robotics would improve productivity of labour irrespective of effects of heat stress, the issue considered here pertains to the degree the technology can alleviate negative effects of heat stress on productivity of labour.
This study does not consider an explicit cost of adaptation. The adaptation measures considered are of autonomous type (Chambwera et al 2014) and, in contrast to planned or public adaptation, it is not driven by specific policy and quantification of the cost is very challenging to envisage (UNFCCC 2007). Since the technological adaptation considered here is assumed to diffuse over many decades, this process can be carried through new investments replacing depreciated capital.
Impact of adaptation is computed as a difference between adaptation and no-adaptation scenarios. In the adaptation scenario the AC and exoskeletons technology propagates until end of the century as described above, while in the no-adaptation scenario the technology diffusion is kept at the 2010 levels.
Uncertainty in the future climate is captured by using an ensemble of 11 climate models (SM 1), and the variation in impact function is addressed by using an ensemble of eight functions encompassing both prescriptive, standards-based functions and empirical functions. The productivity losses are computed for all climate model-impact function combinations, and the results report an average and a worst-case result.
3. Results
3.1. Heat stress
The changes in heat stress over time are illustrated with the number of days additional to the reference period, for which the WBGT temperature exceeds certain thresholds 4 (figure 2). In general, the number of the additional hot days increases over time, with a clear north–south gradient. Southern Europe, including regions in Spain, Italy, Croatia, Romania and Greece, could have an increase by about 15 d with WBGT greater than 25 °C by 2020s; by 2050s the increase is in a range of 40–50 d, and in 2080 there could be 60–70 more days hotter than 25 °C WBGT. For higher WBGT thresholds there is a significant increase in the number of days for most of Europe's Mediterranean coast where, in 2080s, there could be 50–60 additional days with WBGT greater than 28 °C.

Figure 2. Additional number of days per year with WBGT exceeding 25 °C, 26 °C, 27 °C and 28 °C, at the three time horizons (2020s, 2050s and 2080s) compared to the reference period (1990s).
Download figure:
Standard image High-resolution image3.2. Labour exposure
The degree of labour exposure for NUTS 2 regions depends of the regional intensity of heat stress and number of workers exposed to it, and is illustrated with population-degree-days, defined as the number of days with a WBGT larger than a certain threshold multiplied by the number of people exposed for that temperature 5 . Figure 3 shows the population-degree days for a WBGT threshold of 25 °C in 2080s. One can notice that there is a significant north–south asymmetry, with some of the most populated regions located in the south being also the regions potentially most affected by the increase in heat stress. Europe's most populous regions include also the metropolitan areas and in fact some more central regions, viz Île de France or Comunidad de Madrid, could be exposed to significant increases in heat stress.
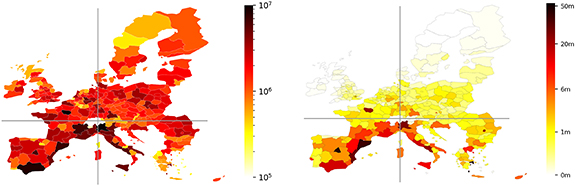
Figure 3. Population in NUTS 2 regions, persons in year 2015 (left) and population-degree days above 25 °C WBGT in 2080s based on 2015 population (right, million). The perpendicular lines indicate approximate quarters of the EU population.
Download figure:
Standard image High-resolution imageThe four occupational groups (cognitive work and three intensities of physical work), represent 35%, 15%, 37% and 13% of the European labour force, respectively. Figure 4 shows the shares of the relative employment for the occupational groups, with the European average being one. There are large geographical assymetries, with metropolitan regions but also northern and parts of central Europe employing above the average numbers of clerical workers. In Scandinavia, most of France and in Germany there are relatively more light physical work employees. There are more than average moderate physical work workers in eastern and southern regions, and this pattern is even stronger for the heavy physical workers, as those regions have economic activities traditionally linked to agriculture, forestry and fishing.
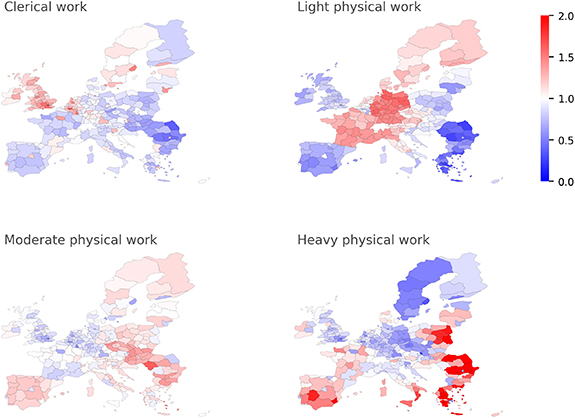
Figure 4. Shares of the employment by the four occupational groups in year 2018. Europe average = 1.
Download figure:
Standard image High-resolution image3.3. Vulnerability
The vulnerability of workers to heat stress is a function of the work type and physical intensity of their occupations. Figure 5 shows, for the NUTS 2 regions, the metabolic equivalent of task (MET 6 ) aggregated for all types of occupations 7 . A relatively low work intensity is found for metropolitan regions where clerical workers dominate. A higher MET intensity is computed for regions along the eastern European border (parts of Finland, Latvia, Lithuania, eastern Poland, regions in Romania), and southern Europe (southern Greece, southern Italy, Spain) and western and southern Ireland.
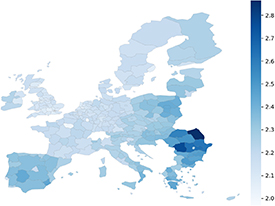
Figure 5. Physical intensity of labour force, MET, for NUTS 2 regions in year 2018.
Download figure:
Standard image High-resolution image3.4. Labour productivity
The maps on the left-hand side of figure 6 represent the regional reductions in labour productivity without adaptation for the three time horizons. The uncertainty in climate models projections and the variation in impact models estimates is reported as the average productivity loss (left column) and the worst-case loss (right column).
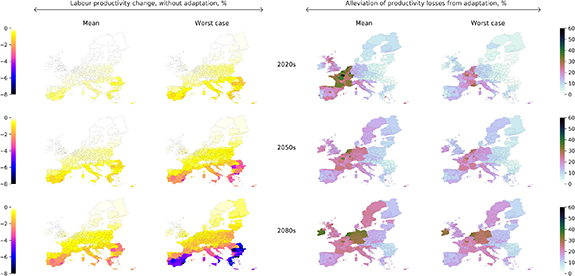
Figure 6. Labour productivity for warming levels at NUTS 2 regions, without adaptation (two columns on the left), and reduction of impacts with adaptation (two columns on the right). The rows show different time horizons, and the columns show average, and worst-case effect due to climate models projections and in impact models estimates.
Download figure:
Standard image High-resolution imageThe average productivity loss in Europe, compared to baseline climate, for the three time horizons is 0.1%, 0.3% and 0.7%, respectively. The worst-case scenario losses could be around three times larger and reach, respectively, 0.3%, 0.8% and 1.6%.
Those averages, however, mask underlying diversity of regional impacts. The spatial pattern of losses is very heterogeneous and regressive, with the largest reductions in southern European regions: south of Spain, then along the Mediterranean coast through France and Italy, Croatia and Greece, where the productivity losses can reach 3% by the 2080s on average, an up to 8% in the worst-case scenario. Quite high productivity losses are also estimated for Romania, and they result from the combination of an increase in hazard and a significant exposure (large proportion of high intensity physical work as in figures 4 and 5), leading to high impacts.
Similar labour productivity losses can result from different combinations of its constituent components, e.g. higher hazard and lower exposure can yield a similar productivity loss than lower hazard and higher exposure. That is the case, for example, of Spanish Andalusia and Catalonia, which have similar average losses in productivity of about 3% in 2080s, while Catalonia is subject to greater increase in hazard (with about 20 additional days above 26 °C WBGT compared to ten additional days in Andalusia, figure 2). Conversely, Andalusia is more exposed with lower proportions of less vulnerable workers (clerical and low physical intensity occupations) and higher proportions of workers in more vulnerable occupations (moderate and heavy physical intensity occupations) (figure 4).
The maps on the right-hand side of figure 6 show the reductions in impacts thanks to the two adaptation measures. Adaptation can reduce the productivity losses by around 40%, with higher rates of reduction for the lower warming levels.
The importance of the two adaptation measures (figure 7) depends on the occupational composition of labour, the adaptation diffusion rates and the intensity of increase in heat stress. Air conditioning dominates as adaptation method in the short term (2020s), as the diffusion of robotic solution have not yet gained significance. Exceptions are regions for which the robotic adaptation technology has steeper diffusion curve (e.g. Germany, Finland, Ireland) or regions with larger share of high intensity physical workers who can benefit from the technology (e.g. eastern regions in Poland, or in Romania). This trend becomes more pronounced over the 2050s and in 2080s, when the robotic adaptation technology diffuses more rapidly and accounts for up to 30% of adaptation in regions of France, Spain and the UK, and up to 70% in regions of Central and Eastern Europe.
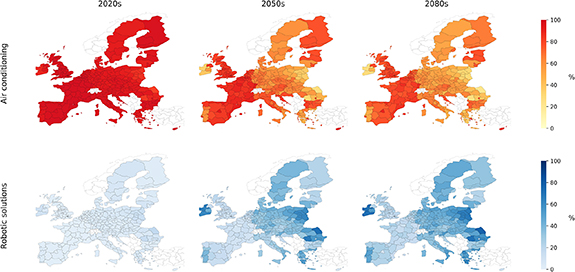
Figure 7. Relative importance of space cooling and robotic exoskeletons in alleviating labour productivity losses through adaptation. The scale shows percentage of productivity losses avoided due to space cooling in total avoided losses.
Download figure:
Standard image High-resolution image3.5. Economic implications
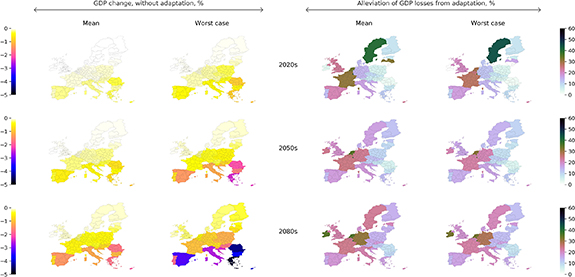
The annual economic losses in Europe could reach 563 bn € or 1.15% of GDP by the 2080s in the worst case scenario, with very uneven regional distribution (figure 8). Spain, Italy, Greece, Cyprus and Romania could lose around 2% of their GDP by 2080s, or 3%–5% under the worst-case scenario. Central European countries could lose 0.6% of their GDP (1.1% in the worst-case scenario) by the 2080s, and the northern Europe countries losses would not exceed 0.23% GDP even in the worst-case.
Figure 8. GDP change (%) without adaptation (left) and alleviation of GDP loses (%) due to adaptation (right). Impact shown for the three time horizons (rows) and for the mean and worst-case of the ensemble.
Download figure:
Standard image High-resolution image
There is a progressive effect in GDP loss from the reduced labour productivity, which can hinder economic growth to a larger extent in countries whose economies would grow faster otherwise. For countries with a relatively higher economic growth forecast resulting from increasing labour force (e.g. Ireland, Spain, Belgium), or increase in total factor productivity (e.g. Sweden, Germany, and Denmark), or higher investments (e.g. Sweden, Germany), a loss in a unit of labour productivity translates into a larger GDP loss when compared to the same labour productivity loss in countries growing at a slower rate (see (c) in SM 8). A contrasting example including two very different countries with respect to productivity, demographic projections and investments, shows that the ratio of GDP loss to the productivity loss is 1.1 in Sweden while in Spain only 0.75.
4. Discussion and conclusions
We have assessed how heat stress due to future climate change can affect productivity of workers and economic activity in Europe using an integrated dynamic risk framework, exploring also how uncertainty regarding climate modelling and variability in the impact function can affect the results.
We have found a spatial correlation between variability in heat stress and exposure, with southern European regions not only subjected to greater heat stress but also featuring an occupational composition of its labour force that makes them more susceptible to heat. In the worst-case scenario, European labour productivity losses could reach 0.3%, 0.8% and 1.6% by the three time horizons (2020s, 2050s, and 2080s), respectively. Those aggregates, however, mask much skewed country-level results ranging from virtually no impact in the north to more than 2% productivity losses in the south in the 2080s. Regional results further revel a great deal of spatial heterogeneity within some countries, confirming the regressive distributional impacts of climate change; for example in Spain, France, Italy, Greece and Romania productivity losses range from less than 0.5% in the north to more than 8% losses in their southern regions in the 2080s.
The GDP impacts largely reflect the labour productivity losses, with differences emerging due to the varying importance of labour in production and the relative growth of productivity versus that of the other production factors.
The potential for adaptation to reduce those impacts is large, reaching up to 50% for low levels of heat stress. Further increases in heat stress diminish the effectiveness of adaptation to about 30%. Space cooling plays a more important role in the short term and in the south, while robotics solutions, which have been preliminary assessed, gain importance when moving north, reflecting the higher propensity of those countries to adopt the robotic adaptation technology. If the future overall trends in technological adaptation would follow current robotisation rates, as assumed in this study, the countries whose workers are to experience the largest heat stress from climate change, such as Spain, Cyprus, Romania, Bulgaria, France and Greece, will also see some of the lowest diffusion rates of the relevant adaptation to reduce damages.
The regressivity of impacts is also noted with respect to income: as negative productivity impacts increase when moving southwards, the corresponding earnings decrease, particularly for the most vulnerable occupational groups engaged in physical work (see distributional aspects in SM 8).
It should be noted that there are large uncertainties both in the underlying data and modelling that should be considered when interpreting the results. For instance, there is little empirical evidence base underlying the impact functions linking labour productivity with the climate change variables; the regional heat stress indicator is computed using gridded population data, as gridded employment data is not available; the modelling of adaptation remains also a challenging issue due to the need to consider complex behavioural and institutional aspects (e.g. Morris et al 2020).
Further research, on top of addressing the noted uncertainties and limitations, could further explore the distributional implications of climate change, considering issues like occupational earnings. Just resilience issues need to be better understood in order to minimize the climate change burden upon the most vulnerable.
Acknowledgments
We would like to thank our colleagues Alessandro Dosio, Luc Feyen and David Garcia-Leon for their comments and suggestions, and Alessandra Bianchi for assistance with data processing. EUROSTAT has also kindly provided detailed occupational information from the LFS and Structure of Earnings Survey.
Data availability statement
The data that support the findings of this study are available upon reasonable request from the authors.
Footnotes
- 1
All climate data is available at: www.euro-cordex.net/.
- 2
ISCO is an International Labour Organization (ILO) classification structure for organizing jobs into a clearly defined set of groups according to the tasks and duties undertaken in the job.
- 3
A statistical survey capturing data about labour market.
- 4
We use thresholds only here to illustrate increase in heat stress. For computation of productivity losses we use the continuous temperature distribution for all regions.
- 5
For example, value of ten indicates one person exposed for 10 d to the WBGT greater than the threshold. The same value can result from different temporal and spatial combinations, for example two persons exposed to a specific WBGT over 5 d, or five persons exposed to a specific WBGT over two days.
- 6
MET is a measure of exertion required for different activities. For example, resting or idle sitting amounts to 1 MET, walking to 2 MET and playing tennis to 5 MET, approximately.
- 7
This is indicative as the aggregation also includes MET values for clerical workers which, by definition of exposure (see section 2), is based on occupation description not the physical intensity of work.