

Abstract
Cropland expansion is a common strategy for boosting agricultural production in sub-Saharan Africa (SSA) even though it often leads to economic, environmental, and social trade-offs. Ensuring sustainable cropland use and their management is critical for improving food security and preserving ecosystem services. To develop policies and approaches that support sustainable cropland management at national and sub-national scales, there is a need to understand the spatial distribution of cropland expansion (/loss), and any resultant changes in cropland productivity. This is especially important in SSA countries such as Malawi, where spatially explicit assessments of changes in cropland area and cropland productivity are lacking. To address this gap in Malawi, we used multi-source satellite data and socio-economic data, combined with satellite image classification and trend analysis, firstly to quantify spatial changes in cropland area and productivity, and secondly to evaluate potentially available cropland for future expansion. We found evidence of unsustainable cropland use in Malawi, which was demonstrated by: (a) rapid cropland expansion between 2010 and 2019 (increase 8.5% of land area), characterized by an expansion of crop farming into upland areas which indicate increased land scarcity in Malawi; (b) limited potential for future expansion, as approximately only 5% of the total land remained as potentially available cropland (corresponding to 4671 000 ha); and (c) an overall reduction in cropland productivity and a prevalence of increase in soil erosion. Our findings underscore the urgent need for taking measures to promote sustainable cropland use, including by protecting current cropland from further degradation (e.g. Southern Malawi) and improving cropland use planning (e.g. Northern Malawi).
Export citation and abstract BibTeX RIS

Original content from this work may be used under the terms of the Creative Commons Attribution 4.0 license. Any further distribution of this work must maintain attribution to the author(s) and the title of the work, journal citation and DOI.
1. Introduction
Approximately two-thirds of the population in sub-Saharan Africa (SSA) relies on agriculture as the main livelihood activity (Jayne and Ameyaw 2016). It is projected that the population in SSA will increase by two and half-fold by 2050, resulting in a tripling of food demand (Van Ittersum et al 2016). However, the current level of crop production is not adequate to meet this expected demand, which is largely due to limited advancements in agricultural intensification across SSA (Alexandratos 1999, Grassini et al 2013, Binswanger-Mkhize and Savastano 2017, Jayne et al 2019). In addition, climate change (Hoffman et al 2018) and land degradation are negatively affecting yield (Tully et al 2015, Zingore et al 2015). Under the pressure of growing food demand and low cropland productivity, cropland expansion has been used as the main strategy to meeting the growing food demand across SSA (Brink and Eva 2009, Chapoto et al 2013, Grassini et al 2013). The cropland expansion is predicted to continue into the next decades (Alexandratos 1999, Tilman et al 2001, Dobrovolski et al 2011, Lambin et al 2013, Delzeit et al 2017).
Unfortunately, for most SSA countries, available land for crop farming is limited and shrinking (Lambin et al 2013). While this expansion increases food production in the short term, most studies agree it is unsustainable in the long run (Zabel et al 2019), especially given the environmental trade-offs. For instance, studies have demonstrated that cropland expansion leads to the depletion of critical ecosystem services (Foley et al 2005, Almaw et al 2020), deforestation (Ordway et al 2017), biodiversity loss (Chaplin-Kramer et al 2015, Zabel et al 2019) and higher greenhouse gas emissions (Foley et al 2011, Searchinger et al 2015). Consequently, interventions are needed to promote sustainable cropland use and address uncontrolled cropland expansion (DeFries et al 2004), and forestall the low yield that is associated with expansion in SSA (Jayne et al 2010, Grassini et al 2013). Spatially quantifying changes in cropland area and its association with changes in crop productivity is critical information for implementing effective interventions and providing evidence for policies to address land scarcity challenges.
Quantifying changes in cropland extent in SSA can be based on land cover datasets available at global and regional scales. However, these datasets are lacking in consistency and reliability (Fritz et al 2011a, Estes et al 2018, Samasse et al 2018, Nabil et al 2020), and often only refer to a single year or limited time period (Fritz et al 2011b, Vancutsem et al 2013, Haack et al 2015, Xiong et al 2017). These limitations together with heterogeneous landscapes of smallholder farming hinder the accurate quantification of changes in cropland area. In addition, monitoring changes in cropland productivity over a longer time period (e.g. ten years) is logistically challenging and expensive, especially by collecting field data over large areas such as covering national territories (Carletto et al 2015). Remote sensing data with a fine spatial resolution (e.g. 10 m, 30 m), which allow for characterization of the spatiotemporal variability of cropland area and cropland productivity over multiple years (Weiss et al 2020) in smallholder farming landscapes (Burke and Lobell 2017, Jin et al 2017), together with socio-economic data, provides a great potential for a comprehensive evaluation of the sustainability of cropland use.
This paper provides, for the first time, a spatially explicit assessment of the sustainability of cropland use in Malawi as a case study for SSA. Malawi faces many of the same challenges as other SSA countries, including low yield (0.81–4.1 t ha−1) and large yield gap (Tamene et al 2016), land scarcity, population growth, and soil degradation (Chirwa et al 2008, Gausi and Mlaka 2015). This makes Malawi an illustrative case for considering the broader implications of assessing the sustainability of cropland use for cropland management policies in SSA. Specifically, by combining satellite data, population data, and household surveys, we aim to (a) quantify and characterize changes in cropland area between 2010 and 2019, (b) quantify changes in cropland productivity and soil erosion from household survey data to further evaluate cropland degradation and its correlation with cropland expansion, and (c) evaluate potentially available cropland for future expansion—particularly important for policymakers seeking to develop efficient and effective land-use planning policies (Lambin et al 2013, Estes et al 2016). We characterized changes in cropland area with elevation, distance to rivers, settlements, and roads to test if cropland expansion moved into upland areas that are far away from rivers, roads, and markets due to rising land scarcity in lowlands and floodplains, as has been evidenced elsewhere (Zeng et al 2018). We further investigated the role of smallholder farming in cropland expansion using population data and data on smallholding field size based on the Malawi Integrated Household Survey.
2. Data and methods
2.1. Spatial quantification of changes in cropland area
2.1.1. Estimating changes in cropland area from 2010 to 2019
To estimate changes in cropland area, we firstly reviewed and evaluated the cropland spatial distribution as mapped by seven existing regional/global land cover datasets for Malawi. We found there were considerable spatial inconsistencies amongst these datasets, especially in the early 2000s (figure S1 available online at stacks.iop.org/ERL/16/084052/mmedia). Considering the low satellite data availability (e.g. Landsat data) and accuracy of land cover products in the early 2000s, we focused our analysis on a later period, i.e. from 2010 to 2019. We provided a detailed comparison of the existing land cover dataset and justification of the land cover dataset used in this study in the supplementary material (section S1.1). We extracted the cropland area in 2010 from the GlobeLand30 land cover dataset (Chen et al 2017), which was selected because of its relative high resolution (30 m) compared to other land cover datasets (e.g. 250 m ESACCI, 500 m MCD12Q1) and proved being accurate in representing land cover in Africa (Jacobson et al 2015, Samasse et al 2018, Wei et al 2020) as well as in Malawi by referencing Google Earth high-resolution satellite images (supplementary section S1.1). We identified locations and extent of cropland area in 2019 based on the land cover classification performed in this study. We adopted the same land cover categories (Forest, cropland, grasslands, shrublands, wetland, water body) and the same hierarchical classification scheme (Sulla-Menashe et al 2011, Chen et al 2014) as GlobeLand30 2010 (Chen et al 2017) to ensure consistency between the 2010 and 2019 land cover maps. We used the 2010 GlobeLand30 land cover dataset as a baseline by classifying, first, the areas with changes in land cover type from 2010 to 2019 and, then, adding the areas newly identified in the 2019 classification for each land cover type. Specifically, the study area was decomposed into seven main classes (water bodies, barren lands and artificial surfaces, forests, cropland, shrublands, grasslands) which were identified in sequence. We used the global surface water dataset (Pekel et al 2016) to identify the permanent water bodies in Malawi in 2019. Then, we classified newly developed bare land and settlements from 2010 to 2019 using the Enhanced Vegetation Index (EVI) (Liu and Huete 1995) threshold classification. A threshold of maximum seasonal EVI of 0.3, which classify 97% of the non-vegetated area (figure S2), was defined that by sampling vegetated pixels (including shrubland, cropland, and grassland) and non-vegetated pixels (including bare land and settlements) based on Google Earth high-resolution images. We further used the Global Forest Change dataset (Hansen et al 2013) that has been updated to recent years to define forest area in 2019. Finally, we used the Landsat-8 datasets from November 2019 to April 2020, topography dataset to classify croplands, shrublands, and grasslands. 33 training features including six spectral bands; four spectral indices; elevation, slope, and aspects (computed from (Farr et al 2007) were used to train the random forest classification algorithm. Spectral indices, including Normalized Difference Vegetation Index (NDVI) (Defries and Townshend 1994), EVI (Liu and Huete 1995), Normalized Difference Water Index (Gao 1996) and Normalized Difference Built-up Index (Zha et al 2003), were calculated four seasonal intervals (calculated from Landsat-8 satellite data from January 2018 to April 2020) to capture the phenology of vegetation. We manually selected training samples of each class by referencing recent Google Earth satellite images of Malawi and Sentinel-2 satellite RGB images (Nov 2019 to April 2020). We used 70% of samples to train the hierarchical classification scheme, while the remaining 30% for assessing the accuracy of the final 2019 land cover classification. The final accuracy reached up to 82% with cropland accuracy of 83.5%. We provided detailed explanations of the classification datasets, scheme, outputs, and accuracy assessment in the supplementary material (section S1.2 and table S2). By comparing croplands in 2010 and 2019, we identified locations and extent of changes in cropland area, including cropland expansion and cropland loss, at the spatial scale of 30 m.
2.1.2. Characterizing changes in cropland area
We explored the association between cropland expansion with the pertinent geographic variables including elevation (Farr et al 2007), distance to rivers (data from (Lehner et al 2008)), settlements and roads (data from OpenStreetMap) in order to assess potential spatial trends in cropland expansion, with a focus on cropland converted from deforestation. To do this, we firstly identified croplands from deforestation during 2001–2018 by overlapping the locations of deforested areas from the Global Forest Change dataset (Hansen et al 2013) and the cropland area we classified for 2019. As the Global Forest Change dataset is available from 2001 to 2018, we were able to identify locations of cropland expansion from deforestation on a yearly basis over a longer period from 2001 to 2018. We then calculated the average elevation of these expanded croplands, along with their distance to rivers, settlements, and roads. We were also able to calculate cultivation ages of these croplands, based on the assumption that cropland conversion occurred in the same year as deforestation and continued up to 2019, to further investigate changes in cropland productivity in different cropland age groups (section 2.2).
In order to investigate the role of smallholder farming in changes in cropland area, we further correlated changes in cropland area to the population growth rate (Linard et al 2012) and field size (corresponding to crop field parcel size cultivated by smallholder farmers). To do this, we first calculated the ratio of cropland area change at the district level, by dividing the total change in cropland area in each district from 2010 to 2019 by the total non-cropland area in 2010 (including land covers representing non-cultivated vegetated lands, such as grassland, shrubland, forest, and wetland). Here, the ratio of cropland area change consists of cropland loss ratio and expansion ratio. Cropland expansion ratio refers to the proportion of gross cropland increase in total non-cropland area. We then calculated the population density growth rate over 2010–2019 using the slope of a linear regression of population density, then averaged the population growth rate at the district level, including 28 districts and major urban areas from three Malawi regions. Finally, changes in field size for the year 2010 and 2016 were based on the household survey dataset (National Statistical Office 2011, 2016), which was used to monitor changes in household food security and agriculture activities from World Bank's Living Standard Measurement Study (National Statistical Office 2011, 2016). We calculated changes in field size at the district level using 36 000 household surveys for 2010 and 2016 to investigate whether field size cultivated by smallholder farmers tends to be bigger in districts with a higher expansion ratio. We provided a detailed description of pre-processing and overview of raw household survey data in the supplementary material (section 2.1).
2.2. Changes in cropland productivity
We used the commonly used satellite-derived measure of vegetation greenness, the NDVI, as a proxy for cropland productivity. NDVI is proven to be a good indicator for crop yield estimation in smallholding crop fields in SSA (Burke and Lobell 2017), including for maize which is the dominant crop type cultivated by over 97% of households in Malawi (Denning et al 2009) as well as other crop types cultivated in Malawi such as millet and sorghum (Lambert et al 2018). In addition, NDVI is a widely used proxy for monitoring cropland productivity and degradation (Wessels et al 2004, Barbier and Hochard 2018, Easdale et al 2018, Gichenje and Godinho 2018). In this study, we calculated changes in yearly mean NDVI value (MOD13Q1) (Didan 2015) during crop growing season (November – April) as a proxy of cropland productivity. To avoid any confusion of changes in NDVI caused by land cover conversion, we calculated changes in NDVI in permanent croplands that are classified as cropland in both 2010 and 2019. We conducted the linear trend analysis by applying a linear regression model of annual mean NDVI at the pixel level (Higginbottom and Symeonakis 2014, Gichenje and Godinho 2018) and then averaged the slopes of the linear regression at the district level. In this case, positive values indicate increases in cropland productivity while negative values indicate reductions in cropland productivity. Detailed analysis and spatial distribution of changes in cropland productivity can be found in the supplementary material (section S3). In addition, to further test the hypothesis that cropland productivity tends to decline in croplands with longer cultivation age, we analyzed changes in cropland productivity for croplands with different cultivation ages (as described in section 2.1.2). The time period for analyzing the changes in productivity is in line with cultivation age. For example, croplands with the cultivation age of eight years, linear regression of yearly mean NDVI value from 2010 to 2018 was analyzed. To capture the meaningful time series analysis, changes in yearly NDVI were analyzed only for croplands older than four years. Finally, we further used the household survey data on soil erosion level. The soil erosion level was estimated by smallholder farmers from the Malawi household survey and is based on four categories: (a) No Erosion, (b) Low, (c) Moderate, and (d) High. We computed changes in soil erosion level for the year 2010 and 2016 at the district level by calculating the mean value for each district for both years, based on a total of 37 000 surveys. These sample surveys were collected using a stratified sampling scheme that is representative of each district (supplementary material section S3.2). In this case, positive values indicated more severe soil erosion while negative values indicated lessened soil erosion. Changes in soil erosion and NDVI were further correlated to the ratio of cropland area change to understand their association with cropland expansion.
2.3. Estimation of potentially available cropland
To identify and estimate the potentially available cropland for future expansion, we used the World Bank definition of potentially available cropland (Deininger and Byerlee 2011), defined as areas that are non-forested, non-protected, populated with less than 25 persons km−2, and are currently not cultivated. These potentially available croplands normally correspond to grasslands, long-term fallows, and shrublands suitable for rainfed agriculture (Lambin et al 2013). This definition tends to emphasize the biophysical production potential that is based on land and climate characteristics (Chamberlin et al 2014) rather than the production potential based on economic profitability, cost of land conversion, and accessibility to roads and markets (Lambin et al 2013). Based on land cover types classified in this study for 2019 and the above definition, we estimated potentially available cropland for future expansion across Malawi. More details on the justification and results of potentially available cropland can be found in supplementary material section 4. We summarized all datasets used in this study and illustrate the framework of the analysis, listing the main outputs in figure 1. All satellite data processing and land cover classification were conducted in the Google Earth Engine cloud-based platform (Gorelick et al 2017).
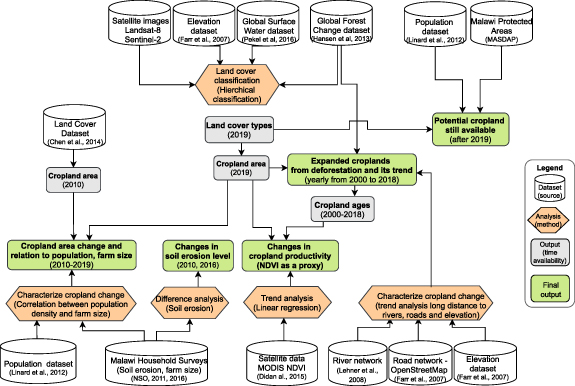
Figure 1. Flowchart including the 11 datasets used in this study, and methodological framework and main outputs of this study.
Download figure:
Standard image High-resolution image3. Results
3.1. Spatial quantification of changes in cropland area and potentially available cropland
Cropland area in Malawi increased by 8.15% of total land area from 39.6% (with an accuracy of 80.33% (Chen et al 2017)) in 2010 to 47.75% of total land area in 2019 (with a cropland classification accuracy of 83.5% from this study). Figure 2 shows the strong spatial variability of cropland expansion in Malawi: the Central Region experienced the largest expansion area (379 880 ha), followed by the Northern Region (198 880 ha), and lastly by the Southern Region (137 000 ha). Most conversions were from grasslands (7.7% of the total land), and deforestation accounted for a smaller portion (0.2% of the total land). However, cropland expansion accounted for 31% of forest loss on average from 2001 to 2018, which showing a decline trend from 41% in 2001 to 25% in 2018 even though the total forest loss area increased steadily (figure 3(a)). Croplands converted from deforestation were located increasingly towards higher elevations and further away from rivers, roads (figure 3(b)), with trend significance of p < 0.05 (elevation), p < 0.01 (roads and river), and p = 0.17 (settlements) according to the Mann-Kendall test.

Figure 2. Map shows cropland expansion, cropland loss from 2010 to 2019, and potentially available cropland in 2019 in Northern, Central and Southern regions in Malawi. Inset map shows the location of Malawi in Africa, and Malawi districts and regions boundary.
Download figure:
Standard image High-resolution image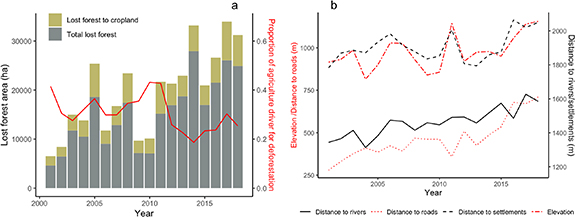
Figure 3. Total forest loss area and lost forest area that converted to cropland from 2010 to 2018 (shown in bar) and the proportion of converted cropland area in total deforestation area showing the proportion of agriculture driver for deforestation from 2001 to 2018 (red line) (a); Spatial trends of croplands expansion from deforestation along elevation, distance to roads (left-hand vertical axis) and distance to rivers and settlements (right-hand vertical axis) in 2001–2018 (b).
Download figure:
Standard image High-resolution imageWe also estimated that cropland loss accounted for 0.2% of total land (approximately 25 285 ha). Most of these croplands were converted to either settlements or bare land (87.6% of whole cropland loss area), with the remainder to forest (7.3%) and water bodies (5.1%). We found that only 5% of the total land in Malawi (approximately 4671 000 ha) remained as potentially available cropland for future expansion (according to the definition reported in section 2.3), with higher potential in the Northern region (figure 2 and supplementary material section S4). We estimated that these potentially available croplands would only support expansion for the next five years, by adopting a simple business-as-usual scenario, i.e. assuming that the national average expansion rate observed in the past will not be altered by major changes in policies or conservation practices.
3.2. Characterizing changes in cropland area
We correlated changes in cropland area to rural population growth and field size to understand the roles of smallholder farming in driving cropland expansion. We found that a higher population growth rate in rural areas was associated with a higher cropland expansion ratio (figure 4(a)) (p < 0.001). Given that the rural areas consist almost entirely of smallholder farmers (Tchale 2009), this result might indicate that smallholder farmers have contributed to cropland expansion. However, this association only held when sufficient land was available for expansion. In fact, we found that a lower expansion ratio was observed in urban areas despite the higher population growth rate by correlating cropland expansion and population growth (figure 4(a)). While a weak positive correlation between cropland loss ratio and population growth (R2 = 0.38) (figure 4(b)) indicate that higher cropland loss ratio generally comes with a higher population growth rate generally, particularly in the urban areas as well.
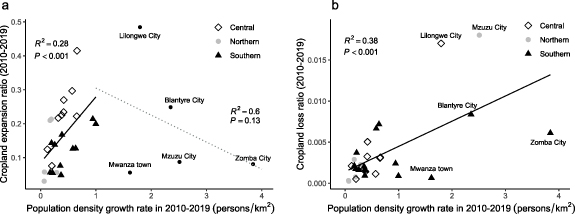
Figure 4. Correlation between population growth rate and cropland expansion ratio (refers to the proportion of gross cropland increase in total non-cropland area) (a), and cropland loss ratio (b) for districts in Northern, Central and Southern region (differentiated by marker type) in Malawi including labeled major cities. In figure 4(a) solid line shows the regression line (R2 = 0.28, P < 0.001) for districts excluding cities, the dashed shows the regression line for four major cities and towns (R2 = 0.6, P = 0.13).
Download figure:
Standard image High-resolution imageWhile our results show an overall expansion in cropland area, we found that the average field size under cultivation by smallholder farmers reduced from 0.375 ± 0.0047 ha in 2010 to 0.365 ± 0.052 ha in 2016 (figure S5(a)) based on our analysis of the Malawi household survey data (supplementary material S2.1). However, looking into the spatial variation of changes in field size at the sub-national level, we found that field size tended to increase in districts with a higher expansion ratio (i.e. Central Region) and to decrease in districts with a lower cropland expansion ratio (i.e. Northern and Southern Region) (figure 5).
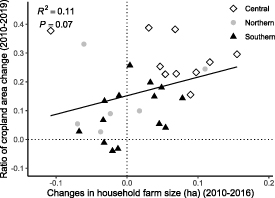
Figure 5. Correlation between changes in field size (refers to crop field parcel size) and the ratio of cropland change area averaged at the district level. The dashed lines show the division of positive and negative changes in field size and cropland area.
Download figure:
Standard image High-resolution image3.3. Spatial quantification of changes in cropland productivity
We found that most districts (19 among 31) showed reduced cropland productivity between 2010 and 2019, with a concentration in the Southern Region (figures 6(a) and S7(a)). Our analysis also showed that the soil erosion level increased in most districts (22 districts among 31) in 2010–2016 (figures 6(a), S8 and S9(a)). Reduced cropland productivity correlated to cropland cultivation age, as we found increased productivity in new croplands while reduced productivity in areas with a longer cultivation period (figure 7). Our result also indicates that on average cropland productivity starts to decline after ten years of cultivation (figure 7).

Figure 6. Changes in cropland productivity (slope of NDVI linear regression with significant trend) and soil erosion (a), the labeled districts show that only 3 districts among 31 districts experienced reduced soil erosion level and improved cropland productivity. Correlation between changes in cropland productivity (NDVI) and the ratio of cropland area change at the district level (b). Dashed lines for both figures show the division of positive and negative values.
Download figure:
Standard image High-resolution image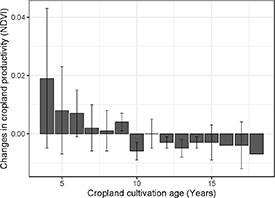
Figure 7. Changes in cropland productivity (slope of NDVI linear regression with significant trend (p < 0.05)) for different cropland age groups. NDVI time series were analyzed for the time period that correspond to age group (i.e. ten years age corresponding to the time period 2011–2018). Bar shows the average value of slope in NDVI linear regression. Whisker shows the standard deviation of the slope for each age group.
Download figure:
Standard image High-resolution image
We found that districts with reduced productivity showed a lower rate of cropland expansion ratio by correlating changes in cropland productivity to the ratio of cropland area change, such as some districts in the Southern Region (figure 6(b)). Districts experiencing increased productivity tended to show a higher cropland expansion ratio, as seen some in the Central Region (figure 6(b)). However, the correlation between changes in cropland productivity and cropland area is week. Only 13% of changes in cropland area can be explained by changes in cropland productivity and causality is not clear from this correlation. However, a comparable pattern was also observed for soil erosion by analyzing changes in soil erosion levels between 2010 and 2016, showing that expansion ratio tended to be lower in areas with a higher soil erosion level (figure S10(a)).
4. Discussion
4.1. High cropland expansion rate with limited potentially available cropland
Overall, we observed a significant cropland expansion in Malawi over the last decade, but a little cropland loss. Compared to the The Food and Agriculture Organization (FAO) dataset, which provides cropland information only at the national level (FAO 2019), this study presented spatially explicit data on cropland expansion and cropland loss on both national and sub-national scales. This more nuanced approach is critical for policymakers, given their need to develop evidence-based interventions that are appropriate for specific contexts. Our estimation of cropland expansion is higher than the FAO estimation (FAO 2019) (figure S3); this might be due to methodological differences, specifically pertaining to the satellite image classification used in this study and the questionnaire survey conducted by the National Statistical Offices and Ministries of Agriculture (FAO 2019). Although inconsistencies exist in the estimation of cropland area using different methodologies, changes in cropland area should still be captured in individual datasets. In this regard, we found that the FAO estimation had not captured any changes in cropland area since 2014 when the cropland area remained the same with 3800 000 ha in Malawi (FAO 2019) (figure S3). On the contrary, our results are in line with other estimates which have also observed cropland expansion in Malawi in recent years (Omuto and Vargas 2019). In addition, some researchers argue that in general studies tend to underestimate existing cropland area but overestimate potentially available cropland, mainly considering widespread land scarcity, land degradation and deforestation (Young 1999, Chamberlin et al 2014).
Accurately identifying cropland location and changes in time is challenging in SSA because of the high heterogeneity and fragmentation of smallholder farming landscapes. Even though high-resolution satellite data with a grid size of 30 m (Wei et al 2020) or 10 m (Gong et al 2013, 2019) may overcome this challenge by improving the accuracy of land cover classification, limitations of satellite estimation still exist for small fields, especially when the field size is smaller than satellite image pixel size. Also, it is difficult to detect scattered trees, houses, and small natural vegetation patches among and between crop fields with current satellite data (figure S4). This technical challenge can lead to an overestimation of cropland area, but this overestimation should be consistent across the analysis conducted in different years and therefore have a limited impact on estimations of changes in cropland area. Another challenge is to distinguish fallow fields from permanent cropland fields (Tong et al 2020). In this study, we classified fields that were cultivated in 2019 as crop fields but some may have been left fallow before 2019. However, these fallow fields should account for a small area as fallow practices have reduced throughout SSA (Jayne et al 2014, Binswanger-Mkhize and Savastano 2017). Multi-temporal satellite data that can capture the different seasonal cycles of vegetation types enable classifying fallow fields from crop fields (Tong et al 2020). Combining this phenology-based classification method with high-resolution satellite data (i.e. Worldview) could offer potential improvements in classifying small crop fields in SSA (McCarty et al 2017, Mohammed et al 2020), which could be a way forward for future studies aiming at improving accuracy in cropland area detection.
Rapid cropland expansion leaves less room for future expansion. We estimated that the potentially available cropland only accounts for just over 5% of the total land, which is very small compared to the current cropland proportion of 47% of the total land in 2019. As noted in section 2.3, the definition of potentially available cropland used in this study emphasizes production potential, giving less consideration to profitability and expansion constraints, including infrastructure availability, and therefore likely leads to an overestimation of potentially available cropland. However, our finding that cropland had expanded to higher-elevated regions further removed from roads, settlements, and river basins indicates that new farmlands have been established despite poor infrastructure. This firstly suggests a low level of agricultural intensification in the expanded croplands. Secondly, the findings suggest that severe land scarcity and growing land demand have pushed farmers to cultivate in areas with unfavorable conditions. The establishments of new farmlands in higher-elevated and unfavorable conditions were probably driven by smallholder farmers in Malawi, as also noted in other countries in SSA (Ordway et al 2017), suggesting that undeveloped infrastructure might not deter smallholders from seeking new farmlands. Indeed, we found that population growth in rural areas leads to cropland expansion, which has also been widely reported throughout SSA (Chapoto et al 2013, Dorosh and Rashid 2013). Malawi household survey analysis showed that there is worsening land scarcity as exemplified by reduced field size at the national scale. However, spatially analysis showed that field sizes are getting bigger in the Central region with a higher cropland expansion ratio. Recent studies evidenced a rise of medium-scale farms in Malawi (Jayne et al 2016), and this is particularly the case for districts in the Central Region (Anseeuw et al 2016). However, future research is needed to understand interactions between changes in field size and expansion. For example, further research topics could include whether increases in field size in Central Region districts were necessarily happening where cropland was expanding, who was benefiting from increased field size in Central Malawi, and how cropland expansion and changes in field size affect the equality of land acquisitions in Malawi.
4.2. Cropland expansion under reduced productivity
Land scarcity was compounded by cropland degradation in Malawi, as demonstrated by reduced cropland productivity and high rates of soil erosion. Defining and evaluating land degradation has been subject to considerable debate in the literature as these require a specific temporal and spatial context and can be indicated by multiple proxy data (Vogt et al 2011, Tully et al 2015, Barbier and Hochard 2018). Our evaluation focused on a national scale and used two independent indicators including satellite NDVI data (served as a proxy for cropland productivity) and farmer perception on soil erosion based on the Malawi household survey (figure 6(a)). The correlation between soil erosion and reduced cropland productivity is not clear based on the results of this study, however, both of these datasets pointed towards a trend of cropland degradation over the last ten years in Malawi, although with limitations of using the two indicators.
Firstly, NDVI from satellite data carries limitations in evaluating cropland degradation. Changes in NDVI only provide a proxy of changes in cropland productivity. Studies across SSA have found that vegetation index such as NDVI could explain yield variation in different crop types only with reasonable success (R2:0.3–0.6) (Burke and Lobell 2017, Jin et al 2017, Lambert et al 2018, Jain et al 2019). In addition, changes in NDVI at spatial resolution of 250 m generally provide estimation in changes of cropland productivity at the regional scale rather than at the field scale in SSA. Nevertheless, satellite data offers longer-term (ten years in this study) monitoring which is critical for cropland degradation monitoring and overcome any inter-annual changes in cropland productivity resulting from droughts or management practices. We found that the persistent declines in NDVI trend in the Southern region (figures 6(a) and S7) potentially indicates chronic cropland productivity reduction and cropland degradation. Further studies on examining crop yield at field scale and improve yield estimation accuracy by using crop biophysical variables such as leaf area index; implementing physically-based crop growth models and machine learning algorithms are needed (Chivasa et al 2017, Cai et al 2019, Zhao et al 2020), to support more reliable monitoring of cropland degradation.
Secondly, soil erosion level from household surveys provided limited accuracy as it was based on farmers' perception on the severity of soil erosion in Malawi. However, farmers' perception on soil erosion is critical for land degradation evaluation in the data-spare regions such as SSA countries (Nigussie et al 2017). Studies have found that farmers' estimates on soil erosion generally match empirical and theoretical findings. For example, many studies demonstrated farmers' considerable knowledge in categorizing their land and evaluating soil erosion severity, as farmers who observe their fields and experience soil degradation on a daily basis (Boardman 2006, Nigussie et al 2017). Future studies combining local knowledge based on qualitative response and quantitative models (e.g. Universal Soil Loss Equation) could provide a more robust estimation on the magnitude and spatial distribution of soil erosion (Sonneveld et al 2011).
Based on our weak positive correlation between cropland expansion and changes in productivity (figure 6(b)), a tentative interpretation we can draw is that even with cropland degradation, farmers were still establishing new farmlands when land was available, although this weak correlation does not necessarily indicate causality. However, crop expansion ratio is lower in areas with reduced productivity than areas with improved productivity, which might indicate that reduced productivity and soil erosion discourage farming activities considering profitability is a major concern in these land-use decisions (Barbier and Hochard 2018). Moreover, it might be incorrect to simply assume that improving cropland productivity would slow down expansion or even save lands, as we observed a higher expansion ratio in areas with improved productivity in Malawi (figure 6(b)). Even though the main drivers of improved productivity in some districts of Malawi—such as those in the Northern Region—were not fully clear, the enhanced productivity we observed was more strongly related to expansion than intensification, since we found that expanded croplands with younger age showed increased productivity. These findings carries important implications for cropland management and food security policies in SSA countries as cropland degradation and low agricultural intensification level lead to severer food insecurities issues (Sayer and Cassman 2013, Zingore et al 2015).
5. Conclusions
In this study, we quantified and characterized changes in cropland area; evaluated cropland degradation; and finally estimated potentially available cropland for future expansion in Malawi. We found unsustainable cropland use in Malawi, evidenced by a high rate of cropland expansion; a decline in productive cropland indicated by reduced cropland productivity and enhanced soil erosion; and a low potential of available cropland for future expansion. Our findings pointed out the need for further studies on improving cropland detection accuracy using high temporal and spatial resolution satellite data, and understanding the beneficiary of cropland expansion, and quantifying the precise extent and causes of cropland degradation at the field level.
In the context of land-constrained farming system and increasing population pressure on land, our results suggest that actions are critically required to stop uncontrolled cropland expansion and protect cropland from further degradation in order to meet growing food demand (Gibbs et al 2010) in Malawi and also likely in other SSA countries. Sustainable intensification of small-holding farming (Dougill et al 2017) and closing yield gap are still the key to improve food security and slow down expansion. In addition, this study points to the need for strategic land use planning and land management for potentially available cropland identified in this study, to potentially protect these lands for agriculture purposes and for sustainable agricultural intensification.
Acknowledgments
This work was funded through the 'Building REsearch Capacity for sustainable water and food security In drylands of sub-saharan Africa' (BRECcIA) which is supported by UK Research and Innovation as part of the Global Challenges Research Fund, Grant Numbers NE/P021093/1.
Data availability statement
Satellite data Landsat-8 and Sentinel-2; Global Forest Change dataset (Hansen et al 2013); the Global Surface Water dataset (Pekel et al 2016); The Shuttle Radar Topography Mission (SRTM, see Farr et al 2007) digital elevation data, MOD13Q1 Vegetation Index products, MCD12Q1 land cover product and WorldPop population dataset were accessed and processed through Google Earth Engine platform (https://developers.google.com/earth-engine/datasets/catalog).
Globeland30 Land cover dataset were accessed through http://www.globallandcover.com/home_en.html Malawi protected area (MASDAP 2013) were accessed through Malawi Spatial Data Platform (MASDAP) http://www.masdap.mw/layers/geonode:protected_areas. OpenStreetMap road network data were accessed through https://download.geofabrik.de/africa.html. River network data were accessed through World WildLife Fund (WWF) HydroSHEDS website https://www.hydrosheds.org/downloads.
The Malawi Land Cover dataset in 2019 generated in this study is available upon reasonable request from the authors.