

Abstract
This study finds a significant negative correlation between the December–February mean surface temperature (Ts_DJF) and the following June–August mean surface temperature (Ts_JJA) in South Korea for the period 1991–2017. This indicates that colder winters tend to precede hotter summers with extreme seasonality, while mild winters generally precede mild summers. This winter-to-summer association can be attributed to persistent atmospheric circulation anomalies on the Eurasian continent during the preceding winter and spring characterized by cyclonic circulations in Europe and East Asia and anti-cyclonic circulation in the Arctic regions. Resembling a negative Arctic Oscillation (AO) pattern combined with a negative Polar/Eurasia (PE) pattern, these atmospheric patterns tend to cause colder winters in South Korea and to increase the springtime sea surface temperatures in the western tropical Pacific (WTP) and in the North Atlantic (tripole pattern, NATRI). High WTP and NATRI values induce summertime anti-cyclonic circulations and then hotter summers in Korea with different pathways, the former via northward Rossby wave propagation in response to strong convection over a warm Philippine Sea and the latter via both extratropical Rossby wave propagation from the North Atlantic to East Asia and tropical connections from the tropical Atlantic to the Indian Ocean and then increased summer precipitation in South Asia. Under the opposite conditions (e.g. positive AO and PE phases in winter and negative WTP and NATRI), mild summers are preceded by mild winters. Since the early 1990s, the aforementioned atmospheric circulation anomalies during winter have shown greater persistence, creating the negative correlation between Ts_DJF and Ts_JJA. These findings provide useful information for the long-lead prediction of summer temperatures and heat waves in South Korea.
Export citation and abstract BibTeX RIS

Original content from this work may be used under the terms of the Creative Commons Attribution 4.0 license. Any further distribution of this work must maintain attribution to the author(s) and the title of the work, journal citation and DOI.
1. Introduction
Extremely cold winters and hot summers, which are marked by extreme temperature events such as cold surges and heat waves, can cause significant social and economic damage and represent a threat to human life (Lesk et al 2016, Mitchell et al 2016, Wenz and Levermann 2016). In South Korea, hot summers and heat waves occur more frequently under global warming (Min et al 2015, Lee and Lee 2016, Hong et al 2018, Yeo et al 2019), while the characteristics of cold surges (e.g. a temperature drop of more than 10° C in one day) have not changed despite significant winter warming in South Korea (Park et al 2011, Kim et al 2014).
Previous studies on the variability in the winter temperatures and cold surges in South Korea have highlighted the significant role of tropical conditions, such as the El Niño–Southern Oscillation (ENSO) and sea-surface temperatures (SSTs) in the western tropical Pacific (WTP), and extratropical conditions, such as the Arctic Oscillation (AO) and Arctic sea ice concentration. For the ENSO, it has been suggested that cold winters in Korea occur during La Niña, while warm winters are associated with El Niño. This is because, during La Niña winters, strong convection in the warm WTP tends to lead to cyclonic circulations in South Korea (Kug et al 2010, Yeo et al 2018). In terms of extratropical conditions, under negative phases of the AO, an enhancement of Siberian High and downstream development of cyclonic circulations in the northwest of East Asia are considered to be responsible for cold winters in Korea. It is because the cyclonic circulations tend to cause cold wind advection by northwesterly winds and less shortwave radiation by increased cloud cover (Gong et al 2001, Jeong and Ho 2005, Cohen and Jones 2011, Kim et al 2014, Chen et al 2016, Park and Ahn 2016). During recent decades, extremely cold winters and notable cold surge events in South Korea have been attributed to warm Arctic and cold Eurasia phenomena, which is referred to as WACE (Honda et al 2009, Jeong et al 2011, Kug et al 2015). The WACE pattern features stronger latent heat release over the warm Barents Sea and then downstream development of the Siberian High and cyclonic circulations in East Asia, which are responsible for severely cold winters in South Korea.
A large volume of research on summer temperature variability and heat wave characteristics in South Korea has been conducted. One of the direct and primary causes of hot summers and extreme heat waves is the presence of summertime upper-level barotropic anti-cyclonic circulations in East Asia. The anti-cyclonic circulations are thought to be caused by various dynamical processes, including (a) strong convection in the WTP via Pacific–Japan teleconnection patterns (Nitta 1987, Kosaka and Nakamura 2006, Lee and Lee 2016, Lim and Seo 2019), (b) barotropic Rossby wave propagations from the North Atlantic to East Asia (Wu et al 2009, 2010, Seo et al 2012, Gao et al 2018, Yeo et al 2019), and (c) circumglobal teleconnection (CGT) patterns induced by strong convection and diabatic heating in the northwestern India and then wave propagation along the mid-latitude wave guide (Wu 2002, Wu and Wang 2002, Ding and Wang 2005, Kim et al 2019 ). In particular, the CGT pattern is responsible for long-lasting anti-cyclonic circulations over South Korea and has been associated with the extreme heat wave events in the summers of 1994 and 2018 (Kim et al 2019, Kornhuber et al 2019).
Though many studies have focused on temperature variability and/or extreme temperature events during winter or summer, very few have considered the possible links between summer temperatures and those of the previous winter (Qiao et al 2015, Chen et al 2020b). Several studies have recently suggested that winter atmospheric conditions persist until spring, which can affect the subsequent summer atmospheric circulations in East Asia with a long temporal lag of up to six months. For example, winter variability of the AO or the North Atlantic Oscillation (NAO) can affect summertime atmospheric circulations in East Asia, affecting the East Asian Monsoon (Sung et al 2006, Chen et al 2018, Qiao et al 2018). These delayed impacts may involve long-memory processes related to SSTs, Arctic sea ice, snow cover, and soil moisture (Huang et al 1998, Qian and Saunders 2003, Ogi et al 2004, Zuo et al 2013, Chen et al 2018, 2020a, Wu and Chen 2020).
The purpose of this study is to examine whether temperature variability in winter is linked to that in the subsequent summer in South Korea. The underlying mechanisms responsible for any link found are then investigated by comparing large-scale circulations related to winter temperature variability to those related to summer temperature variability. This study focuses on the impacts of springtime SSTs in linking winter-to-summer temperatures, especially in the WTP and the North Atlantic.
2. Data and methods
This study uses daily mean and maximum temperature records from 45 Automated Synoptic Observing System stations obtained from the Korea Meteorological Administration from 1974 to 2017. These data are employed to calculate the winter (December–February, DJF) temperature index (Ts_DJF), which is the DJF-averaged temperature divided by 1 standard deviation (σ) for the 43 years (1975–2017). The summer (June–August, JJA) temperature index (Ts_JJA) is also calculated in the same manner. Note that the σ of the DJF-averaged temperature (1.16) is higher than that of the JJA-averaged temperature (0.79). The number of heat wave days in JJA (HWDs_JJA) is calculated for each month and each station as the number of days for which the daily maximum temperature is higher than the 90th percentile for the 1981–2010 period, and this is averaged over the 45 stations.
For the atmospheric variables, this study uses geopotential height at 200 and 850 hPa (HGT200 and HGT850, respectively), zonal and meridional winds at 850 hPa (UWD850 and VWD850, respectively), vertical motion at 500 hPa (OMG500), 2 m surface temperatures (T2m), and net shortwave radiation at the surface from the National Centers for Environmental Prediction–National Center for Atmospheric Research reanalysis (R1; Kalnay et al 1996) at a resolution of 2.5° × 2.5°. Surface variables such as net shortwave radiation (netSWR) and net latent heat flux (netLHF) are also obtained from R1. This study uses temperature and precipitation data from the Climate Research Unit. The SSTs are obtained from the SST Extended Version 5 (2° × 2°) from the National Oceanic and Atmospheric Administration (NOAA). Outgoing longwave radiation (OLR) at the top of the atmosphere is of the monthly interpolated OLR data (2.5° × 2.5°) of NOAA.
For oceanic and atmospheric indices, monthly values for NINO3.4, the AO, and the Polar/Eurasia (PE) teleconnection are provided by the NOAA Climate Prediction Center archives (http://www.esrl.noaa.gov/psd/data/correlation/). As the first leading empirical orthogonal function mode of sea level pressure variability, a positive AO pattern is characterized by a negative anomaly center over the Arctic region and two positive anomaly centers over the extratropical North Pacific and the extratropical North Atlantic (Thomson and Wallace 1998). A positive PE pattern also has a pole-to-extratropics contrast but displays a primary positive and negative anomaly center over the East Siberian Sea and over Mongolia and the northeastern China, respectively, with a secondary positive anomaly center over the subtropical western Pacific ('Northern Asian Pattern' in Barnston and Livezey 1987).
Due to the climate shift during the 1990s in the regional weather conditions in Korea (Kwon et al 2005, Xiang and Wang 2013, Chen and Zhou 2014, Choi et al 2017, Lim and Seo 2019), the primary research period is the 27 years from 1991 to 2017. The 1975–1990 period is also examined for comparison. The years mentioned in the present study refer to the year in which the summer falls.
In the linear correlation analysis, coefficients are calculated both before and after removing the long-term linear trends for each variable. Due to the negligible differences in the results of these two calculation approaches, only the results for the detrended coefficients are presented in this paper. Statistical significance for the composite analyses is tested using the bootstrap resampling technique by repeating 1000-time random selections without replacement (Gershunov and Barnett 1998).
3. Results and discussion
3.1. Link between winter and summer temperatures
Figure 1(a) presents the time series for Ts_DJF (blue line) and Ts_JJA (red line). It can be seen that the Ts_DJF has become increasingly inversely correlated with Ts_JJA, with the 21 year sliding correlation between Ts_DJF and Ts_JJA becoming more negative over time (figure 1(b)). The strongest correlation is −0.55 for the period of 1995–2015, and the most recent correlation (1997–2017) is −0.49, which are statistically significant at a 95% confidence level. Scatter plots between Ts_DJF and Ts_JJA for the first 21 year period (1975–1995) and the second 21 year period (1995–2015) clearly show a stronger relationship in the latter period (figures 1(c) and (d), respectively). Therefore, this study determines the temperature difference between summer and the previous winter (SWTD = Ts_JJA–Ts_DJF), with positive values indicating hotter summers following colder winters, as seen in 2013, and negative values indicating cooler summers following warmer winters, such as in 1993. Note that the long-term trend in the SWTD is negligible due to the positive long-term trends for both Ts_DJF and Ts_JJA (0.26 °C and 0.29 °C per decade, respectively).

Figure 1. (a) Time series for the normalized indices of the winter mean temperature (Ts_DJF, blue line), summer temperature (Ts_JJA, red line), and their difference (SWTD = Ts_JJA—Ts_DJF, black line) in South Korea from 1975 to 2017 and (b) the 21 year sliding correlation between Ts_DJF and Ts_JJA. (c) and (d) Scatter plot of Ts_DJF (x-axis) vs. Ts_JJA (y-axis) for 1975–1995 and 1995–2015, respectively. The long-dashed line in (b) indicates statistical significance at the 95% level.
Download figure:
Standard image High-resolution image3.2. Large-scale circulation patterns related to the SWTD
In order to identify the large-scale circulations responsible for temperature variability in South Korea, interannual correlations (1991–2017) are computed between the temperature indices (Ts_DJF, Ts_JJA, and the SWTD) and seasonally averaged atmospheric variables (HGT200, HGT850, and T2m). Wind vectors regressed on the SWTD are also calculated. It is noteworthy that the spatial patterns of the correlations for Ts_DJF (supplementary figure 1 (available online at stacks.iop.org/ERL/16/084014/mmedia)) are the inverse of those for Ts_JJA (supplementary figure 2) and, consequently, of those for the SWTD (figure 2). Therefore, this study only focuses on the results for the SWTD in this section.

Figure 2. Correlations of the SWTD with (a) HGT200, (b) HGT850, and (c) T2m with regressed winds at 850 hPa in DJF for 1991–2017. (d)–(f) Present the same correlations in MAM and (g)–(i) in JJA. Statistical significance at the 95% level is indicated by dots.
Download figure:
Standard image High-resolution imageFigure 2(a) shows that the SWTD has a strong negative correlation in winter with the 200 hPa geopotential height in Europe and East Asia and, to the north, strong positive correlations in the northern Russia and Arctic regions. Having a barotropic structure over the north of 30° N, this south–north contrast in the correlations is more obvious at 850 hPa (figure 2(b)) and is analogous to the WACE pattern (Honda et al 2009, Jeong et al 2011, Kug et al 2015). These spatial correlation patterns suggest that a high SWTD in South Korea is associated with a warm Arctic and cold mid-latitudes, including East Asia. This speculation is supported by the strong negative correlation with T2m observed in East Asia (figure 2(c)). Meanwhile, connections of the SWTD in tropics are strong as well; strong negative correlations with HGT850 prevail over the Indian Ocean and the western Pacific while positive correlations with HGT200 are found in the southern China. The tropical connections are crucial in modulating SSTs in the WTP (see section 3.3.1).
Although the strength of the correlations is slightly weaker, the correlation patterns in DJF remain unchanged in March–May (MAM) (figures 2(d)–(f)) especially over the mid- and high-latitude regions, with the south–north contrast in the geopotential height correlations and cold surface temperatures associated with the cyclonic circulations in East Asia.
However, in JJA (figures 2(g)–(i)), the correlation patterns suddenly change; the correlation with the geopotential height in northern Europe and the Korean Peninsula shift from negative to positive (i.e. anti-cyclonic circulations) at both the upper and lower levels, which results in positive correlations with the surface temperatures in South Korea. This is interesting because the cyclonic circulations and lower surface temperatures have been dominant in South Korea up until spring.
During summer, barotropic anomalies prevail in the mid- to high-latitude regions (north of 45° N), i.e. anti-cyclonic circulations over the North Atlantic mid-latitudes, the Ural Mountains, the Korean Peninsula, and the Bering Sea versus cyclonic circulations over the north-central Russia and the central North Pacific, resembling the barotropic wave propagations from North Atlantic to East Asia/Pacific. To the south, suggesting baroclinic anomalies, low-level cyclonic circulations are dominant in the Indian Ocean and the WTP, while upper-level anti-cyclonic circulations are prevalent in the mid-latitude regions from the Middle East to East Asia. These abrupt changes in the regional circulations between the previous cold seasons (DJF and MAM) and the following summer (JJA) eventually contribute to low Ts_DJF, high Ts_JJA, and high SWTDs.
3.3. Pathways for the winter-to-summer temperature link
SSTs are one of the most important variables that remotely affect the atmosphere, with a relatively long memory compared to the atmosphere (Lau et al 2000, Watanabe and Kimoto 2000). Figure 3 displays the correlation between the SWTD and SST in MAM with the regressed winds at 850 hPa against the SWTD. In the analysis for this section, the year of 1994 is ignored because the upper-level wave patterns in the summer of 1994 (i.e. exceptionally strong and long-lasting CGT) are extraordinary (see section 4 for details).

Figure 3. Correlations between the SWTD and SST with regressed winds at 850 hPa in MAM for 1991–2017, excluding 1994. Statistical significance at the 95% level is indicated by dots.
Download figure:
Standard image High-resolution imageSignificantly strong correlations are observed in the North Atlantic and Pacific regions. Two SST indices are considered in this paper due to their strong correlation with the SWTD and to the fact that their effects on summer temperatures and heat waves in South Korea have been previously reported (Lee and Lee 2016, Lim and Seo 2019, Yeo et al 2019). The first is the North Atlantic tripole index (NATRI), which is defined as A + C − B, where A, B, and C refer to the SST averages in MAM indicated in the corresponding boxes in figure 3 (45° N–55° N, 45° W–60° W for A; 27.5° N–42.5° N, 45° W–60° W for B; and 12.5° N–25° N, 15° W–50° W for C, respectively). The NATRI index is composed of the tropical part (=C) and extratropical part (=A − B). The other is the WTP index, which consists of the MAM-mean SST averages in box D in the WTP (0° N–20° N, 120° E–140° E).
As shown in table 1, both the NATRI and the WTP index are negatively correlated with Ts_DJF and positively correlated with Ts_JJA and the SWTD. The NATRI and WTP seem to affect not only the mean summer temperatures but also frequency of extreme heat events (HWD_JJA). These correlations are all statistically significant at the 90% level when the year of 1994 is excluded.
Table 1. Correlations between temperature indices (Ts_DJF, Ts_JJA, SWTD, and HWD_JJA) and spring SST indices (NATRI and WTP) for 1991–2017 except 1994. The significance of the correlations is indicated by an asterisk (* = 90% confidence level; ** = 95% confidence level). Correlations for all years with 1994 included are presented in the parentheses.
| Ts_DJF | Ts_JJA | SWTD | HWD_JJA | |
|---|---|---|---|---|
| NATRI | −0.41** (−0.39**) | 0.48** (0.23) | 0.52** (0.36*) | 0.33* (0.03) |
| WTP | −0.36* (−0.14) | 0.33* (0.47**) | 0.57** (0.38**) | 0.43** (0.46**) |
Below, this study examines how these SST indices are associated with previous winter circulations in Eurasia and winter temperatures in South Korea (Ts_DJF) and how they affect subsequent summer circulations in East Asia, summer temperatures in South Korea (Ts_JJA), and the SWTD.
3.3.1. North Atlantic tripole (NATRI) SST
The positive SWTD–NATRI correlation in table 1 indicates a tripole SST pattern in the North Atlantic (warm subtropics, cold mid-latitudes, and warm high-latitudes) in MAM (figure 3) when the SWTD is high. This SST correlation pattern is also found in DJF (not shown) but is more pronounced in MAM. An analogous correlation pattern is also observed in the correlation with HGT200 and with HGT850 in MAM (figures 2(d) and (e)). These results suggest that the tripole SST correlation pattern can be attributed to barotropic atmospheric circulations (Cayan 1992, Wu et al 2009, Chen et al 2018, Qiao et al 2018). For example, negative correlation regions for HGT850 (i.e. cyclonic circulations) correspond to negative (i.e. cold) correlations for the SST in the mid-latitude North Atlantic regions, which is due to (a) enhanced latent heat flux and cooling in the mid-latitudes (between 30° N and 45° N) due to stronger westerlies and (b) weaker north-easterly trade winds and thus warming in the tropics (lower than 25° N) due to reduced upwelling (Cayan 1992, Wu et al 2009). These results indicate that the springtime NATRI SST pattern develops with the persistent winter-to-spring geopotential height anomalies of the atmosphere, which is consistent with the findings of other studies (Chen et al 2018, Qiao et al 2018).
In turn, the NATRI can affect the atmospheric variability in East Asia in the subsequent summer via tropical and extratropical pathways. For the tropical pathways, many studies have recently reported the impacts of the tropical Atlantic on the tropical Pacific via Walker circulation (Keenlyside and Latif 2007, Wang et al 2009, Ding et al 2012, Ham et al 2013) and then on summer precipitation in South Asia (Qiao et al 2018). Their findings are analogous to the results of the correlations of the tropical part of the NATRI (=C) in figure 4. The figure shows that enhanced convection over the warm tropical North Atlantic during MAM tends to induce upward motion (figures 4(a) and (b)). In response, downward motion prevails in the tropical and subtropical Pacific during JJA (figure 4(b)) and then low-level easterlies are enhanced in the WTP (figure 4(d)). As a result, SSTs decrease in the central/eastern tropical Pacific and increase in the WTP (figure 4(f)), resembling a La Niña pattern. Due to this La Niña-like condition, cyclonic circulations become dominant in the Indian Ocean (figure 4(d)), and precipitation increases in South Asia such as India and the western Indochina Peninsula (figure 4(h)). The increased precipitation in the South Asia can enhance upper-level anti-cyclonic circulations in the north of India and East Asia in JJA (figure 4(j)) (Ge et al 2017, Qiao et al 2018).

Figure 4. Correlations of the tropical part (Box C in figure 3) of the NATRI SST index with (a) OMG500, (c) HGT850 with regressed winds, (e) SST, (g) precipitation, and (i) HGT200 in MAM for 1991–2017. (b), (d), (f), (h), and (j) show the same correlations in JJA. Statistical significance at the 95% level is shown by dots except in (g) and (h). In (g) and (h), statistical significance at the 95% level is shown by black solid lines.
Download figure:
Standard image High-resolution imageFor the extratropical pathways, large amount of previous studies have reported atmospheric teleconnections from the North Atlantic to East Asia (Wu et al 2009, Seo et al 2012, Gao et al 2018, Yeo et al 2019). For example, in their observational and modeling study, Lim and Seo (2019) showed that a warm New Foundland Basin and cool extratropics in spring tend to cause summertime heat waves in South Korea via Rossby wave propagation over the Eurasia continent and the development of barotropic anti-cyclonic circulations in East Asia. Their findings are consistent to the results of the correlations of the extratropical part of NATRI (=A − B) with HGT200 and with HGT850 during JJA (figures 5(c) and (d), respectively). The correlation pattern in the mid- and high-latitudes remains almost the same even if the dependency of (A − B) on C is removed from (A − B) by a linear regression (not shown).

Figure 5. Correlations of the extratropical part (Box A minus Box B in figure 3) of the NATRI SST index with (a) HGT200 and (b) HGT850 with regressed winds in MAM for 1991–2017. (c) and (d) Show the same correlations in JJA. Statistical significance at the 95% level is shown by dots.
Download figure:
Standard image High-resolution imageSupporting the speculations of the tropical and extratropical pathways, figure 6 displays the correlations of the NATRI. For HGT200, a tripole correlation pattern in the North Atlantic and a south–north correlation contrast between the mid-latitudes and the Arctic regions are observed in MAM (figure 6(a)). In JJA (figure 6(d)), the positive and negative correlation regions occur from the North Atlantic to East Asia, i.e. positive in the New Foundland Basin, the Ural Mountains (HGT200_UM), East Asia (HGT200_EA), and the Bering Sea and negative in Western Europe and central Russia, resembling the west-to-east wave propagation in figures 2(g) and 5(c). These results support the extratropical pathways.

Figure 6. Correlations of the NATRI SST index with (a) HGT200, (b) HGT850, and (c) SST (blue-red shading) and precipitation (brown-green shading) with regressed winds at 850 hPa in MAM for 1991–2017. (d)–(f) Show the same correlations in JJA. Statistical significance at the 95% level is shown by dots in (a), (b), (d) and (e) and by black solid lines in (c) and (f).
Download figure:
Standard image High-resolution imageFor the tropical pathways, when the NATRI is high, cooling in the central tropical Pacific is enhanced in JJA (not shown but the same in figure 4(f)) and easterlies develop in the tropical western Pacific (UWD850_WP in figure 6(f)). Cyclonic circulations then arise in the Indian Ocean and the adjacent regions in JJA (HGT850_SA in figure 6(e)). This increases precipitation in the South Asia (PRCP_SA in figure 6(f)), which appears to be responsible for the enhanced South Asian High (75° E–120° E and 30° N–40° N) and anti-cyclonic circulations in Korea at 200 hPa (figure 6(d)).
These extratropical and tropical pathways are also supported by the similarity of the lagged correlations for Ts_JJA to those for the NATRI with the key variables described in table 2. For each key variable, the 3 month sliding average for January–March to JJA is calculated first and then correlated with Ts_JJA. They are also correlated with the NATRI as a comparison. For Ts_JJA (figure 7(a)), the correlation with HGT200_EA is negative in MAM, but positive after May–July (MJJ), increasing rising to 0.7 in JJA. This is associated with the dramatic change in the circulation pattern from cyclonic in MAM (figures 2(d) and 6(a)) to anti-cyclonic in JJA in East Asia (figures 2(g) and 6(d)). The correlation with HGT200_UM also increases from MAM to JJA but this happens earlier than that of HGT200_EA, implying west-to-east wave propagations from the North Atlantic to East Asia.

Figure 7. Correlations of Ts_JJA with the 3 month running average (from MAM, to JJA) of the key variables defined in table 2: (a) HGT200_EA (red line) and HGT200_UM (blue line) and (b) PRCP_SA (blue line), HGT850_SA (red line), and UWD850_WP (orange line), (c) and (d) are the same correlations for the North Atlantic SST tripole index (NATRI) instead of Ts_JJA. The dashed lines indicate statistical significance at the 95% level.
Download figure:
Standard image High-resolution imageTable 2. Key variables representing primary pathways for the winter-to-summer temperature link. Each of these areas is shown in the form of a box in figures 4 and 6.
| Name | Variable | Longitude | Latitude |
|---|---|---|---|
| HGT200_EA | HGT200 | 120° E–150° E | 30° N–45° N |
| HGT200_UM | HGT200 | 30° E–60° E | 47.5° N–65° N |
| UWD850_WP | UWD850 | 135° E–160°E | 2.5° S–2.5° N |
| HGT850_SA | HGT850 | 50° E–110° E | 0° N–25° N |
| PRCP_SA | PRCP | 70° E–115°E | 15° N–25° N |
| OMG500_EA | OMG500 | 110° E–140° E | 27.5° N–32.5° N |
| OLR_WTP | OLR | 110° E–130° E | 0° N–20° N |
| SST_WTP | SST | 120° E–140° E | 0° N–20° N |
Similarly, in the tropics (figure 7(c)), Ts_JJA is negatively correlated with UWD850_WP (i.e. easterlies) and with HGT850_SA (i.e. cyclonic circulations) since MAM. In addition, it is strongly positively correlated with PRCP_SA in JJA. These correlation results represent tropical pathways (i.e. upward motion in the tropical North Atlantic, downward motion in the tropical Pacific, easterlies in the tropical western Pacific, cyclonic circulations in the Indian Ocean, increased precipitation in South Asia, and northward development of anti-cyclonic circulations). Analogous results are also observed in the correlations for the NATRI (figure 7(d)). Consistent with the speculation above, the results in figure 7 show that the NATRI affects Ts_JJA via both the extratropical and tropical pathways. As shown in table 1, the NATRI is significantly correlated with both Ts_DJF and Ts_JJA, and thus the SWTD, suggesting that it plays an important role in linking winter temperatures to summer temperatures in South Korea.
3.3.2. Western tropical Pacific (WTP) SST
As mentioned above, the SWTD is closely connected with the atmospheric anomalies not only in the mid- and high-latitudes but also in the WTP. Figure 8 displays the correlations of the SWTD with seasonally averaged SST and the surface variables in the WTP region. The positive correlation between the SWTD and the WTP index (table 1) is primarily associated with the wintertime south-easterlies dominant in the southern part of the Philippine Sea and the resulted wind-driven warm water advection (figure 8(a)). The south-easterlies seem to be attributed to 850 hPa low- and high-pressure systems to the west and to the east of the Philippine Sea, respectively (figure 2(b)). This west-to-east pressure contrast and the south-easterlies persist in MAM with slightly reduced intensity (figures 2(e) and 8(b)). In addition, a high WTP is partially due to 1) suppressed convection (not shown) and enhanced downward short-wave radiation in the Philippine Sea (figures 8(d) and 2) relatively low wind speeds and low latent heat fluxes in the northern part of the Philippine Sea as suggested by Qiao et al (2015) (figure 8(g)), although these effects are not statistically significant.

Figure 8. Correlations of SWTD with SST in (a) DJF, (b) MAM, and (c) JJA for 1991–2017. Statistical significance at the 95% level is indicated by white lines, (d)–(f) are the same correlations with net shortwave radiation at surface while (g)–(i) are the same correlations with net latent heat flux at surface. Statistical significance at the 95% level is indicated by dots in (d)–(i).
Download figure:
Standard image High-resolution imageIn MAM and JJA, it is well-known that a warm WTP in spring has a critical influence on summer temperature variability and heat wave frequency in South Korea (Nitta 1987, Lee and Lee 2016, Lim and Seo 2019). Correlations for the WTP index with geopotential height, OLR, and OMG500 are presented in figure 9. In order to examine the ENSO-independent impacts of the WTP, the NINO3.4 dependency is removed from WTP variability using a linear regression. The results show that, when the WTP index is high, convection is weak in the Philippine Sea during MAM (figures 9(c) and (d)) but, during JJA, convection becomes dominant not only there but also in adjacent regions (OLR_WTP figure 9(g)). Compensatory downward motion and suppressed convection then develop northward on the Korean Peninsula (OMG500_EA figure 9(h)) via the northward propagation of Rossby waves. As a result, barotropic anti-cyclonic circulations are observed on the Korean Peninsula and on the southern part of Japan (figures 9(e) and (f)), resembling a Pacific–Japan pattern (Nitta 1987, Kosaka and Nakamura 2006, Lee and Lee 2016, Lim and Seo 2019).

Figure 9. Correlations of the WTP SST index with (a) HGT200, (b) HGT850, (c) OLR, and (d) OMG500 in MAM for 1991–2017. (e)–(h) Present the same correlations in JJA. Statistical significance at the 95% level is indicated by dots.
Download figure:
Standard image High-resolution imageCorrelations of Ts_JJA with SST_WTP, with OMG500_EA, and with OLR_WTP (3 month running mean) are shown in figure 10(a). They illustrate that Ts_JJA is significantly correlated with the SST_WTP from MAM to MJJ, suggesting 2 ∼ 4 months lagged impacts. In JJA, it can be hypothesized that warm SSTs in WTP are maintained by the tropical pathways of NATRI (i.e. a La Nina-like condition and then warm SSTs in the WTP region in summer induced by warm tropical North Atlantic in spring as shown in figure 4(f)). However, the correlation of SST_WTP reduces substantially in JJA. This is most likely because convective activity in the Philippine Sea becomes strong and then SSTs drop in JJA, as the corresponding downward motion in the southern part of East Asia becomes pronounced. Analogous features are also found in the correlations for the WTP (figure 10(b)). Note that the correlations of SST_WTP are identical to the auto-correlations of the WTP index. Table 1 also shows a negative correlation between the WTP index and Ts_DJF and a significant positive correlation between the WTP index and Ts_JJA and the SWTD. The results in figures 9 and 10 and table 1 emphasize the substantial role of the WTP in linking winter temperatures to summer temperatures in South Korea.
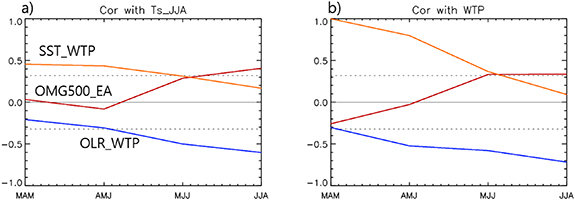
Figure 10. Correlations of Ts_JJA with the 3 month running average (from MAM to JJA) of the key variables defined in table 2: (a) SST_WTP (orange line), OMG500_EA (red line) and OLR_WTP (blue line). (b) Presents the same correlations but for the WTP SST index instead of Ts_JJA. Dashed lines indicate statistical significance at the 95% level.
Download figure:
Standard image High-resolution image3.4. Related atmospheric indices
The results in the previous sections emphasize the importance of wintertime atmospheric anomalies on the Eurasia continent to the winter-to-summer links and SWTD variability. Long-lagged impacts of atmospheric anomalies in the North Atlantic on the Eurasia continent and on tropical Pacific SSTs have been reported by a few studies (Wang et al 2009, 2011, Wang 2019, Chen et al 2020b). In the correlation map between the SWTD and HGT850 in DJF (figure 2(b)), the south-to-north contrast between the mid- and high-latitudes resembles the negative phase of the AO. Therefore, this study examines correlations between the temperature indices, including the SWTD, and various atmospheric indices averaged for DJF. As shown in table 3, all of the temperature indices are significantly correlated with the AO and the PE in DJF (AO_DJF and PE_DJF, respectively) except that between Ts_DJF and PE_DJF. Recently, Myoung (2021) highlighted physical mechanisms of the impacts of PE_DJF on summer circulations in East Asia and on summer temperatures in Korea via springtime SSTs in the western tropical (similar to the WTP). In addition, the impacts of AO_DJF on summer circulations in East Asia via springtime SSTs in the North Atlantic (similar to the NATRI) have been already reported in several studies (Cayan 1992, Wu et al 2009, Otomi et al 2013, Chen et al 2018, Qiao et al 2018) (see section 3.3.1 for more details).
Table 3. Correlations between winter teleconnection indices (AO_DJF and PE_DJF) and both temperature indices (Ts_DJF, Ts_JJA, SWTD, and HWD_JJA) and spring SST indices (the NATRI and WTP index) for 1991–2017 (** = significant at the 95% confidence level).
| Ts_DJF | Ts_JJA | SWTD | HWD_JJA | NATRI | WTP | |
|---|---|---|---|---|---|---|
| AO_DJF | 0.39** | −0.38** | −0.45** | −0.25 | −0.42** | −0.30 |
| PE_DJF | 0.13 | −0.59** | −0.42** | −0.49** | −0.19 | −0.58** |
A composite analysis is conducted for the negative and positive phases of AO_DJF and PE_DJF (table 4 and figures 11 and 12). It is noteworthy that in figures 11(a) and (b), the positive correlations in the East Siberia Sea (90° E–150° E and 65° N–80° N) and in the subtropical western Pacific (90° E–180° E and 0° N–35° N) and the negative correlations in Mongolia and the northeastern China (90° E–150° E and 45° N–60° N) resemble a typical spatial pattern of negative PE phases in winter. In addition, the positive correlations in the Arctic region and the negative correlations in the mid-latitudes of the North Atlantic and North Pacific resemble a typical spatial pattern of negative AO phases.
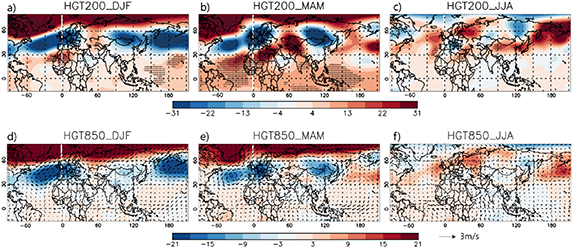
Figure 11. Composite maps of the negative AO_DJF and negative PE_DJF years for HGT200 in (a) DJF, (b) MAM, and (c) JJA. (d)–(f) Display the same data for HGT850 with wind vectors at 850 hPa. Statistical significance at the 95% level is indicated by dots.
Download figure:
Standard image High-resolution image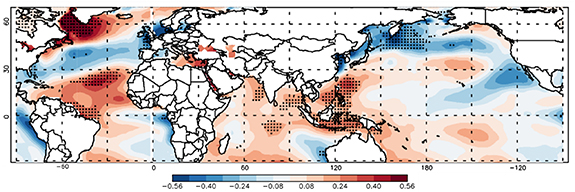
Figure 12. Composite maps of the negative AO_DJF and negative PE_DJF years for SST in MAM. Statistical significance at the 95% level is indicated by dots.
Download figure:
Standard image High-resolution imageTable 4. List of negative and positive composite years for AO_DJF and PE_DJF. The sign for the SWTD is indicated by color (positive in red and negative in blue).
| Negative AO and PE winters | Positive AO and PE winters | |
|---|---|---|
| Years | 2001, 2004, 2006, 2010, 2013, 2016 | 1991,1992, 1993, 1995, 2002, 2009, 2015 |
The negative phase composite maps in figure 11 capture the key features associated with the winter-to-summer temperature link (e.g. the barotropic south-to-north contrast of the geopotential heights in the extratropics and the tripolar geopotential heights in the North Atlantic during DJF and MAM, the west-to-east contrast of HGT850 and the south/south-easterlies in the WTP during DJF and MAM, and the wave propagation in the Eurasia and the anti-cyclonic circulations in East Asia during JJA). These features are consistent to the results of the previous studies mentioned above (Chen et al 2018, Qiao et al 2018, Myoung 2021).
The SST composite map in MAM (figure 12) displays the positive NATRI and WTP pattern, being analogous to the correlation pattern between the SWTD and SSTs (figure 3). Correlation results in table 3 indicate that AO_DJF is significantly correlated with the NATRI but is only marginally so with the WTP index, while PE_DJF is significantly correlated with the WTP index but not with the NATRI. The AO_DJF and the PE_DJF are marginally significantly correlated with each other at the 95% confidence level (r = 0.38 for 1991–2017). These results suggest that AO_DJF and PE_DJF affect Ts_JJA primarily via the NATRI and the WTP, respectively, and that high SWTD years are likely to be associated with negative phases of AO and PE in the previous winter. Supporting the speculations, all six of the negative composite years correspond to a positive SWTD while six of the seven positive composite years correspond to a negative SWTD (table 4). According to Chen et al (2020c), during positive AMO phases, spring AO is tightly coupled with the low-level circulations in the North Atlantic, enhancing the NATRI, but it is weakly coupled in the western Pacific. Their finding is consistent to the significant correlation of AO_DJF with the NATRI but the negligible correlation of AO_DJF with the WTP (table 3).
4. Conclusions
This study finds a significant negative correlation between the mean winter temperature (Ts_DJF) and the subsequent mean summer temperature (Ts_JJA) in South Korea (r= −0.49 after detrending) in recent decades (1991–2017), which causes strong interannual variability in seasonality (SWTD = Ts_JJA–Ts_DJF). In addition, the large-scale circulations associated with Ts_DJF are the inverse of those associated with Ts_JJA, suggesting that the winter-to-summer temperature link is not artificial. The out-of-phase temperature link is observed not only in South Korea but also in the neighboring areas in East Asia (supplementary figure 3).
Possible mechanisms for the winter-to-summer temperature link are summarized in figure 13. When the SWTD is high in a certain year, having a barotropic structure, cyclonic circulations prevail in Europe and East Asia and anti-cyclonic circulations are present in the Arctic regions during DJF, leading to colder winters in South Korea (figures 2(a)–(c)). Resembling negative PE and AO phases (figure 11), these atmospheric conditions persist until MAM, increasing the WTP and the NATRI SST pattern in spring (figure 3). The increased WTP is mainly due to south-easterlies induced by the west-to-east HGT850 contrast in the WTP region (figures 2(b) and 8(a)), while the increased NATRI is primarily due to low-level tripole circulation patterns of the atmosphere and associated wind anomalies (figures 2(e) and (f) and section 3.3.1). The positive values for the WTP index and the NATRI tend to produce anti-cyclonic circulations in JJA and then hotter summers in Korea but with different processes; the former occurs via enhanced downward motion in Korea in response to strong convection over a warm Philippine Sea, resembling Pacific–Japan teleconnection patterns (figures 9 and 10), while the latter is generated by both extratropical Rossby wave propagation from the North Atlantic to East Asia (figures 5–7) and by tropical connections, i.e. Walker circulations between the warm tropical North Atlantic and the cool tropical Pacific, easterlies in the WTP, cyclonic circulations in the northern Indian Ocean, increased precipitation in South Asia, and northward development of anti-cyclonic circulations in Korea, in sequence (figures 4, 6, and 7). The tropical connections may enhance the anti-cyclonic circulations in Korea by increasing the WTP in summer and then enhancing Pacific-Japan patterns (figure 4(f)). The WTP index and the NATRI also affect HWDs in JJA (table 1).

Figure 13. Schematic diagram of the pathway impacts of winter anomalous atmospheric patterns on summer circulations in East Asia, which have been responsible for the strong negative link between Ts_DJF and Ts_JJA in South Korea since the early 1990s.
Download figure:
Standard image High-resolution imageBecause the NATRI and the WTP index are not significantly correlated with each other (r = 0.28 for 1991–2017) when their effects occur concurrently, Ts_JJA increases substantially and so does the SWTD. This coincides with the finding that zonal wave propagations in Eurasia that are responsible for extreme heat waves in South Korea often accompany meridional wave propagation in the western Pacific (Yeo et al 2018). The NATRI-related wave propagation in the Eurasia (figures 5 and 6) differs from the traditional CGT processes as in the summer of 1994 (supplementary figures 4(a) and (b)) that are guided by the mid-latitude westerly jets; As in Ding and Wang (2005) and Kim et al (2019), upper-level anti-cyclones are observed in the northwest of India and in East Asia while lower-level cyclonic circulations inducing precipitation are found in the northwest of India. In addition, the North Atlantic SST anomaly pattern in the spring of 1994 is the opposite of a positive NATRI pattern (supplementary figure 4(c)). Therefore, the correlation between the NATRI and Ts_JJA decreases when the year of 1994 is included (table 1 and supplementary figure 5(a)). This is why the year of 1994 is neglected in the analyses in section 3.3. In the future, the different wave propagation paths from North Atlantic to East Asia depending on positive and negative NATRI values will be investigated more deeply. Meanwhile, the WTP index is still significantly correlated with Ts_JJA even when 1994 is included (table 1 and supplementary figure 5(b)).
The anti-correlation between Ts_DJF and Ts_JJA is obvious after the 1990s, showing a decadal change. Before the 1990s (1975–1990), most of the correlation coefficients between the seasonal temperatures and the SST indices are not statistically significant except between Ts_JJA and the WTP (table 5). The strong link since the early 1990s can be attributed to the higher persistency of atmospheric anomalies in winter (i.e. warm Arctic vs. cold Europe and East Asia) and their connections to springtime SST variability over the North Atlantic and the WTP (Cayan 1992, Wu et al 2006, Chen et al 2018). This feature is also manifested in the changes to the characteristics of the DJF-averaged AO (Qiao et al 2018) and PE. The auto-correlation results presented in figure 14 find that the significant positive correlations for both AO_DJF and PE_DJF have tended to be maintained until MAM over recent decades (1995–2015), which was not the case previously (1975–1995). Although some studies have emphasized the role of higher mid-latitude snow cover associated with Arctic warming and stronger land-atmospheric feedback (Zhang et al 2017, Luo and Wang 2018, Chen et al 2020a), more research is required to identify the reasons for the higher persistency of wintertime atmospheric circulation anomalies.

Figure 14. Auto-correlation of (a) AO_DJF and (b) PE_DJF for 1995–2015 (solid line) and 1975–1995 (dashed line). The horizontal dashed lines indicate statistical significance at the 95% level.
Download figure:
Standard image High-resolution image
Table 5. Correlations between temperature indices (Ts_DJF and Ts_JJA) and spring SST indices (NATRI and WTP) for 1975–1990. The significance of the correlations is indicated by an asterisk (* = 90% confidence level).
| Ts_DJF | Ts_JJA | |
|---|---|---|
| NATRI | −0.39 | 0.22 |
| WTP | −0.14 | 0.47* |
The SWTD is weakly correlated with ENSO indices such as NINO3.4 (r = −0.25 for 1991–2017). In particular, although DJF-mean NINO3.4 is significantly correlated with Ts_DJF (r = 0.43 for 1991–2017), it is weakly correlated with Ts_JJA (r = −0.03 for 1991–2017). This suggests that the winter-to-summer temperature link does not arise from forcings related to ENSO variability during the research period of the present study.
The results of the present study suggest that winter atmospheric variability in Eurasia can affect summer temperatures in South Korea by modulating SSTs in the North Atlantic and in the WTP in spring, providing useful information for the prediction of summer temperatures and extreme temperature events in South Korea.
Acknowledgments
This research was supported by the APEC Climate Center.
Data availability statement
The data that support the findings of this study are available upon reasonable request from the authors.