

Abstract
With a global pollinator crisis brewing, it is urgent that we preserve forests supporting wild bees and the services they provide, even in context where agricultural expansion is unavoidable. Though the maintenance of pollination services are known to be synergistic with biodiversity conservation and agricultural economic development, there are few decision support tools that explicitly show how to balance these competing objectives. We developed a novel, spatially explicit method that includes pollination supply, flow, demand, and benefits into an agricultural expansion context to improve land use decisions for agricultural outcomes that minimize environmental impacts. We provide the first study showing the trade-offs between yields and forest retention that uses all the components of pollination services across five planning scenarios (i.e. (a) baseline, (b) absence of pollinators, (c) pollinators present, (d) pollination and non-aggregated forest, (e) pollination and aggregated forest) using data on coffee from Costa Rica. The scenario that showed the highest trade-offs was when pollination services are considered unimportant, which led to a decrease on average yields (∼−23% compared to baseline), whilst also decimating remaining forest (−100% compared to baseline). Better forest retention was achieved in a scenario where pollination services were considered and more forest aggregation was required. In this case, total production incremented by ∼29% while ∼74% of forest patches were preserved. The flexibility of our framework allows adaptation to any crop that benefit from pollination services in different landscape contexts.
Export citation and abstract BibTeX RIS

Original content from this work may be used under the terms of the Creative Commons Attribution 4.0 license. Any further distribution of this work must maintain attribution to the author(s) and the title of the work, journal citation and DOI.
1. Introduction
Animal pollinators play a crucial role in sustainable economic development in many of the world's agricultural regions (Garibaldi et al 2016). Empirical research shows that they contribute to yields in over 60 crops worldwide, with services estimated as 235–577 billion USD globally per year (Lautenbach et al 2012, Potts et al 2016). Despite the importance of pollination services to food production and associated economic returns, the value of these services are rarely considered during the development of land-use plans (Pennington et al 2017). Indeed agricultural expansion is a common land-management approach used to increase yields, an approach that removes quality pollinator habitat, reducing pollinator visitation rates and with that pollination services (Ricketts et al 2008). Conversely, the retention of a mosaic of wild vegetation throughout the agricultural landscape provides nesting sites and year round floral food resources that can lead to retention of pollinator populations (Potts et al 2016), and thus enhanced productivity (Lautenbach et al 2012). For instance, Kennedy et al (2013) found that a mere 10% increase in the quality of bee nesting habitat led to a 36% rise in the abundance and richness of bees across a landscape. Such work highlights the importance of landscape composition for the provisioning of pollination services to agriculture. However, there is little in the way of support for incorporating the complex trade-offs between land for pollinators and land for expanding crops into land management decisions (Breeze et al 2016). Such thinking is the realm of spatial optimization, an approach that can be used to identify zones of importance for economic development as well as cost-effective conservation (Watts et al 2009).
Spatial optimization for ecosystem services requires accounting for all services components (i.e. supply, demand, flow, and benefit) to maximize service provision (Villarreal-Rosas et al 2020). While there is a growing literature and set of tools (e.g. InVest and ARIES) for quantifying these components, there are limited studies utilizing such information to optimize land-use within a landscape (Chan et al 2006, Egoh et al 2014, Verhagen et al 2016, Watson et al 2019). Specifically, no prior study has integrated the movement of pollinators across the landscape (flow) together with the benefits this brings to agriculture (i.e. yield or profit increases) in a spatial optimization context (table S1 (available online at stacks.iop.org/ERL/16/064098/mmedia)). Ignoring these components may lead to prioritization of actions that do not accurately capture the services pollinators provide to surrounding agriculture, and are therefore potentially suboptimal for both agricultural productivity and conservation. Further, trade-offs between the agricultural benefits of pollination services and the area required to protect pollinators cannot be adequately explored without including all components of the service. Failing to explore these trade-offs overlooks the opportunity costs that farmers face when choosing to set aside land for pollination (Rieb et al 2017).
While much research on spatial planning for conservation objectives focuses on natural areas, the management of human-modified landscapes is growing in importance (Williams et al 2020). Many natural landscapes are not under any type of formal environmental protection and they are in the process of being transformed to productive land uses as demand for commodities grow (Bax and Francesconi 2018). Establishing the trade-offs between biodiversity and agricultural development when maximizing economic objectives allows the identification management opportunities and strategies that cause less environmental harm (Williams et al 2020). Therefore, it is also vital to explore techniques for spatial optimization in agricultural expansion contexts.
In this paper we develop the first spatial optimization framework combining agricultural development and the retention of forest in an agricultural landscape that integrates ecological constraints on the flow of pollination services and the potential agricultural benefits (i.e. yield quantification) of these ecological factors to farmers (figure 1). We illustrate a novel method for integrating pollination services into spatial land-use planning in a coffee production landscape in Costa Rica, and highlight the trade-offs between agricultural development and forest retention under different planning scenarios. A focus on coffee, a crop that benefits from wild bee pollination (Bravo-Monroy et al 2015, Saturni et al 2016), brings with it a case study for a crop that is in high demand across the globe but also an agricultural commodity of significant economic importance to the global south (FAO 2015). Our framework can also be easily applied to different crops, for example those that contribute globally to human nutrition and food security, of which many depend to some degree on pollination services to thrive (Chaplin-Kramer et al 2014).
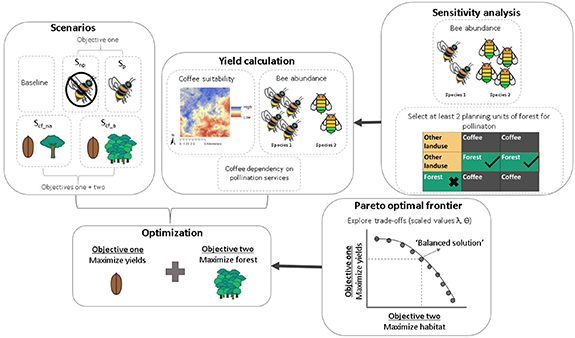
Figure 1. Optimization framework. In the 'Scenarios' box, the five different scenarios are represented (see table 1 for description): baseline (SB), no pollination (Snp), pollination (Sp), coffee and non-aggregated forest (Sch_na), coffee and aggregated forest (Sch_a). In the 'Yield calculation' box, three main components were needed to estimate the yields: (1) coffee suitability map (see section 2 and appendix), (2) abundances for each of the 11 bee species (see table S12) and (3) the coefficient of coffee dependency on pollination services reported to be 0.18 in Costa Rica by Ricketts et al (2004, see section 2). In the 'Optimization' box we want to maximize only coffee yields for scenarios Snp and Sp, or maximize both coffee yields and forest for scenarios Sch_na and Sch_a. In the 'Pareto optimal frontier' box represents the trade-offs between both objectives that comes from the optimization (see section 2). Some scaled values can provide 'intermediate solutions' which are not skewed towards any of the objectives. Finally, the 'Sensitivity analysis' box shows the three variation of key parameters in the model: (1) change in the abundance of the 11 bee species (see section 2), and (2) double the number of planning units of forest that are needed to bring yield increases within the bee foraging range (see section 2). Reproduced from Lopez-Cubillos (2020).
Download figure:
Standard image High-resolution imageTable 1. Different scenarios explored in this study for the objectives of coffee production and forest protection. Reproduced from Lopez-Cubillos (2020).
| Scenario | Description | |
|---|---|---|
| (a) Baseline (SB) | Current landscape where there is no coffee expansion | |
| Objective 1: maximize coffee yields | (b) No pollination: increase yields ignoring pollination services (Snp)
| To maximize yield productivity assuming that pollination services are not important |
(c) Pollination: increase yields considering only pollination services (Sp)
| To maximize yield productivity assuming that there are yield benefits from pollination services | |
| Objective 2: maximize coffee yields and the retention of remaining forest including pollination services | (d) Coffee and non-aggregated forest: increase yields and forest retention (not aggregated) (Sch_na)

| To maximize yield productivity considering pollination services and maximize forest retention but not aggregated |
(e) Coffee and forest aggregation: increase yields forest aggregation with high aggregation value(Sch_a)
| To maximize forest protection but aggregated and achieve yields close to previous scenario |
2. Methods
We chose canton of Tarrazú (province of San José, Costa Rica, figure 2 baseline) as it represents a typical tropical coffee production landscape. Further, being in Costa Rica, where the most pollination ecosystem service studies have been done for coffee, there is superior information with which to populate our models (Ricketts 2004, Ricketts et al 2004, Brosi et al 2008, Lonsdorf et al 2009, Brosi 2009a, Ngo et al 2013). We used land cover maps from the Technological Institutional Repository of Costa Rica (Tec 2014) (see appendix 2). We selected an area of 10 × 10 km from this canton (figure 2, baseline) and divided it into 62 248 square grids (referred here after as 'planning units') to develop our spatial planning framework (figure 1). For each planning unit, we know the general land use type (i.e. coffee, forest or other land use), potential coffee yields and the suitability of the planning unit for coffee production. The majority of our planning units were 1600 m2 (40 × 40 m), with exceptions along the borders (800 m2) and corners (400 m2) of the study area. Although these planning units might be small for forest patches, past studies have shown that small restored patches of land can support wild flowers (i.e. 25 m2) and significantly increase bee richness, abundances, and services to nearby crops (Carvalheiro et al 2012). Furthermore, Brosi et al (2009b) found that Meliponine bee richness (the most common bees in this study) did not decline with decreasing forest size in Costa Rica (forest areas ranging from c. 0.25 ha to c. 230 ha). Additionally, coffee farmers in Costa Rica are predominantly smallholders (Tavares et al 1999, Cole et al 2010) and in this region in particular the average farm size is 2.5 ha (ICAFE 2010); therefore, it is sensible to protect small patches as doing so represents lower opportunity costs.
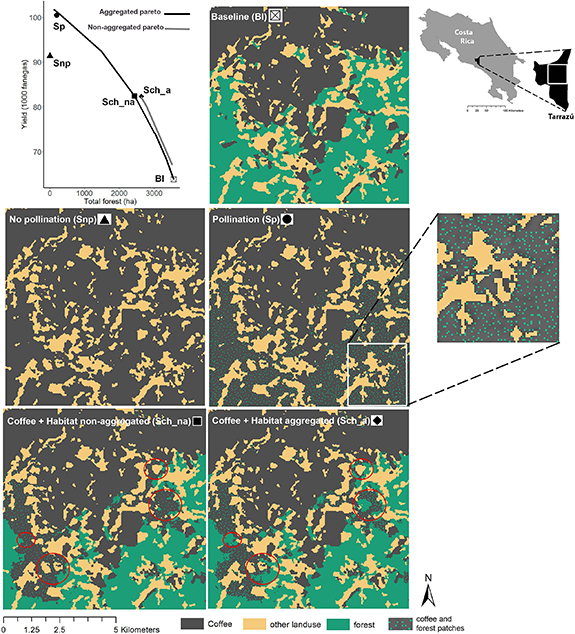
Figure 2. Study site location, land cover and different scenarios for crop expansion into forested areas. The graph represent the yield and forest for the different scenarios. The different shapes on the graph represent the different scenarios: the triangle is crop expansion with no pollination services (Snp), circle is pollination (Sp), square is the 'intermediate solution' for pollination + forest (Sch_na) and diamond is the 'intermediate solution' for pollination + forest aggregation (Sch_a). The gap to optimality for the Sch_na was 0.72% and for the Sch_a was 0.34%. All data represents bee abundances reported by all sources with one planning unit of forest. Red circles highlight the difference of forest between the non-aggregated and aggregated scenario.
Download figure:
Standard image High-resolution image2.1. Pollination supply and yield calculation
We obtained bee richness and abundance data from previous empirical studies made in coffee lands from Costa Rica (see table S12; Ricketts 2004, Ricketts et al 2004, Brosi et al 2008, Lonsdorf et al 2009, Brosi 2009a, Ngo et al 2013). Past studies in the same country have identified remnant forest patches as important sources of insect pollinators and coffee yields decline by approximately 18% when there are low rates of insect pollinator visitation (Ricketts 2004, Ricketts et al 2004). Thus, in order to understand how pollination services are distributed across our focal landscape, we quantified the relationship between forest and crop fields by using a distance decay function. Ricketts (2004) and Lonsdorf et al (2009) found that the probability of pollinator visitation by many bee species decreases according to the distance to the forest, ranging from 0 to 663 m in Costa Rica coffee crops. We classified the potential coffee yield into four categories based on the bees' foraging distances: (a) 'coffee very high'—0–54 m received the highest pollination services because it is adjacent to from forest, (b) 'coffee high'—55–86 m from forest, (c) 'coffee moderate'—87–663 m from forest, and (d) 'coffee low'—633 m which did not receive any pollination services, although it still produces low yields as coffee can self-pollinate (appendix 3, table S12 and figure S2).
We worked with the equation proposed by Ricketts and Lonsdorf (2013) (equation (1)), using bee abundance from multiple sources to calculate yield productivity
In this equation, Yo is the expected yield, Ymax is the maximum yield possible which may vary accordingly with land coffee suitability analysis (appendix 2), vc is the amount of coffee dependence on pollinators, kc is a half-saturation constant and Po is the scaled bee abundance (table S12) in respect to the maximum number of observed individuals in a sampling site.
2.2. Planning scenarios and optimization analysis
The goal of our study was to illustrate how to maximize two contrasting planning objectives: yield production and the retention of forest, when considering pollination services (or not), and explore the implication of protecting pollination services on the optimal landscape configuration (see table 1). As the context of this study is crop expansion, we are starting with the assumption that there is no opportunity to establish new forested areas in these landscapes. On the contrary, for most of the scenarios (except the baseline, figure 2), there will always be crop expansion into forest areas. Furthermore, we locked the 'other land uses' area, which means that coffee cannot expand into these areas and vice versa. From this starting point, we developed five distinct scenarios. The 'baseline' scenario SB, represents the current landscape with no coffee expansion. This scenario is used as a baseline reference from which to compare yield and forest protection outcomes for the other scenarios. The second and third scenarios, Snp and Sp, include one objective only—maximized coffee yields. For the 'no pollination' scenario (Snp), pollination services are assumed to be unimportant and for the 'pollination' scenario (Sp) we assumed pollination services are important. For the pollination scenario and the remaining ones, we maintain a minimum area of forest patch (∼1600 m2 and 3200 m2 for the sensitivity analysis) as important area for bees. The fourth and fifth scenarios, Sch_na and Sch_a, explore the trade-off between two objectives, maximized coffee production and maximized the retention of forest. In the 'coffee and forest non-aggregated' scenario (Sch_na), we allowed for forest retention to occur in a way that did not aggregate forest; for the 'coffee and forest aggregation' scenario (Sch_a) we required forest to meet aggregation criteria (i.e. forest units that are adjacent). For each scenario, we consider the four elements of pollination services: (a) demand—Ricketts (2004) reported that yields decreased approx. 18% without pollination services, (b) supply—it is represented by bee abundance, as they impact estimated yield (see equation (1)), (c) flow—is the flying distance from each bee species, reported by Ricketts (2004), and (d) benefit—is the yield calculation made by the suitability analysis and bee's abundance flying capacity (yield function equation (1), Yo expected yield).
To find optimal landscape configurations for the objectives set in each scenario (table 1), we used integer programming, a land-use decision support tool (Beyer et al 2016, see appendix 4 to see the general form of the problem). The objective function used in the optimization was to either maximize only coffee yields ('no pollination' and 'pollination' scenarios) or maximize both coffee yields and forest retention ('coffee and forest non-aggregated' and 'coffee and forest aggregation' scenarios). Thus, the decision variables was to convert i planning units of forest to a different zone (binary). The constraint used in the optimization was to select at least one planning unit of forest (two planning units for the sensitivity analysis) within 663 m (max. bee's flying distance). We used scaling parameters to vary the importance between forest protection and yield production for both the 'coffee and forest non-aggregated' and 'coffee and forest aggregated' scenarios (pareto frontiers, see figure 1). As the pareto frontier shows multiple solutions, we displayed an example representing an 'intermediate solution' for the last two scenarios, which represents approximately half of the maximum amount of coffee yields that can be obtained when considering pollination services. In addition, we reported coffee outputs in two ways. Firstly, we report coffee total production, which is the total amount of fanegas (dry coffee unit of measurement) on the study area. Secondly, because of the different bee abundances and coffee soils suitability, the yield changed among planning units, thus we also calculated the average yield over the planning units (fanegas/all planning units) to speak to potential impacts on landholders at a more local scale (see figure S2 in appendix 3).
2.3. Sensitivity analysis
As this is a complex problem, conducting a sensitivity analysis on key parameters is essential (Breeze et al 2016). We determined how much model outcomes were impacted by changes in (a) bee abundance and (b) minimum forest area for pollination. Firstly, we explored the variation in yields with different bee abundances. Here, we used the average of bee abundance reported by only one study (Ricketts 2004) instead of using bee abundance average from multiple sources (as per the main results) (Ricketts 2004, Ricketts et al 2004, Lonsdorf et al 2009, Brosi 2009a, Ngo et al 2013). On the other hand, in the main analysis, we set the selection of one planning unit of forest (i.e. 0.16 ha) as a minimum natural area from where bees can travel to pollinate crops. For the second set of sensitivity analysis, we doubled the minimum natural area (i.e. 0.32 ha), as this may be more beneficial for biodiversity (figure 1 and appendix 5).
3. Results
Total coffee production varied substantially among the five tested scenarios; however, the average yield was similar except for the no pollination services scenario (Snp) (table 2). Although ignoring pollination services (Snp) led to high coffee production (43% from the baseline, figure 3(A)), it also led to a 100% conversion of forest to coffee and reduced average yields (−23%, 1.85 ± 0.0031 Snp table 2), representing the lowest average yield across all scenarios. The inclusion of pollination services with a focus still on maximizing only agricultural production (Sp), increased coffee production further, incrementing to 57% above the baseline (figure 3(A)). However, the inclusion of pollinators alone, without explicitly trying to reach forest retention goals, still saw ∼91% of forest being cleared (figures 2 and 3(A)). To achieve better conservation outcomes, forest retention must be explicitly considered as an objective. Even when aggregation is not enforced (Sch_na), we can obtain positive results for both coffee production and forest retention, as small patches of forest are favoured to improve the pollination of crops. In this case, production increased by 29% from the current baseline, and there was less forest clearing, with ∼58% more forest retained than the pollination only scenario (figure 3(A)). Under this scenario forest fragmentation is still seen, which may be an issue for biodiversity (Vetter et al 2011). Conservation outcomes are slightly improved by enhancing forest aggregation (Sch_a, figure 2) with 6% less forest lost from baseline than the non-aggregated scenario (figures 2 and 3(A), table 2). Further, enhancing aggregation (Sch _a) only saw a 0.5% decline in coffee production than what was observed without aggregation and still supported an increase of ∼30% from the baseline (Sch_na). The aggregation scenario also exhibited the highest coffee production per planning unit (∼2.53 ± 0.0032, table 2).
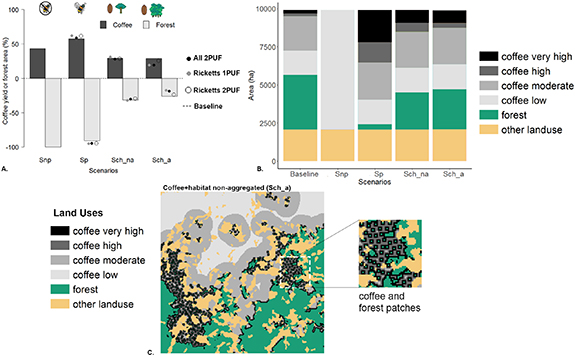
Figure 3. Changes in forest and coffee for the different modelled scenarios. (A) Total changes compared to the baseline (dashed line in x axes at zero). Bars account for data from bee abundances from all sources and one planning unit of forest. The dots represent the sensitivity analysis where black considers the average of bee abundance reported by all sources and two planning units of forest (All 1 PUF). Light grey (Ricketts 1 PUF) and open circle (Ricketts 2 PUF) consider the average of bee abundances reported by Ricketts (2014) and one and two planning unit of forest, respectively. Snp: crop expansion, when pollination services are considered unimportant, Sp: pollination services are considered important, Sch_na: maximizing coffee and non-aggregated forest and Sch_a: maximizing coffee and forest aggregation. (B) Area of the different land uses and coffee zones according to pollination services and land suitability. (C) Map showing the different coffee zones for the coffee and non-aggregated habitat scenario (Sch_a).
Download figure:
Standard image High-resolution image
Table 2. Differences between objectives 1 (coffee production) and 2 (forest protection and coffee production) for all the scenarios. Because the aim was to find an intermediate solution between yield and forest, this table shows the most intermediate scaled values for each sensitivity analysis. Fanega is a unit of measurement typically used for dry coffee in Spanish-speaking countries, PUF = planning units that are forest.
| Objective 1 (coffee) | Objective 2 (forest) | |||||||
|---|---|---|---|---|---|---|---|---|
| Sensitivity analysis | Scenario | Coffee area (ha) | Change area compared to baseline (%) | Total production (1000 fanegas) | Change yield compared to baseline (%) | Yield average and std. error (fanegas/all planning units) | Total forest landscape (ha) | Change forest compared to baseline (%) |
| NA | Baseline | 4265.4 | NA | 63.8 | NA | 2.39 ± 0.003 | 3558.24 | NA |
| No pollination (Snp) | 7823.6 | 83 | 91.3 | 43 | 1.85 ± 0.003 | 0 | −100 | |
| Pollinator abundance reported by all sources + 1PUF | Only pollination (Sp) | 7494.5 | 76 | 100.43 | 57 | 2.13 ± 0.003 | 329.12 | −90.75 |
| Forest non-aggregation (Scf_na) | 5229.3 | 23 | 82.42 | 29.17 | 2.43 ± 0.003 | 2434.08 | −31.59 | |
| Forest aggregation (Scf_a) | 5163.7 | 21 | 82.32 | 29.03 | 2.53 ± 0.003 | 2635.85 | −25.92 | |
| Pollinator abundance reported by all sources + 2PUF | Only pollination (Sp) | 7785 | 83 | 101.43 | 59 | 2.07 ± 0.003 | 41.2 | −98.84 |
| Forest non-aggregation (Scf_na) | 5341.6 | 25 | 81.49 | 28 | 2.43 ± 0.003 | 2482.08 | −30.24 | |
| Forest aggregation (Scf_a) | 4918.7 | 15 | 74.88 | 17 | 2.46 ± 0.003 | 2889.73 | −18.79 | |
| Pollinator abundance reported by Ricketts + 1PUF | Only pollination (Sp) | 7805.8 | 83 | 103.43 | 62 | 2.11 ± 0.003 | 17.84 | −99.5 |
| Forest non-aggregation (Scf_na) | 5424.4 | 27 | 83.57 | 31 | 2.46 ± 0.003 | 2405.17 | −32.41 | |
| Forest aggregation (Scf_a) | 4869.6 | 14 | 75.33 | 18 | 2.11 ± 0.004 | 2939.42 | −17.39 | |
| Pollinator abundance reported by Ricketts + 2PUF | Only pollination (Sp) | 7785.6 | 83 | 103.05 | 61 | 2.10 ± 0.003 | 38.04 | −98.93 |
| Forest non-aggregation (Scf_na) | 5317.9 | 25 | 82.02 | 29 | 2.46 ± 0.003 | 2505.76 | −29.58 | |
| Forest aggregation (Scf_a) | 5105.4 | 20 | 78.66 | 23 | 2.12 ± 0.004 | 2703.69 | −24.02 | |
Accounting for pollination services resulted in different coffee production across the study area (figure 3(C) and figure S5 appendix 7). The scenario that only accounted for pollination services showed more area of coffee with very high coffee production but with a strong impact on forest area (figure 3(B)). Most of the scenarios showed a similar area for coffee with medium production (figure 3(B)), except for the scenario with no pollination services which only had coffee that did not receive pollination services as there is no forest that have bees nearby (figure 3(B)).
3.1. Sensitivity analyses
The sensitivity analyses showed in overall that our results are relatively robust to different types of data available on pollinator dynamics. When using Ricketts' bee abundance data, we found similar results for coffee yield and forest area among scenarios when using data from all sources (figure 3(B), grey and open dots). For the only pollination scenario (Sp) Ricketts' data increased yield values by ∼3% while forest maintenance was fairly similar compared to all sources (table 2). Contrary to this trend, when aggregation was forced (Sch_a) Rickett's data decreased yields values by ∼4% and forest was maintained by ∼5% compared to all sources (table 2).
A similar trend was observed when we set two planning units of forest important for pollinators to be selected within the bee foraging distance (rather than only one planning unit; see section 2, equation S3). Comparing these sensitivity analyses with all sources and one planning unit of forest (black and open dots, figure 3), again, the most sensitive was the only pollination scenario (Sp), resulted in more production for all sensitivity analyses, increasing from ∼1% to ∼3% (table 2). On the other hand, the forest aggregation scenario (Sch_a) resulted in less yield for all the sensitivity analyses, decreasing by ∼1.5%–5% (table 2).
4. Discussion
Finding a harmony between food production and biodiversity conservation is a global priority (Seppelt et al 2016), and ecosystem services could aid in the achievement of these objectives (Bennett 2017). Pollination services have particularly strong potential to support both food production and forest conservation through the integration of these services into planning frameworks. While expansion (i.e. considering pollination services unimportant), a standard agricultural approach to increase production, did increase overall production, but the average yield was the lowest compared to scenarios that consider pollination (table 2). The result of low coffee yield average over the entire landscape illustrates the impacts of pollination services at a more local scale, as it may have profound implications for regional spatial planning, as smallholder farmers represent 84% of the world's agricultural producers (i.e. ⩽2 ha, Lowder et al 2016). With these impacts in mind and the potential gains for conservation, pollination services should be considered when zoning areas for agricultural expansion for pollination-dependent crops, as the trade-offs between forest retention and coffee production decreases when there are pollinators in the landscape because pollination services are enhanced. Furthermore total production in the landscape increased even further when pollination services are incorporated into spatial planning for pollination-dependent crops. Though this conclusion has been suggested previously (Garibaldi et al 2016), our study is the first to quantitatively support existence of these mechanisms spatially and systematically.
It is well known that protecting forests can increase native bee richness and diversity (Saturni et al 2016) and that protecting small forest patches is important for maintaining 'free' pollination services. Our study shows that there are small changes to coffee production from different coffee-forest mosaics compared to monocultural coffee plantations, but the gains on forest retention are much larger in the former. Ultimately, our study shows that a mix of coffee-forest mosaic and larger forested areas can promote intermediate solutions for food production and broader biodiversity conservation goals. This outcome provides support for the idea of a combination of land-sharing and land-sparing for environmental and agricultural planning (Grass et al 2019).
Preserving natural areas within an agricultural mosaic is essential for the protection of native forest species that exist outside of a protected area network (Chazdon et al 2009), and our framework shows that conservation and agri-production can coexist. Indeed, we show that explicitly planning for forest retention as an objective in productive landscapes achieves better outcomes for both coffee and forests. Forcing greater aggregation led to bigger forest patches, which is likely beneficial to fragmentation-sensitive taxa in large landscapes (Smith et al 2011). A degree of forest fragmentation is likely to always exist when pollination is considered a driving service for planning purpose, as forest fragments throughout landscapes likely ensure the widespread provision these services (Mitchell et al 2014). Forest patches that are close to coffee crops may also provide more ecosystem services than just pollination (Karp et al 2013). For example, the coffee berry borer (Hypothenemus hampeii) pest was 50% less abundant in Costa Rican coffee crops grown in landscapes with small patches of forest (i.e. ∼1 ha) that support native bird predator to control this pest on surrounding lands (Karp et al 2013).
While small patches of forest are not ideal for the conservation of all species, such as edge sensitive forest specialists prefer larger patches (Medeiros et al 2019), they can still have extensive conservation value. For example, Rösch et al (2015) found that different taxa (i.e. vascular plants, leafhoppers and true bugs) could survive when many small (<1 ha) and a single large forest fragment (1.5–8 ha) existed within the same landscape, a scenario similar to our aggregation scenario (Sch_a). In addition, scattered trees are useful to many species when located close to forest patches (Prevedello et al 2017), and can act as 'stepping stones' that help in the maintenance of landscape connectivity (Herrera et al 2017).
Our optimization framework incorporates pollination processes that are not typically included in spatial prioritization and thus some assumptions were necessary. We did not consider dynamic interactions among pollinator species and its effect on foraging behaviour. For example, solitary bees have been shown to change to forage on flowers closer to the ground when honey bees were more abundant (Klein et al 2008). We also assume that all the species present will forage up to their species-specific foraging distance, not accounting for travelling cost or variation in resource quality (Nicholson et al 2019). High densities of a wild bee species may increase intraspecific competition (Fontaine et al 2008, Lichtenberg et al 2020), which may in turn lead to nectar robbing (i.e. holes at the base of flowers) (Lichtenberg et al 2020)—a process that either negative (Burkle et al 2007), positive (Burkle et al 2007), or no impact on pollination (Rojas-Nossa et al 2016). Our framework did not account for these aspects of feeding behaviour, which may impact the yield estimation. Finally, we assumed that species composition was maintained in small patches. However species composition can be affected when forest density declines and forest structure is modified (Medeiros et al 2019), which may lead to changes in the provisioning of pollination services. Our sensitivity analysis is still a major step forward, as it approximates the impact of previously omitted ecological details known to be important for bee abundances across landscapes or the size of forest planning units required to deliver pollination services. Varying assumptions on bee abundance showed little change in outcomes; and thus we expect that despite bee population fluctuation, pollination services can be maintained if there is still natural habitat in the landscape (Blaauw and Isaacs 2014). Likewise, there were only minor changes when doubling the minimum amount of forest available within a patch (from 0.16 ha to 0.32 ha). Despite the little changes in forest amount and coffee production, this larger habitat may represent a better patch size for Meliponini bee richness and other species, and have greater general benefits to conservation than 0.16 ha (Brosi et al 2008).
Spatial optimization has been widely used to support decisions with competing objectives (Kennedy et al 2016, Runting et al 2017). Prioritization analysis that accounts for food production and biodiversity show that a balance between both objectives can be met, albeit with trade-offs (Kennedy et al 2016). Pollination services in particular are important ecosystem services to use for spatial prioritization due to the direct link between the natural areas required for the survival of pollinators and crop yields. Using this approach, the trade-offs between these two competing objectives can be explored, allowing decision makers to consider the relative importance of these objectives (Bennett et al 2009, Runting et al 2015, Beyer et al 2016). However, in this study we also used trade-off analysis to identify the intermediate solution that equally consider forest retention and food production. In addition, when planning with ecosystem services, it is necessary to fully account for the supply, demand, flow and benefit of these services, or else we may risk the delivery optimal conservation and agricultural production outcomes. Previous prioritization studies that have considered pollination services omit important elements of how the flow and benefit of ecosystem services are provided. Incorporating flow allows for the preservation of areas that provide nesting resources and increased habitat connectivity, thereby producing positive effects for bee species richness (Bommarco et al 2010). For example Meliponine bees reproductive dispersal is strongly related to proximity of forest (Brosi et al 2008). Including the benefits of pollination services (e.g. yield) can provide a clearer understanding of the risk of losing pollination services all together (Wolff et al 2017) and the impact of pollination on marketable seed yield (Fijen et al 2018). This may influence farmers' decisions about whether to set aside areas for conservation of pollination services, including those focused on profit maximization.
Although implementation challenges remain, the approach we illustrate is an important step towards developing a planning processes that strives for optimal collective outcomes for agricultural productivity and biodiversity protection. Our novel problem formulation allows flexibility in parameter inputs, which can be modified to aid decision making in different contexts. Our results can guide other conservation measurements in other countries and types of landscapes. Another example of how this method can be used is in Brazil, a country were coffee is an important commodity and where pollination services are significant for crop production (Saturni et al 2016). In addition, new bee abundance data can be added or the minimum amount of forest needed to support pollinators can be changed. Our results showed that it is feasible to find intermediate trade-offs for both agricultural production and forest retention when the retention of forest becomes an explicit planning objective. Nevertheless, we are aware that operationalizing prioritization maps in particular socio-political contexts presents some challenge (Lonsdorf et al 2020). Therefore, the spatial output of the optimization should serve as a first step to support decision-making in the planning process (Knight et al 2006).
Acknowledgments
SLC is supported by a doctoral fellowship award from COLCIENCIAS (No. 728), the University of Queensland Research Training program and the high degree research top-up scholarship granted by the Centre of Excellence for Environmental Decisions (CEED). EMM is funded by an ARC Future Fellowship (FT170100140). MMM was funded by an ARC Future Fellowship (FT130100255). We appreciate the help provided by Rubén Venegas-Li with the land use data and Felipe Suárez-Castro with the coffee suitability analysis. We also thank Taylor Ricketts, Rebecca Chaplin-Kramer, and two anonymous reviewers for making comments on an early version of the manuscript.
Data availability statement
The data that support the findings of this study are available upon reasonable request from the authors. DOI: 10.14264/5608182