

Abstract
Water competition between the food and energy sector is a critical component of the food-energy-water nexus. However, few studies have systematically characterized the geospatial and, especially, the sub-annual variations in such competition and the associated environmental impacts and targeted mitigation opportunities. This study characterizes competing water uses for crop-specific irrigated agriculture and fuel-specific power generation across global major river basins to reveal their resulting impacts on local water scarcity for global population under both current and a warming climate. Under annual (and most seasonal) accounting, almost all basins currently suffering from extremely high water scarcity are dominated by agricultural water consumption (e.g. accommodating 26%–49% of basin-total population across seasons), which are often simultaneously exposed to potentially decreasing seasonal water availability under a 4 °C warming scenario. Only 13%–20% of population are located in basins dominated by seasonal power sector water uses, which are predominantly with low water scarcity. Agriculture sector provides the most basin-specific water mitigation opportunities across mid-latitude basins in all four seasons. Nevertheless, power sector becomes more important in affecting seasonal water scarcity and provides unique seasonal water mitigation opportunities, particularly in basins among higher northern latitudes in winter. This analysis highlights irrigated agriculture is currently and will likely remain the key in global water management for basins facing the severest water scarcity, yet increasing attention on the seasonal and spatial variations in cross-sector water use competition is needed to better identify region- and season- specific mitigation opportunities.
Export citation and abstract BibTeX RIS

Original content from this work may be used under the terms of the Creative Commons Attribution 4.0 license. Any further distribution of this work must maintain attribution to the author(s) and the title of the work, journal citation and DOI.
1. Introduction
Freshwater resources are fundamental to sustaining global economic activities for an increasingly affluent and growing human population [1–3]. Water plays an important role in ensuring the security of the food and energy systems, both of which are among the 17 United Nations Sustainable Development Goals [4]. Due to the importance of food and energy security in achieving social sustainability, and that food and energy systems are among the global two largest water consumers, the emerging water competition between food and energy production represents an important component of the global food-energy-water nexus [5–7]. Although the agriculture sector unambiguously dominates global total water consumption [3, 5, 8], notable spatial and sub-annual variations in sectoral water consumption exist [3]. Without effectively characterizing and resolving the interconnections between the food, energy, and water systems, water use competition for food and energy production may lead to unintended conflicts between agriculture and power sectors, and threaten global and regional food and energy security [9, 10].
This food-energy-water nexus has been insufficiently investigated in previous literature, which has long been studied in separate disciplines [11, 12]. With the recent development of trans-disciplinary studies and convergence science, there is growing recognition of the intrinsic interactions among the food, energy, and water systems [1, 13–15]. As a result, the competition between the agriculture and energy systems also receives growing attention, which raises important environmental and ethical questions of human appropriation of limited and undervalued freshwater resources [1]. Such competition becomes even more concerning due to predicted population growth and associated increases in water consumption, together with potential challenges of decreasing water availability in places where it is most needed and when we most need it [5, 8, 16]. Increasing regional efforts have been taken to characterize the food-energy-water nexus via evaluating competing water uses within constrained geographic locations (i.e. specific river basins, countries, or regions) [9, 17–21]. Growing global studies have also started evaluating cross-sector water use competition [2, 10], yet few have systematically characterized the spatial and, especially, sub-annual variations in such competition. Despite the importance of a thorough understanding of competing water uses between food and energy production, only in recent years a global characterization of sub-annual agricultural water uses becomes available and widely applied [22, 23]. Meanwhile, most previous studies quantifying power sector water consumption are often based on universal water consumption coefficients for the same fuel type and cooling technology combinations [24–27], which largely follow the coefficients of the U.S. fleets reported in Macknick et al [24, 28], or simplify and sometimes ignore some important water consumers (e.g. hydropower) [29, 30], and without carefully accounting for the sub-annual variations in associated water consumption. Therefore, the relative importance of agriculture and power generation in affecting the geospatial and seasonal water scarcity and the associated implications on human society remain unclear, as does its historical evolvement. This, consequently, poses challenges for identifying targeted water mitigation opportunities and designing cross-sector coordination strategies to resolve local water scarcity in response to water use competition.
This study proposes a systematic analysis of the spatial and sub-annual water use competition for agriculture and power production in the past decade (2006–2015) and under a potentially warming climate (4 °C warming scenario), to effectively characterize the impacts of regional and seasonal competing water uses on local water scarcity for human population across global major river basins. Based on an individual basin's unique seasonal and sub-sectoral profile, this work further explores region- and season- specific water mitigation opportunities for basins most at risk. This study aims to provide a comprehensive characterization of water use competition for food and energy production under the baseline and a warming climate, which can shed light on cross-sector water management to better prepare for potentially increasing challenges.
2. Methods
2.1. Water consumption for agriculture and power production
Global monthly irrigated agriculture water consumption for 26 crop species are obtained from the Global Crop Water Model (GCWM) [22, 31, 32], which quantifies blue water consumption at a spatial resolution of 5 arc-minutes. Taking advantage of monthly growing areas and cropping calendars, and daily climate input variables (i.e. wind speed, temperature, and precipitation) [33–35], GCWM estimates grid-level and crop-specific irrigation water consumption based on daily soil water balances using the Penman-Monteith function. Although GCWM factors into changes in input climate variables, land use was kept constant using values from the MIRCA2000 dataset (Monthly Irrigated and Rainfed Crop Areas around the year 2000) [36]. To account for changes in both climate and land cover in affecting irrigated agriculture blue water consumption, country-level time series data of area equipped with irrigation (Food and Agriculture Organization of the United Nations database) [37] is used to adjust the GCWM results as in earlier studies [38].
Unit-level seasonal cooling water consumption for global thermal electricity generation is estimated based on the world electric power plants (WEPP) database as in earlier studies [39]. Qin et al [39], developed unit-level water consumption coefficients for thermal generation units based on annual average local meteorology (e.g. temperature), cooling technology type, and thermal efficiency via building the geo-coordinates of the WEPP database. Based on monthly mean meteorology from the Modern-Era Retrospective analysis for Research and Applications, v.2 (MERRA-2 reanalysis dataset) [40], here monthly average water consumption coefficients for global thermal generation units is calculated. Hydroelectric generation units consume water via reservoir evaporation. Earlier studies [39, 41–43] identified cost-effective equations that can provide reliable estimates of open water evaporation; thus, this study also uses the median value of the four equations: Jensen-Haise (1963), Stephens and Stewart (1963), Makkink (1957), and Hamon (1963) to estimate monthly average reservoir evaporation for global ∼6800 dams as recorded in the Global Reservoir and Dam Database (GRanD) [44]. To allocate reservoir water consumption to hydroelectricity generation, the purpose ranking allocation method described in Xie et al [45] is applied. For a given reservoir, the share of water allocation to hydroelectricity ( is based on total number of reservoir purposes
  and the relative purpose ranking of hydroelectricity
  . In the GRanD database, reservoir purposes are recorded as main (top priority), major (2nd priority), or secondary (3rd priority). When hydroelectricity purpose is marked as 'main' or 'major', or marked as the only 'secondary', water allocation ratio (
 is directly calculated using equation (1). If hydroelectricity is not the only 'secondary' purpose (i.e. there are other purposes also ranked as 'secondary', e.g. flood control), I assume all 'secondary' purposes have the same water allocation ratio, which is estimated by (
 (if 'main' and 'major' purposes both exist), or by
  (if there are only 'main' and 'secondary' purposes' for the reservoir).
  and
and  are estimated using equation (1) based on their respective ranking (1 and 2) and total purposes
  . Aggregating country total reservoir water consumption allocated to hydropower, together with corresponding hydroelectricity generation, monthly water consumption coefficients for hydro generation units in each country are quantified:
International Energy Agency summarizes monthly electricity statistics for major countries (i.e. Organization for Economic Co-operation and Development member countries and six additional economies) [46], which are used in this study to estimate monthly share to annual total electricity generation in each country. Integrating unit-level water consumption coefficients and electricity generation, this analysis quantifies seasonal total water consumption for thermal and hydroelectric generation units. More details are described in the supplementary information (available online at stacks.iop.org/ERL/16/064091/mmedia).
Aggregating monthly grid-level crop-specific irrigation water consumption and unit-level fuel-specific power plants water consumption at the spatial resolution of global basins as in Mankin et al [47], basin-level seasonal and annual average water consumption for both agriculture and power sectors in the past decade (2006–2015) are calculated. This study primarily considers agriculture and power sector water consumption. Comparing basin-level water consumption between the agriculture and power sectors, global basins are referred to as 'power-dominant' (or 'agriculture-dominant') if the fraction of power sector water consumption to total water consumption is above (or below) 50%.
2.2. Monthly runoff under historical and a warming climate
Grid-level monthly runoff (2.5 arc-minutes resolution) in the past three decades (1985–2015) is obtained from TerraClimate [48]: a global climate and climatic water balance dataset. TerraClimate has been extensively evaluated in prior studies and showed strong validation [48, 49]. To represent the impacts of climate change on future water availability, TerraClimate also simulates monthly runoff under a warming scenario (e.g. 4 °C above pre-industrial global mean temperature) based on the pattern scaling approach, as described in detail in Qin et al [23]. Aggregating grid-level runoff at the same basin level as that for water demand, water availability for global major river basins under the baseline climate is quantified. Following earlier studies, basin-level water scarcity is then calculated based on water consumption and water availability: total surface runoff from TerraClimate estimation minus environmental flow requirement (i.e. following the 80% rule by Richter et al [50], which suggests runoff depletion should be below 20% to maintain normal ecosystem service [2]).
3. Results
3.1. Historical water use competition for agriculture and power production
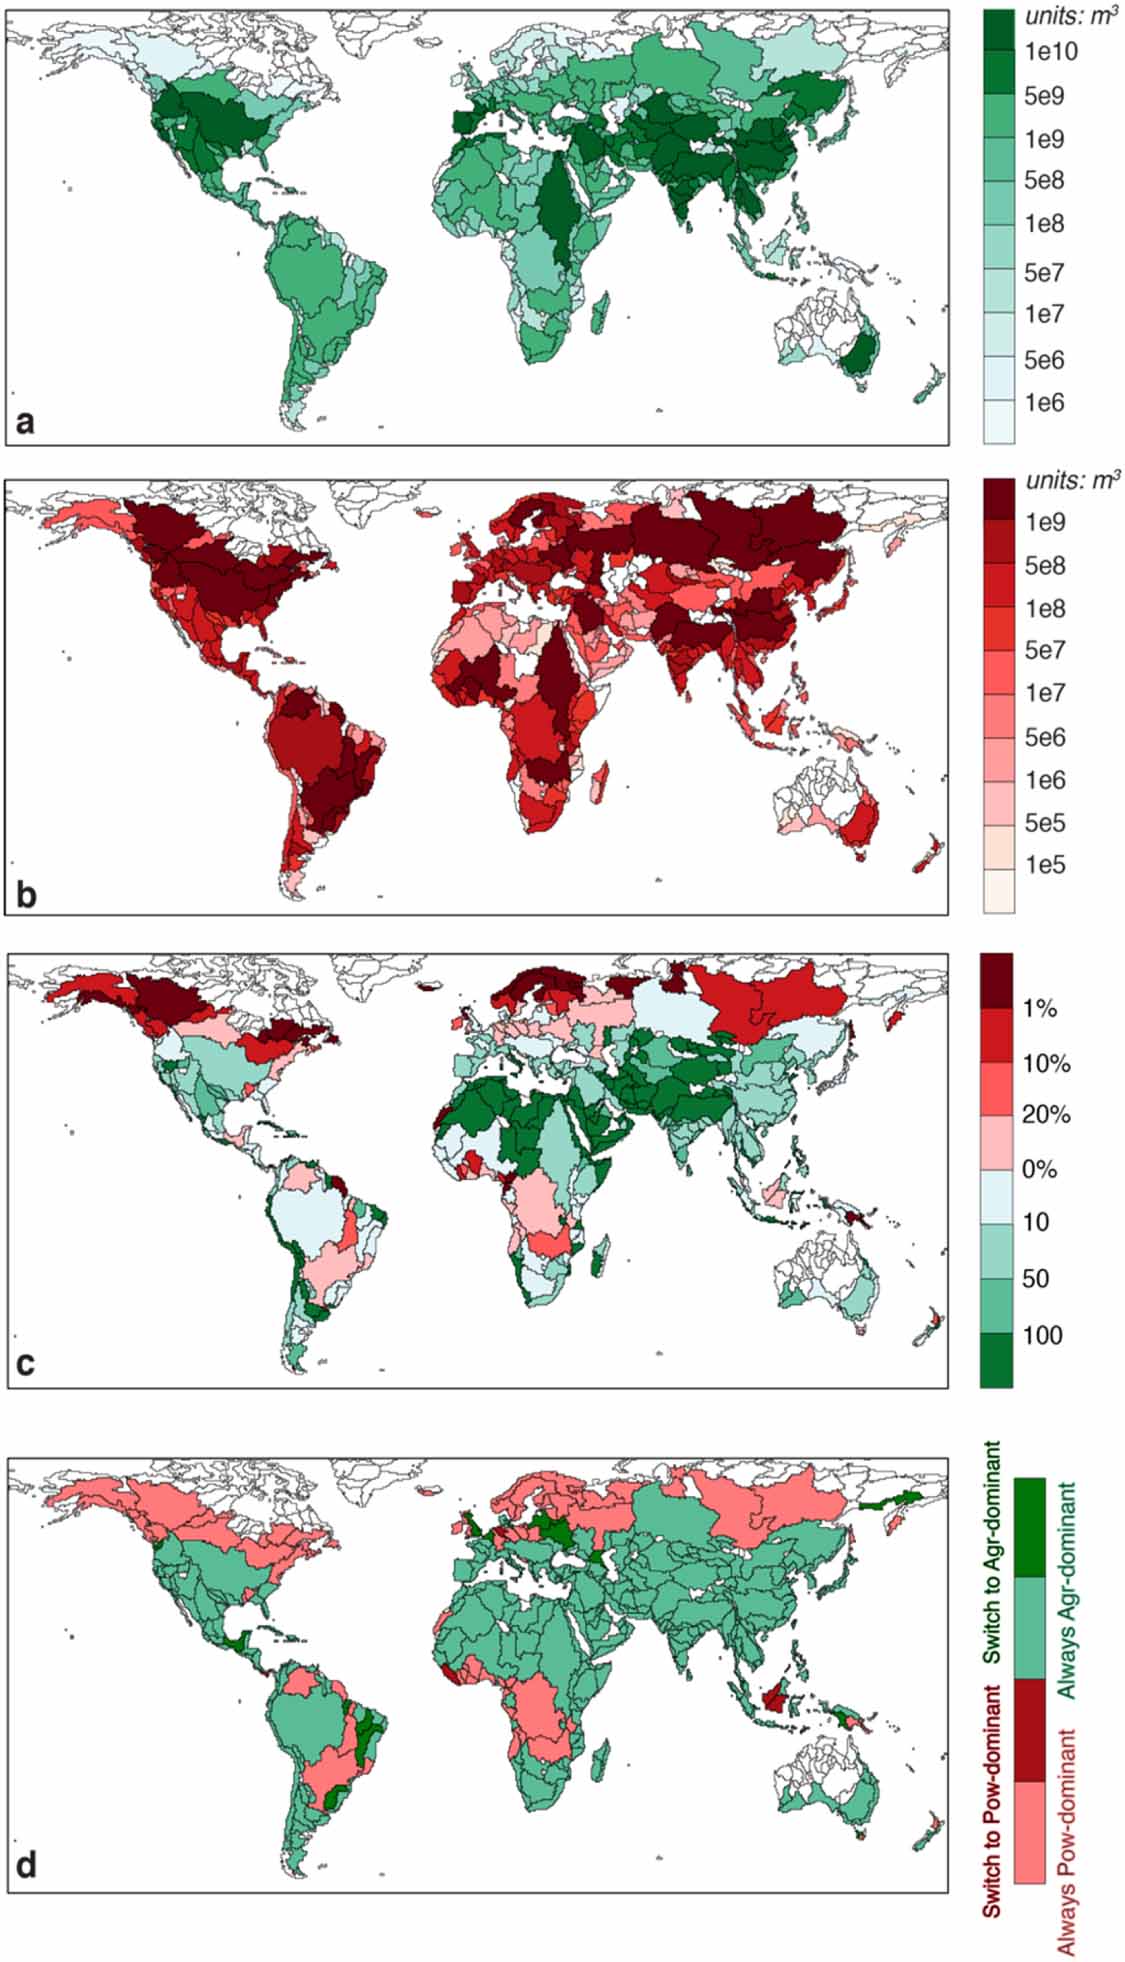
Across global major river basins, irrigated agriculture production consumes on average ∼1230 km3 yr−1 of freshwater in the past decade (e.g. over half is contributed by rice, wheat, and maize), which are roughly 7.5 times of that consumed by power generation (e.g. hydroelectricity contributes ∼90% and coal ∼6%). Both total water consumption and the relative contributions from agriculture and power production are relatively consistent during this period (figure S1). Agriculture production unambiguously dominates global total water consumption. Nevertheless, food production and power generation demonstrate notably different spatial patterns (figure 1). Irrigated agriculture water consumption is primarily concentrated in mid-northern latitudes, particularly in Asian and North American basins. In comparison, basins with the largest water consumption for power generation are relatively more dispersed globally (e.g. basins in high northern latitudes, southern China, northern parts of North America, southeastern parts of South America, and a few basins in Africa). As a result, water competition between food and power production illustrates evident geospatial variations. Except for high northern latitudes, irrigated agriculture usually consumes significantly more water than electricity generation (i.e. over two orders of magnitude in North Africa, Central Asia, and northern India). On the contrary, power generation surpasses annual average agricultural water consumption only in high-northern-latitude basins where irrigation water use is small, or in a few scattered basins (e.g. in South America and Africa) where hydroelectricity generation consumes substantial amounts of water. Therefore, global basins are predominantly dominated by agricultural water consumption, accommodating ∼6 billion people. In comparison, power-dominant basins only hold 13% of basin-total population. As shown in figure 1(d), few changes have occurred concerning the overall spatial pattern of water use competition in the past ten years, with negligible exceptions that have switched from agriculture-dominant basins to power-dominant basins, and vice versa.
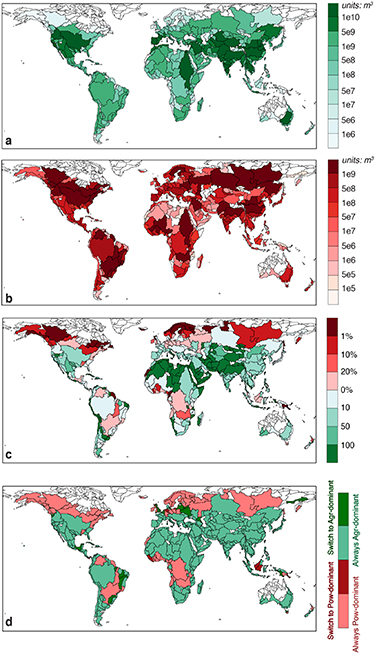
Figure 1. Global water consumption and competition for agriculture and power production. Global map of annual average (a) irrigated agriculture water consumption, (b) electricity generation water consumption, (c) the relative ratio of water consumption for irrigated agriculture production to electricity generation, and (d) historical trend of water use competition in the past decade (2006–2015). Only basins with relatively large population exposure (⩾ 1e5) are shown here. In panel (d), a basin is categorized as 'Always Pow (Agr)-dominant' if its power fraction of total water consumption has always been above (below) 50% from 2006 to 2015, while it is categorized as 'Switch to Pow (Agr)-dominant' if its power fraction is above (below) 50% in 2015, yet has not always been so during the past decade.
Download figure:
Standard image High-resolution image3.2. Competing water uses and impacts on water scarcity
Integrating recent year cross-sector water use competition and the resulting water scarcity (represented with water scarcity index: WSI) in 2015 (figure 2), this analysis points out that, under annual accounting, nearly all basins currently suffering from high (0.4 < WSI ⩽ 1) and extremely high (WSI >1) water scarcity are dominated by agricultural water consumption (figures 2 and S2). As a result, 50% of global basin-total population are exposed to agriculture-dominated high (23%) and extremely high (27%) water scarcity, yet almost all power-dominant basins have relatively low water scarcity (WSI ⩽0.4) (table S1). Despite increasing concerns on competing water uses between agriculture and power production, this study highlights, under an annual accounting, irrigated agriculture is still the key for managing basins facing severe water scarcity.

Figure 2. Global water scarcity and competing water uses. (a) Global map and (b) scatter plot of basin-level water scarcity relating to the fraction of power sector water consumption to total water consumption in 2015. Basins are grouped (by both color and size) based on total population. Basins with high water scarcity are mostly dominated by agricultural water consumption.
Download figure:
Standard image High-resolution imageIn addition to evident geospatial variations, noticeable seasonality in terms of the amounts and percentage contributions of sub-sector water consumption and competition is also observed (figures 3 and S3). Across four seasons, total water consumption is the largest in summer (e.g. ∼490 km3), mainly due to higher irrigated agriculture consumption (e.g. maize and rice), and hydroelectricity consumption to a lesser degree (figure S3). Although irrigated agriculture dominates global water consumption year-round, its percentage contribution varies from 91% in northern hemisphere winter (December–January–February, DJF) to 87% in summer (June–July–August, JJA). Cross-season variations in sub-sectoral (e.g. by crop species and fuel types) water consumption are even more obvious. For instance, wheat contribution ranges from 34% in March–April–May (MAM) to merely 3% in JJA, while maize production contributes 0.6% of total water consumption in DJF yet 13% in JJA (figure S3). Similarly, percentage contribution from hydro power ranges from 8% in DJF to 12% in JJA. Therefore, seasonal water scarcity also demonstrates noticeably different spatial patterns compared with that at the annual level. Although water consumption in JJA is the largest for both food and power production across four seasons, water scarcity in JJA is not particularly high as it often coincides with larger seasonal water supply. As shown in figure 3, water scarcity in DJF is much more severe than in the other three seasons, primarily due to its lower water availability. High-water-scarcity basins are mainly concentrated in Middle East, Central Asia, Northern Africa, and the western U.S. in months other than DJF, whereas many more basins, especially in high northern latitudes (e.g. Russia, Canada, and northern China) are exposed to extremely high water scarcity in northern hemisphere winter.
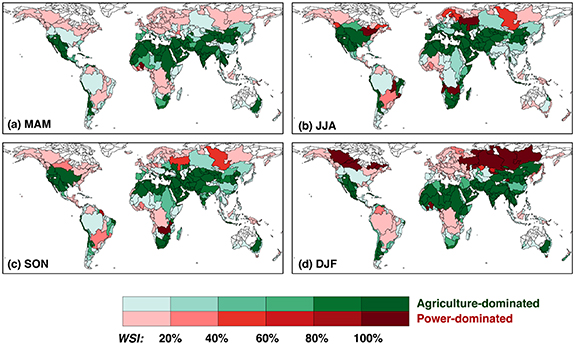
Figure 3. Seasonal water competition and impacts on water scarcity. Global maps illustrating the co-location of basin-level primary water consumers with different levels of water scarcity (WSI) when no other water management practices (e.g. interbasin transfer, reservoir storage) are in place in different seasons in 2015. Only basins with relatively large population exposure (⩾ 1e5) are shown here. MAM, JJA, SON, and DJF represents March–April–May, June–July–August, September–October–November, and December–January–February, respectively.
Download figure:
Standard image High-resolution imageAs a result, despite basins exposed to high water scarcity are still primarily dominated by agricultural water uses all year round, power sector plays a much more important role in affecting local water scarcity under seasonal accounting. For instance, the share of global basin-total population in power-dominant basins increased from 13% (900 million) under the annual accounting to 20% (1400 million) in northern hemisphere winter. Meanwhile, although only 27% of global population (all in agriculture-dominant basins) are exposed to extremely high water scarcity under annual accounting, this share increased to 52% (including 190 million in power-dominant basins) in northern hemisphere winter (table S1).
3.3. Water competition under a warming climate
Climate change is predicted to reshape both the magnitude and the timing of seasonal water resources [23], which may pose additional threats to human society that has long been relying on freshwater supply to ensure food and energy security. Potential water resource decreases are particularly concerning for basins already suffering from severe water scarcity. Figure 4 illustrates the spatial distribution of global basins that are likely to experience seasonal water supply decreases under a warming climate. As shown in figure 4, despite evident sub-annual variations, all seasons highlight a similar dominating feature—hotspots that are simultaneously exposed to extremely high water scarcity and decreasing water availability under a 4 °C warming scenario are primarily dominated by agriculture water consumption. On the contrary, power-dominant basins subjected to decreasing water availability under a warming climate are often with relatively low water scarcity, with a few exceptions in June–July–August. As a result, ∼14%–25% of global population are located in agriculture-dominant hotspots that are simultaneously facing decreasing seasonal water supply and extremely high water scarcity (dark green, varying on seasons), compared with 0.1%–2.5% in power-dominant hotspots (dark red) (table S2).
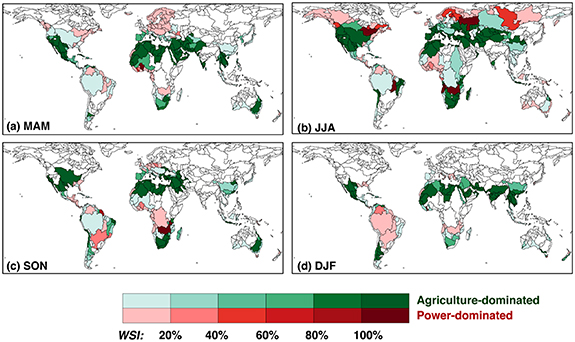
Figure 4. Seasonal water competition under decreasing water supply due to a warming climate. Global maps illustrating the co-location of basins with different levels of water scarcity (WSI) when no other water management practices are in place, the relative fraction of local power sector water consumption (power- or agriculture-dominant), and potentially decreasing seasonal water availability under a 4 °C warming scenario. Only basins with relatively large population exposure (⩾1e5) are shown here. MAM, JJA, SON, and DJF represents March–April–May, June–July–August, September–October–November, and December–January–February, respectively.
Download figure:
Standard image High-resolution image3.4. Targeted water mitigation opportunities
This analysis further explores seasonal water mitigation opportunities in the agriculture and power sectors. Figure 5 illustrates the required water use mitigation to achieve relatively low water scarcity (WSI ⩽0.4) across global basins when no other mitigation strategies are in place. Despite notable seasonal variations, this study identifies two dominating features: first, basins requiring water use efficiency improvement are primarily located in northern and southern Africa, Middle East, Central Asia, western U.S., and southeastern Australia. Second, among these basins, agriculture sector provides the most feasible mitigation opportunities in all four seasons. Power sector provides limited mitigation opportunities, with the most noticeable roles in winter season for high-northern-latitude basins (e.g. Lena, Volga, and Mackenzie River). These two features largely stay the same under the 4 °C warming scenario. Among a few basins (e.g. Yenisei basin in summer), water mitigation in either power or agriculture sector can help achieve required water scarcity alleviation. As to basins that cannot achieve a relatively low water scarcity by improving water use efficiency in either sector (colored in yellow), additional water supply (e.g. inter-basin water transfer), groundwater pumping, or seasonal water management (e.g. cross-season reservoir storage) are needed to alleviate local water scarcity. Such water management practices have already been widely employed across the globe, which relax the requirements regarding water use efficiency improvement. However, many of these practices may result in unintended environmental consequences, including land subsidence [23], evaporative losses [38], and worsening water shortage [51]. To avoid such trade-offs, improving water use efficiency in agriculture and/or power sector will become even more important in the future.
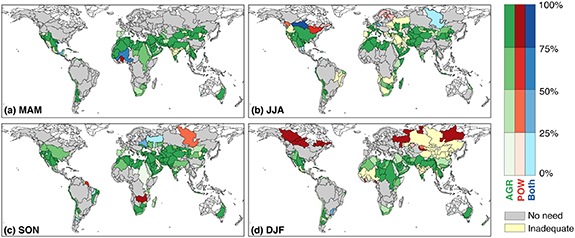
Figure 5. Sectoral water mitigation opportunities. Required water mitigation in agriculture (AGR) and/or power (POW) sector to achieve relatively low seasonal water scarcity in 2015 (WSI ⩽0.4) when no other water management practices are in place. Red, green, and blue color indicate required water use mitigation in the power sector, agriculture sector, or both sectors. Light to dark shades indicate an increasing degree of mitigation needed. When mitigation opportunities exist for both sectors, the shading is set by the lower degree of mitigation needed. Grey colors indicate sufficient seasonal water supply, whereas yellow colors indicate water mitigation in either sector is insufficient to alleviate water scarcity, other water management practices (e.g. interbasin transfer, reservoir storage) are either already in place or needed. Only basins with relatively large population exposure (⩾ 1e5) are shown here. MAM, JJA, SON, and DJF represents March–April–May, June–July–August, September–October–November, and December–January–February, respectively.
Download figure:
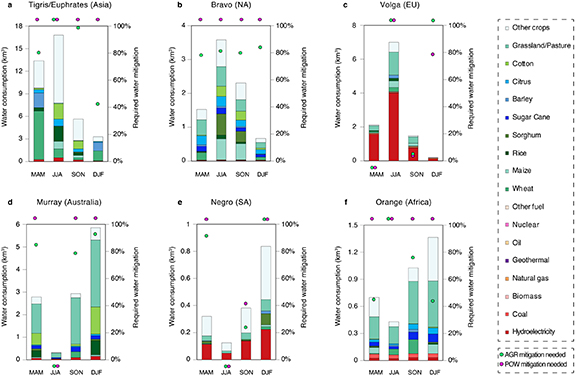
Standard image High-resolution imageTo explore region-specific characteristics, one basin with high water scarcity in most seasons is selected from each continent (figure S4). As shown in figure 6, total water consumption and cross-sector water competition vary significantly across basins and seasons. Among our selected basins, Tigris/Euphrates in Asia consumes the most water, with 97% (in northern hemisphere winter) to 99% (in northern hemisphere spring) of water consumed for producing irrigated agriculture. In particular, wheat, barley, and cotton production contribute 48%, 34%, and 19% of basin-total water consumption in northern hemisphere spring, winter, and fall. Therefore, these crop species provide the largest local water mitigation opportunities in corresponding seasons. In comparison, water mitigation in the power sector does not provide much opportunity to alleviate its local water scarcity. Similarly, irrigated agriculture production dominates local water consumption in all four seasons in Bravo (North America), Murray (Australia), and Orange (Africa) basins, where power sector water consumption is often less than 10%. In both Murray and Orange basins, consistent to their respective country pattern [52, 53], grassland/pasture dominates local water consumption, varying from 47% and 36% in southern hemisphere fall to 70% and 46% in southern hemisphere spring in Murray and Orange, respectively. In Bravo basin, grassland/pasture, maize, and sorghum each contributes 19%, 14%, and 12% of local annual total water consumption, with notable seasonal variations for all crop species. For instance, grassland/pasture contribution ranges from 15% in northern hemisphere fall to 30% in spring. As a result, irrigated agriculture in these basins also provides the most water mitigation opportunities (e.g. grassland/pasture in particular) in most seasons. Unlike the other four basins, power sector water consumption, especially for hydroelectricity generation, contributes 60% of annual total water consumption in Volga basin (Europe) and 30% in Negro basin (South America), with seasonal contributions ranging from 52%–74% and 27%–38%, respectively. Therefore, power sector in these two basins (primarily hydro power) provides significantly larger water mitigation opportunities than in other basins. Notable variations are observed not only across basins and sectors, but also across seasons, which consequently affect water mitigation opportunities significantly. For instance, in the Volga basin, 4% of power sector water mitigation in northern hemisphere fall and 79% mitigation in winter is needed to tackle local water scarcity. Meanwhile, this same basin has sufficient water supply in spring, yet power sector water mitigation will be inadequate in Volga basin's summer months. Therefore, cross-season water management (e.g. reservoir storage of seasonal water) can play an important role in water scarcity alleviation among basins with similar features.
Figure 6. Sectoral water consumption and required mitigation for selected basins in scarcity. Bar charts indicate seasonal agriculture and power sector water consumption broken down by major crop species and fuel types (left y-axis). Upper (bottom) panels show northern (southern) hemisphere basins. Green and magenta dots indicate required water use mitigation in agriculture and power sectors, respectively (right y-axis) when no other water management practices are in place. Dots located above 100% indicate that it is inadequate to achieve relatively low seasonal water scarcity (WSI ⩽0.4) just by water mitigation in the corresponding sector. Dots located below 0% indicate sufficient seasonal water supply is available even without further water use mitigation.
Download figure:
Standard image High-resolution image
4. Discussion
This study developed a systematic global analysis to characterize seasonal competing water uses for irrigated agriculture and power electric production under both a historical (2006–2015) and a potentially warming climate (4 °C warming scenario) across global major river basins. Our study highlights that, under annual accounting, the majority (87%) of global population are located in basins dominated by agricultural water consumption, among which 23% and 27% are exposed to high and extremely high water scarcity. In comparison, power sector-dominant basins only accommodate 13% of total population, with the majority exposed to relatively low water scarcity. Therefore, almost all global basins currently exposed to high and extremely high water scarcity are dominated by agricultural water consumption under annual accounting, which are often simultaneously exposed to potential decreasing water availability under a 4 degree warming climate. Nevertheless, power sector becomes much more important in causing local water scarcity under seasonal accounting, particularly in winter seasons for high northern latitude basins. As a result, the number of population exposed to power-dominant extremely-high-scarcity basins increase significantly in DJF months (190 million) in comparison to annual accounting (negligible).
Across mid-latitude basins exposed to water scarcity, irrigated agriculture provides the most water mitigation opportunities across all four seasons. Power sector, on the contrary, provides the most targeted mitigation opportunities in northern hemisphere winter months. Only a few basins provide mitigation opportunities in both sectors, yet there are quite a few basins (particularly in northern hemisphere winter across central and eastern Russia, northeastern China, central India, and northwestern parts of Africa) requiring alternative water resources, and/or better cross-season water management, as mitigation in either sector alone is insufficient to significantly alleviate local scarcity. As this analysis only focuses on water mitigation opportunities in the power and agriculture sectors, it tends to overestimate seasonal water scarcity and hence required levels of power and agriculture sector water mitigation in places where other water management practices (e.g. inter-basin transfer, reservoir storage) are already in place. Figure S5 demonstrates the potential water scarcity alleviation role by global reservoirs.
Substantial cross-season and cross-basin water competition differences draw attention to different targeted water mitigation opportunities across seasons and regional hotspots facing severe water scarcity and potential water availability decreases. Therefore, this work highlights notable geospatial and sub-annual variations in water competition for food and energy production. Irrigation water consumption is likely to be the key in addressing severe water scarcity in most regions under both the current and a potentially warming climate. Nevertheless, power sector can also provide unique water scarcity alleviation opportunities in different seasons and different basins. Follow-up analysis should also evaluate future changes in location-specific power sector transition and irrigated agriculture evolvement to characterize future cross-sector water use competition and resulting social and environmental impacts.
Acknowledgment
Y Q acknowledges helpful discussions with S Siebert.
Data availability statement
All data that support the findings of this study are included within the article (and any supplementary files).
Conflict of interest
The authors declare no competing financial interests.