


Abstract
Aircraft at airport gates require power and air conditioning, provided by fossil fuel-combusting equipment, to maintain functionality and thermal comfort. We estimate the life-cycle greenhouse gas (GHG) emissions and economic implications from electrifying gate operations for 2354 commercial-traffic airports in the world. Here we show that complete electrification could yield GHG reductions of 63%–97% per gate operation relative to current practice, with greater reductions correlated with low-carbon electricity. Economic payback periods average just 1–2 years. Shifting to complete gate electrification could save a high-traffic airport an average of $5–6 million in annual climate economic damages relative to estimates of current practice. 10–12 million metric tons of annual GHG emissions are potentially saved if most airports in the world electrified gate operations, costing the 24 busiest global airports on average $25–30, U.S. airports $60–70, and non-U.S. airports $80–90 per metric ton of CO2 mitigated, in some cases comparable to carbon-market prices. Environmental benefits depend primarily upon electricity sources and operational parameters such as aircraft fleet composition.
Export citation and abstract BibTeX RIS

Original content from this work may be used under the terms of the Creative Commons Attribution 4.0 license. Any further distribution of this work must maintain attribution to the author(s) and the title of the work, journal citation and DOI.
1. Introduction
The aviation industry is a critical component of the global transportation network, moving over 4.4 billion passengers in 2018 (IATA 2019) and 221 billion ton kilometers of freight (World Bank Group 2020). The industry contributes 2%–3% of global anthropogenic greenhouse gas (GHG) emissions (Graver et al 2019, ICAO 2020), but is expected to account for a larger share as other transportation and industrial sectors more easily decarbonize (Terrenoire et al 2019). More effort is devoted to mapping the carbon impact from aircraft activities (e.g. take-off, cruising, and landing) than from airport operational activities (e.g. lighting terminal buildings and runways, servicing parked aircraft) (Monsalud et al 2015). It is estimated that airports comprise only 5% of the aviation sector's total GHG emissions (ACA 2020), but that value is an underestimate because it does not consider the full scope of emissions from all operational activities, including regional and embodied impacts (Greer et al 2020). Comprehensive environmental accounting of the aviation industry needs to consider GHG emissions from all airport operational activities as the industry explores opportunities to mitigate their climate change contributions more effectively.
During turnaround operations, when an aircraft is parked at a gate between flights, the aircraft requires electrical power and air conditioning to meet functional requirements (e.g. maintaining system functionality and thermal comfort for passengers). Typically, functional requirements are met by exclusively operating the aircraft's auxiliary power unit (APU) or by operating a combination of the APU and diesel-powered ground service equipment (GSE). The APU is a non-thrust engine located at the aircraft's rear and is able to provide both electrical power and air conditioning, while separate GSE units are necessary to supply additional power and air conditioning. The APU runs on jet fuel, a refined form of kerosene. Combustion of the APU's jet fuel and the GSE's diesel emits GHGs and air pollutants such as nitrogen oxides (NOx ), particulate matter (PM), volatile organic compounds, and sulfur dioxides (Kinsey et al 2012, Lobo et al 2015, Winther et al 2015, Padhra 2018, Mokalled et al 2019, Xu et al 2020), which are detrimental to human health (Harrison et al 2015, Yim et al 2015). The addition of anthropogenic GHG emissions to the atmosphere leads to the increase of average global temperatures (Pachauri et al 2014). Increased temperature anomalies are expected to cause, or are already causing, drastic changes in the climate system. Such changes result in impacts including increased frequency and intensity of droughts, wildfires, storm events/hurricanes, and coastal sea level rise, which all have long-ranging, negative consequences for everything living.
Instead of the APU and the GSE, parked aircraft can utilize electricity-powered gate equipment. When parked at the gate, the aircraft is supplied electricity from the airport's electrical grid through 400 Hz ground power cables. Thermal comfort is achieved by connecting hoses from a preconditioned air (PCA) unit to the aircraft. The 400 Hz and PCA systems are often attached underneath or adjacent to the passenger boarding bridge (PBB). The PBB is the fully enclosed gateway that connects passengers from the terminal gate to the parked aircraft (figure S1 (available online at stacks.iop.org/ERL/16/054039/mmedia) in supplementary information (SI) section S1). Recent analysis indicates that gate electrification reduces ambient concentrations of NOx and PM on the airport apron, which is important for mitigating human population exposures (Benosa et al 2018, Fleuti 2018, Preston et al 2019). It has been qualitatively suggested that using 400 Hz and PCA units also helps reduce fuel costs for airlines (ACRP et al 2012). Gate electrification has been identified as an important GHG reduction strategy for airports (Barrett 2019), but currently there is no estimate for the scope of its reduction potential.
While GHG emissions have been inventoried for other airport activities such as the landing and take-off cycle of aircraft (Dissanayaka et al 2020), there are no existing studies that quantify the GHG emissions, let alone use life-cycle assessment (LCA) to inventory the potential emission reductions from gate electrification across multiple aircraft types, airports, ambient air temperature conditions, or electricity supply mixes. LCA is a standardized methodology, formally outlined in International Organization for Standardization (ISO) 14040, for estimating the environmental impacts throughout a product, project, or service's life-cycle phases (i.e. raw material extraction, processing and manufacturing, transportation and logistics, operations, maintenance, and end of life) (ISO 2006). LCA is recognized as a robust methodology for holistic decision-making and has been previously used in estimating GHG emissions associated with airport infrastructure such as airfield pavements (Wang et al 2016, Yang and Al-Qadi 2017) and in inventorying GHG and criteria air pollutants from infrastructure, fuels, supply chains, and flight operations for an average airport (Chester and Horvath 2009).
We use flight records and site-specific electricity and air temperature data to quantify the GHG and economic implications, and climate economic damages associated with a range of gate electrification scenarios for the top 24 busiest airports in the world. These 24 airports account for a quarter of global annual traffic (ACI 2020). We then extend our environmental analysis, with less specific data, to estimate life-cycle GHG emissions from gate electrification for the 2354 airports responsible for the majority of commercial traffic. We investigate how GHG emission savings from gate electrification compare for airports with differing electricity supply mixes and air temperatures. To provide a perspective on the relative emissions impact from gate electrification, we compare the life-cycle GHG emissions from an average flight to an average gate operation. In assessing the economic impacts of installing and using gate electrification equipment, we calculate the payback period and levelized annual costs at each case-study airport. Additionally, the climate economic damages associated with gate electrification for both an average gate operation and for all annual operations at each case-study airport are quantified. We demonstrate the cumulative GHG emissions reduction potential for a range of gate electrification scenarios for small, medium, and large airports in Africa, Asia, Europe, Latin America, North America, the Middle East, Russia, and the Southwest Pacific. Finally, we estimate the cost per metric ton of mitigated GHG emissions for the 24 case-study airports, as well as for the 2354 airports in the global dataset.
2. Methods
We use measured data and literature sources to calculate the life-cycle GHG emissions, payback periods, levelized annual costs, and climate damages for annual turnaround operations at the busiest 24 international airports, which span North America, Europe, and Asia. Specific airport names and locations are provided in table S1 of the SI. The 24 airports all serve major domestic and international markets and are responsible for approximately 25% of all commercial flights by aircraft movements. We extend our analysis using less specific data to estimate cumulative life-cycle GHG emissions from the 2354 airports that serve all commercial aviation traffic (see section S5 in SI).
Five scenarios (table 1) are evaluated to determine the range of effects from utilizing the gate equipment. Local characteristics for each airport (i.e. aircraft fleet mix, number and type of flight operations, electricity supply, heating/cooling requirements) are considered so that results are site-specific. Scenarios 1 and 3a/3b represent upper and lower bounds, respectively, on potential GHG emissions from parked gate operations. The scenarios referred to as '2a' and '2b' are an average representation of current practice at a typical commercial traffic airport, taken from a year's worth of measured data. Scenarios 2a and 2b are representative of the minimum and maximum amount of emissions associated with current practice because of their use of electric and diesel-powered PCA units, respectively. While there is no available comprehensive assessment of the utilization of electric versus diesel-powered PCA, it is likely that actual usage falls somewhere between the rates outlined in scenarios 2a and 2b. The analyzed scenarios, while not an exact depiction of all possible configurations of gate electrification, are emblematic of the conceivable scope of GHG emissions.
Table 1. Descriptions of operational scenarios for analysis.
| Scenario | Description | Characterization |
|---|---|---|
| 1 | APU is used for 100% of each turnaround operation | Worst Case |
| 2a | 400 Hz and electric PCA are used for 70% of each turnaround operation APU is used for 30% of each turnaround operation | Current situation |
| 2b | 400 Hz and diesel PCA are used for 70% of each turnaround operation APU is used for 30% of each turnaround operation | Current situation |
| 3a | 400 Hz and electric PCA are used for 100% of each turnaround operation | Best case |
| 3b | 400 Hz and diesel PCA are used for 100% of each turnaround operation | Best case |
2.1. Life-cycle GHG emissions
A life-cycle approach is used to estimate GHG emissions for turnaround operations (i.e. providing electrical power and heating/cooling to parked aircraft) for each scenario. The scope of the LCA is listed in table 2. End-of-life impacts are not considered in the analysis.
Table 2. Scope of LCA.
| System | |||||
|---|---|---|---|---|---|
| APU | 400 Hz ground power | Electric PCA | Diesel PCA | PBB | |
| Infrastructure |
|
|
|
| |
| Operation |
|
|
|
|
|
| Fuels |
|
|
|
|
|
The life-cycle GHG emissions per turnaround operation are dependent upon multiple factors, including the type of aircraft at the gate, the duration of the aircraft's stay at the gate, the source of electricity utilized by the airport, the air temperature profile of the airport, the gate configuration of the airport, and most significantly, the type of equipment supplying electricity and air conditioning to the parked aircraft. The type of equipment used in supplying electricity and air conditioning is a function of the operational scenario (e.g. scenario 2a). Equation (1) is used to calculate the per-gate-operation life-cycle GHG emissions for scenario 2a (all remaining scenarios are presented in section S.2.1 in the SI). Table 3 defines the variables and their corresponding units for equation (1). The amount of heating and cooling that is provided by the APU and/or the PCA in all scenarios depends upon the air temperature profile of the specific airport. The air temperature profile is determined using monthly average temperatures, which while not temporally refined, are in keeping with previous methodological approaches (ACRP, FAA, Environmental Science Associates 2012).
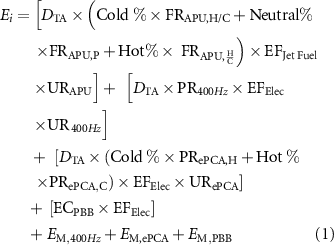
Table 3. Scenario 2a equation variables and definitions.
| Variable | Definition | Units |
|---|---|---|
| Ei | Life-cycle GHG emissions per gate operation i | kg CO2 (eq)op−1 |
| DTA | Turnaround duration of specific operation | h |
| Cold % | Airport-specific annual share of cold conditions, inclusive between 0 and 1 | Unitless |
| Neutral % | Airport-specific annual share of neutral conditions, inclusive between 0 and 1 | Unitless |
| Hot % | Airport-specific annual share of hot conditions, inclusive between 0 and 1 | Unitless |
| FRAPU, H/C | Fuel rate for APU heating/cooling conditions, dependent upon wingspan class | L h−1 |
| FRAPU, P | Fuel rate for APU providing power, dependent upon wingspan class | L h−1 |
| EFJet Fuel | Life-cycle emission factor for jet fuel | kg CO2 (eq)L−1 |
| URAPU | Utilization rate of APU, dependent upon wingspan class | Unitless |
| PR400Hz | Power rating of 400 Hz, dependent upon wingspan class | kW |
| UR400Hz | Utilization rate of 400 Hz, dependent upon wingspan class | Unitless |
| PRePCA, H | Power rating electric PCA heating conditions, dependent upon wingspan class | kW |
| PRePCA, C | Power rating electric PCA cooling conditions, dependent upon wingspan class | kW |
| URePCA | Utilization rate of electric PCA, dependent upon wingspan class | Unitless |
| ECPBB | Electricity consumption of PBB per operation | kWh op−1 |
| EFElec | Life-cycle emission factor for electricity, airport-specific | kg CO2 (eq)kWh−1 |
| EM, 400Hz | Manufacturing emission factor for 400Hz, airport-specific | kg CO2 (eq)op−1 |
| EM, ePCA | Manufacturing emission factor for electric PCA, airport-specific | kg CO2 (eq)op−1 |
| EM, PBB | Manufacturing emission factor for PBB, airport-specific | kg CO2 (eq)op−1 |
Figure 1 provides a schematic diagram that details the types and sources of data used for estimating turnaround durations as well as carbon intensities for the 400 Hz unit and the PBB (with schematics for the other equipment presented in section S2.1. in SI). The figure outlines the sources of data ('Database' section), the distinct parameters used in calculations ('Data' section), and the outcomes from the calculations ('Results' section).
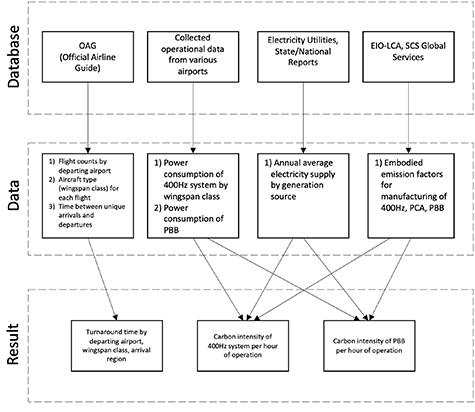
Figure 1. Depiction of data used for estimating GHG emissions from 400 Hz and PBB per gate operation. Schematics for the remaining equipment are presented in the SI.
Download figure:
Standard image High-resolution imageData from a flight record database are used to estimate turnaround durations for each of the 24 case-study airports (L. Perry, personal communication, 22 June 2020). Using the flight record database, we develop an inventory of flight counts by departing airport and by aircraft type, which is also known as wingspan class, for the 2019 calendar year (section S2.2.1.1. in SI). Using data on a representative day from July 2019, we then use unique arrival and departure times by aircraft to estimate mean, minimum, and maximum turnaround durations for each airport (section S2.2.1.2. in SI). July is selected because it is one of the busiest air travel months; thus a range of aircraft types and trip types are reflected in the turnaround durations. We then merge these two datasets to arrive at an approximate operational matrix of turnaround durations for each airport (section S2.2.1.3 in SI). The turnaround matrix is then finally 'cleaned' to limit the duration of turnaround operations when it is unlikely that the aircraft would require power and air conditioning (e.g. when an aircraft is parked overnight).
The carbon intensity of each equipment piece is a function of how much energy each equipment type consumes per wingspan class, the type of energy each equipment consumes, and the equipment's manufacturing impact. Energy consumption data for each equipment type is compiled from measured data and literature sources (section S2.2.2. in SI). As the APU and both electric and diesel PCA units provide heating and cooling, we developed the ambient air temperature profile for each case-study airport to determine the amount of time that heating and cooling conditions are activated (table S19 in SI).
The APU combusts jet fuel, the 400 Hz and electric PCA units consume electricity, and the diesel PCA unit combusts diesel fuel. Emission factors for electricity are location-dependent due to the differing power generation mixes supplied to each airport. As explained in section S2.2.3. of the SI, electricity emission factors for each airport are calculated by multiplying the annual average power generation mix of the airport's local electric utility by fuel-specific life-cycle emission factors (Horvath and Stokes 2011). Although regional differences exist in processing and refining, the emission factors for jet fuel and diesel fuel are assumed to be the same regardless of location (table S18 in SI). Figure 2 shows the life-cycle GHG emission factor for the electricity consumed at each airport. A relatively high emission factor indicates that the electricity for a specified airport is generated using a greater percentage of fossil fuels. For example, roughly 70% of the electricity at Beijing Capital International Airport (PEK) is sourced from coal, while nearly 100% of the electricity consumed at San Francisco International Airport (SFO) is sourced from hydroelectric power plants. The lower electricity emission factors for airports such as Dallas Fort Worth International Airport (DFW) and London Heathrow Airport (LHR) are due to their commitments to purchasing renewable sources of electricity, despite fossil fuels dominating their regions' average electricity supplies (DFW 2019, LHR 2020).
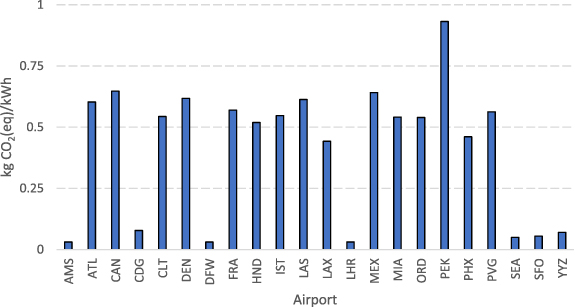
Figure 2. Life-cycle GHG emission factors for electricity supply for each of the 24 airports responsible for 25% of annual global commercial aviation traffic. Airport codes are: AMS (Amsterdam, NL); ATL (Atlanta, GA); CAN (Guangzhou, CN); CDG (Paris, FR); CLT (Charlotte, NC); DEN (Denver, CO); DFW (Dallas, TX); EWR (Newark, NJ); FRA (Frankfurt, DE); HND (Tokyo, JP); IST (Istanbul, TR); JFK (Queens, NY); LAS (Las Vegas, NV); LAX (Los Angeles, CA); LHR (London, GB); MEX (Mexico City, MX); MIA (Miami, FL); ORD (Chicago, IL); PEK (Beijing, CN); PHX (Phoenix, AZ); PVG (Shanghai, CN); SEA (Seattle, WA); SFO (San Francisco, CA); YYZ (Toronto, CAN).
Download figure:
Standard image High-resolution imageImpacts from the manufacturing of the 400Hz and PCA units are approximated using aggregate data from the Economic Input–Output Life Cycle Assessment (EIO–LCA) model (Carnegie Mellon University 2020) as explicit data for estimating these components are currently unavailable. We use data from a representative PBB to estimate the life-cycle GHG emissions associated with its manufacturing (SCS Global Services 2020). Since we do not have exact information regarding gate configurations at each airport, we make some assumptions. All gates at each case-study airport are assumed to be used on an annual basis and each gate is equipped with one PBB, one PCA unit, and one 400 Hz unit. We assume that all equipment will have a lifespan of 20 years. Further data and assumptions for the manufacturing impact of equipment are provided in section S2.2.2.3 in the SI.
The utilization rate for each equipment type is unique for each operational scenario (section S2.2.2.1. in SI). The utilization rates for Scenario 1 and Scenarios 3a/3b are maximum bounds for the APU and 400 Hz/PCA units, respectively. The utilization rates for Scenarios 2a and 2b are representative of current practice at major international airports and come from measured data from airport gates.
2.2. Payback period and levelized annual costs
The economic issues of upgrading an airport's gate electrification equipment, or any airport infrastructure upgrade/renovation, are complex. Although there might be different investment relationships, an airport typically purchases and installs the equipment, but an airline might reap the benefit of that investment in terms of savings in fuel costs. An analysis of different investment relationships is outside the scope of this study. We make a simplifying assumption and lump both airport operators and airlines together, and assume these stakeholders jointly make the investment and accrue resulting benefits. The payback period indicates how long it takes for an initial investment to be recouped from savings in annual operation and maintenance costs. We estimate the payback period to determine the economic benefit of switching to electrified gate operations from APU operation entirely (i.e. switching away from scenario 1). The payback period is evaluated for each scenario for each case study. Equation (2) is used in estimating the payback period (Rubin and Davidson 2001)
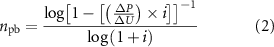
- where npb is the payback period, in number of years;
- ΔP is the cost of the initial capital investment, in USD
- ΔU is the annual savings that occur as a result of making the investment, in USD
- i is the discount rate, assumed to be 6%.
Capital investment costs are the direct monetary costs associated with equipping each gate in the case-study airport with 400 Hz and PCA units. Annual savings are calculated by determining how much money is saved from shifting away from 100% utilization of jet fuel (i.e. scenario 1). Annual savings depend upon the utilization rates of each equipment type outlined in the hypothetical operational scenarios.
We calculate the levelized annual costs in constant, 2019 United States dollars (USD) in order to compare the economic benefits from switching between scenarios 2a and 2b and between scenarios 3a and 3b. Levelized annual costs are useful in determining the cheaper option between alternatives, especially when the capital investment for the two options is the same. The key difference between scenarios 2a and 2b and between scenarios 3a and 3b is the type of PCA unit (i.e. electric versus diesel). Levelized annual costs are calculated using equation (3) (Rubin and Davidson 2001)
- where ACTotal is total levelized annual cost for a scenario, in USD
- ACOper is the annual operating cost of the scenario, in USD
- ACMain is the annual maintenance cost associated with the scenario, in USD
- P is the capital investment cost, or purchase price, in USD
- i is the discount rate, assumed to be 6%
- n is the total number of operating years, assumed to be 20 years.
Capital costs for gate electrification depend upon the size of aircraft (i.e. the wingspan class) that a gate is equipped to handle. Therefore, it is critical to know the total number of gate types at each airport. As most airports do not publicly document this data, estimates are determined from a combination of airport-specific resources such as annual financial reports and terminal maps. Gate type allocations are proportional to each airport's aircraft fleet mix. All economic data (e.g. jet fuel and diesel fuel costs, electricity prices) and further assumptions are outlined in section S3 of the SI.
2.3. Climate economic damages
We calculate the climate economic damages for each airport's turnaround operations. Climate damages indicate the economic harm that will result from climate change impacts such as rising sea levels and wildfires. We estimate climate economic damages by multiplying the mass of GHG emissions from a turnaround operation by the social cost of carbon (SCC). The SCC is a valuation metric that estimates the economic value of the harm caused by emitting one additional metric ton of carbon dioxide to the atmosphere (Nordhaus 2017). The SCC is used to demonstrate the full cost of an entity's GHG emissions and to provide an economic incentive for polluters to reduce their emissions (i.e. a polluter would want to reduce its emissions so that it would not have to pay a regulatory agency or government for non-compliance). Damages per gate operation are calculated using equation (4)

- where Di are the damages per gate operation i, in USD
- Ei are the total of emissions per gate operation i, in metric tons
- SCC2019 is the social cost of carbon for 2019, in USD metric ton−1.
We adjust the 2015 SCC that uses a 3% discount rate (Interagency Working Group 2016). We first linearly interpolate between the 2015 and 2020 SCC to determine the 2019 SCC. We then transform the 2019 SCC from 2007 dollars to constant, 2019 dollars. Equation (5) is used to determine the 2019 SCC
- where SCC2019 is the calculated social cost of carbon for 2019, in USD metric ton−1
- SCC2015 is the social cost of carbon for 2015 when using a 3% discount, $36 metric ton−1
- SCC2020 is the social cost of carbon for 2020 when using a 3% discount rate, $42 metric ton−1
- Yi is the year of interest;
- CF2007→2019 is the conversion factor for adjusting 2007 USD to 2019 USD
The adjusted SCC2019 used in the analysis is valued at $52 per metric ton of GHG emissions. The SCC is highly sensitive to the discount rate used in its valuation (Pizer et al 2014). However, since this analysis does not evaluate climate economic damages for future emissions (i.e. our period of study is the calendar year 2019), we believe that the SCC calculated using equation (5) offers a suitable estimation. The methods used in determining the SCC for 2019 are provided in section S4 of SI. Cumulative annual climate damages per airport are estimated by multiplying the per-gate-operation damages by the total number of gate operations. Further assumptions are outlined in section S4 of SI.
2.4. Global analysis
We extend the environmental analysis with less precise data to estimate the annual life-cycle GHG emissions from fuel consumption (i.e. electricity, jet fuel, diesel fuel) for the top 2354 commercial traffic airports in the world. These 2354 airports account for the majority of all commercial air traffic. Results from the global analysis offer an estimate of the scale at which gate electrification can reduce GHG emissions. We do not follow the precision of the analysis used for the 24 case-study airports. The fidelity of the global analysis is sufficient to reach definitive conclusions.
Using departure data (which are a proxy for number of turnaround operations) from the calendar year 2019, we first group airports into three size categories. Small airports have between 1000 and 10000 annual turnaround operations, medium airports have between 10001 and 100 000 annual turnaround operations, and large airports have more than 100 001 annual turnaround operations. Typically, airport size classifications are characterized by number of annual passengers or share of total passenger traffic (FAA 2020, OAG 2021). The number of annual passengers is not strictly correlated with aircraft movements, but there is overlap between the two classification schemes. For example, SFO is considered a 'large' airport according to both annual passenger numbers and annual aircraft movements.
We do not have the same level of granularity for turnaround durations or flight data (i.e. the number of flights by wingspan class) as we do for the original 24 case-study airports. We calculate the average of the mean, minimum, and maximum turnaround durations for each of the case-study airports and assume that these turnaround durations are applicable to all of the 'Large Airports' in the extension analysis. Scaling factors of 25% and 50% are applied to 'Large Airports' turnaround durations to estimate turnaround durations for the 'Medium Airports' and 'Small Airports', respectively. Scaling factors are necessary to apply. Smaller airports have different traffic patterns (e.g. not as many long-haul international flights) than the airports in the 'Large Airport' category and as such will tend to have shorter turnaround durations.
Similarly to what is described in section 2.1, we calculate life-cycle GHG emissions per gate operation for each of the five operational scenarios. Cumulative emissions for each airport are found by multiplying the emissions impact per gate operation by the airport's total number of operations. Cumulative annual emissions are grouped by operational scenario, airport size, and airport region. We do not account for PBB operating emissions or infrastructure emissions in the extension analysis due to the potential for greater uncertainty. Estimating these emission sources requires knowing the exact number and type of gates at each airport. The life-cycle emission factors for electricity supplies are estimated according to the same methodology previously outlined, albeit they are estimated at the region level (e.g. North America, Asia) and not airport/city level. Further data and assumptions are documented in section S5 of the SI.
3. Results
3.1. Environmental results for case-study airports
The results point to a clear conclusion: gate electrification would yield large reductions in GHG emissions, especially compared to aircraft turnaround operations that are powered by the APU. While not demonstrating an exact depiction of current practice of gate electrification, the results indicate the likely range of GHG reduction potential. Figure 3 shows the average percentage reductions in GHG emissions for a range of operational scenarios (scenarios 2a and scenarios 3a/b) relative to the upper-bound of current practice, scenario 2b, which utilizes the APU and diesel-powered PCA. Total emissions per average gate operation depend upon multiple factors, including the type and duration of each equipment's use, the source of electricity, and the airport's aircraft fleet composition and frequency of flights. For the complete electrification scenario (scenario 3a), GHG emissions per gate operation are reduced at least by 63% for each of the case-study airports. In particular, the airports that have the cleanest electricity supplies (i.e. AMS, CDG, DFW, LHR, SEA, SFO, YYZ) exhibit the greatest reductions in GHG emissions for a gate operation. A carbon-intensive electricity mix (e.g. more than 70% of PEK airport's electricity is sourced from coal) yields a smaller GHG percentage reduction for each scenario, irrespective of the other parameters of gate operation.
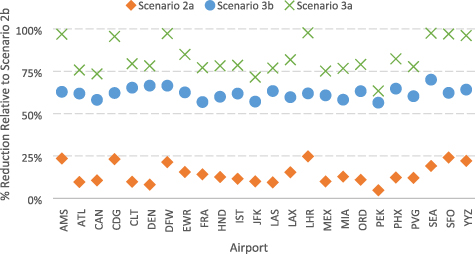
Figure 3. Reductions in life-cycle GHG emissions per average gate operation for each case-study airport, relative to scenario 2b (30% APU utilization per operation, diesel-powered PCA). Scenarios 2a/2b utilize the APU 30% of the time per operation. Scenarios 3a/3b do not rely on the APU. Scenarios 2a/3a utilize the electric PCA for meeting thermal comfort requirement. Scenarios 2b/3b utilize a diesel-powered PCA for meeting thermal comfort. Mitigation potential increases for scenarios where electricity is used for most or for the entirety of the gate operation. Higher mitigation potential is correlated with airports supplied with relatively low-carbon electricity. Airport acronyms are found in figure 2.
Download figure:
Standard image High-resolution imageFigure 4 indicates the breakdown of GHG emissions by life-cycle component for scenario 2a when the 400Hz cable and the electric PCA are utilized for approximately 70% of an average gate operation. Breakdowns by life-cycle component for the remaining scenarios are provided in Figures S5 through S7 in section S2.3 in the SI. Operating emissions from the APU dominate. Across all airports, emissions from equipment manufacturing are not as dominant on a per-gate-operation basis. The relative total emissions per gate operation across each airport do not necessarily matter in terms of understanding the efficacy of gate electrification in mitigating GHG emissions. That is, it does not matter that SFO's gate emissions for Scenario 2a are greater than CLT's gate emissions because one airport might service different aircraft types and trip lengths. It is significant that when airports have low-carbon electricity supplies, GHG emissions from using equipment that exclusively rely on electricity are minimally represented in the total. This point is further emphasized in figure 5, which shows the breakdown by operating and manufacturing emissions for scenario 3a when 100% gate electrification occurs for each turnaround operation. The results in figure 5 suggest that complete electrification coupled with low-carbon electricity supplies can diminish the climate impact from extensive turnaround operations. That is, the gate emissions from a relatively longer turnaround operation in an airport with a clean electricity mix will likely be less than those of a shorter operation at an airport with a dirtier mix.

Figure 4. Sample breakdown of GHG emissions per average gate operation by life-cycle stage for scenario 2a. Total emissions per gate operation depend upon the utilization of each equipment type, the electricity supply, and the airport's aircraft fleet composition and frequency of flights. Emissions from operating the APU dominate the share of total emissions.
Download figure:
Standard image High-resolution image
Figure 5. Sample breakdown of GHG emissions per average gate operation by life-cycle stage for scenario 3a (100% gate electrification). For airports with low-carbon electricity supplies (e.g. AMS, DFW, LHR, SEA, SFO, YYZ), the share of emissions from the electricity-operated equipment is minimized. Emissions from the electric-powered PCA dominate the total share of emissions.
Download figure:
Standard image High-resolution image3.2. Effect of ambient air temperature on GHG emissions
Between the 400 Hz unit and the PCA unit, the PCA dominates the share of GHG emissions per gate operation. What role does ambient air temperature play in increasing the GHG impacts from PCA utilization? The temperatures that trigger heating and cooling activation are close (e.g. less than 7.2 °C for heating and greater than 10 °C for cooling). According to these temperature bounds, seven of the case-study airports (CAN, LAS, LAX, MEX, MIA, PHX, SFO) operate under 100% 'hot weather' conditions where the PCA is activated for cooling for every gate operation. In hot weather, the PCA units consume energy at a higher rate because it takes more work to cool down air than it does to heat it up. A sensitivity analysis demonstrates that the electricity mix plays a more significant role than ambient air temperature in the total GHG emissions per gate operation (section S6 in SI).
3.3. Significance of gate electrification relative to aviation activities
We use the average gate operation emissions for a domestic flight between SFO and LAX airports and compare them to previous data on the life-cycle emissions from a flight operation between SFO and LAX airports (Chester and Horvath 2012). Total emissions for a flight between Point A and Point B are equal to the sum of gate-operation emissions and flight-operation emissions. When the APU is used for the entire aircraft turnaround duration, gate operation emissions account for 25% of total operation emissions. For a completely electrified turnaround operation, gate operation emissions comprise a mere 0.3% of total Point A to Point B emissions. In this specific example of a typical short-haul flight, GHG emissions from gate operations are significant, particularly for operational scenarios where the APU is utilized. Further research relating life-cycle GHG emissions from flights to life-cycle GHG emissions from gate (and other airport) operations would be necessary to determine their comparative impacts and find ways of reducing emissions.
3.4. Economic results for case-study airports
The payback periods for each operational scenario for the 24 case-study airports are shown in figure 6. A shorter payback period means that the investor earns a quicker return on their investment. Scenario 2b (partial gate electrification with diesel-powered PCA units) results in the longest payback period among the four operational scenarios. For locations where diesel fuel costs are relatively high, which is true for many European airports due to higher taxes (US DOE 2020), the payback periods for Scenario 2b are considerably longer than for the other scenarios. In locations with relatively cheap fuel, as is the case for most North American airports, there is little difference in payback period among the four scenarios. Across all airport locations, Scenario 3a yields the shortest payback period. Complete gate electrification is the best investment according to the payback period metric.

Figure 6. Payback period (in years) for each case-study airport implementing the necessary infrastructure to switch from scenario 1. The payback period ranges from less than 1 year to under 2 years for most of the airports. Greater variability in payback period is apparent for many of the European airports where fuel costs are higher relative to fuel costs in North America and Asia.
Download figure:
Standard image High-resolution imageResults for average annual savings and levelized annual costs, both in constant, 2019 United States dollars ($), are provided in Tables S27 and S28 in the SI. Over the 20 year lifespan of the gate electrification equipment, airport stakeholders (i.e. airlines, airport operators) would be expected to pay around $14 million in levelized annual costs for scenario 3a, compared to $24 million for Scenario 3b, $28 million for scenario 2a, and $35 million for scenario 2b. Compared to the estimated state of current practice (i.e. scenarios 2a and 2b), scenario 3a has the lowest levelized annual costs and the greatest annual savings.
3.5. Climate economic damages for case-study airports
The average climate economic damages per gate operation are shown in figure 7. Implementing scenario 3a (100% gate electrification) results in the lowest climate economic damages across all 24 airports, regardless of the airport's electricity supply or aircraft fleet composition. In locations with electricity supplied from low-carbon sources, 100% gate electrification results in quite low climate economic damages. More variability in climate economic damages among the airports is exhibited for Scenario 1 than for the other four operational scenarios. That variability is caused by factors such as the aircraft fleet mix, the total number of flights, and the duration for which an aircraft is parked at a gate. The reduced variability in damages across the busiest 24 global airports for the other scenarios suggests that implementing gate electrification dampens the effects from factors such as fleet mix and turnaround duration. The total annual damages from global warming potential of GHG emissions for each scenario for the 24 airports are provided in table S29 in the SI. Average annual damages per airport for scenario 3a are $1.4 million compared to $2.9 million for scenario 3b, $6.2 million for scenario 2a, $7.2 million for Scenario 2b, and $17 million for scenario 1. Relative to scenarios 2a and 2b, which stand as an approximate range for current practice, the average annual avoided damages from complete electrification at an airport is between $5 million and $6 million. It is not unreasonable to expect similar annual climate economic damages for other major international airports not included in the case-study analysis.
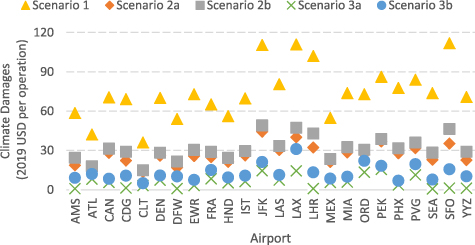
Figure 7. Climate economic damages per average gate operation for 24 case-study airports. Damages are the lowest for scenario 3a (complete electrification) and airports with relatively low-carbon electricity supplies. Damages from Scenario 1 (complete APU utilization) are more variable across the 24 airports, compared to damages from the other scenarios. This suggests that electrification dampens impacts from unique airport characteristics such as aircraft fleet composition, total number of flights, and turnaround duration.
Download figure:
Standard image High-resolution image3.6. Uncertainty assessment
The uncertainty of the data we use for the environmental, economic, and climate damage analyses are evaluated using the Pedigree matrix approach. Pedigree matrices are used in LCA studies to assess the uncertainty of data (Ciroth et al 2016). Uncertainty is scored according to how reliable and complete the data are, how old the data are, what locations the data reflect, and whether the data apply specifically for the entity, process, or material being studied.
We evaluate the uncertainty in electricity and air temperature data. We explore the uncertainty related to the flight operational data, the cost data for electricity, fuel, and equipment, and the jet/diesel fuel emission factor data. We also estimate the quality of the power consumption and manufacturing data for the 400 Hz, PCA, APU, and PBB equipment. Section S7 in the SI shows the Pedigree matrices for each of the evaluated data categories.
We find from the results of the Pedigree matrix that the uncertainty associated with the electricity, air temperature, flight operational data, and power consumption data is low. The uncertainty of the jet/diesel fuel emission factors and cost used in the analysis is moderately low. The uncertainty of the PBB manufacturing data is low, while the uncertainty for the 400 Hz and PCA manufacturing data is moderate. Overall, the results indicate that uncertainty associated with the data is relatively low. The results of the study represent a reasonable assessment of the life-cycle GHG, economic, and climate damage impacts from gate electrification at commercial airports.
3.7. Global GHG emissions reduction potential
When extending the analysis to account for the 2354 airports that are responsible for the majority of global commercial traffic, the results confirm that the greatest cumulative reductions in life-cycle GHG emissions occur with scenario 3a. Figure 8 shows, by scenario, airport size, and region, the annual mean, minimum, and maximum GHG emissions. The share of emissions by airport size is approximately the same for each scenario. Large Airports are responsible for approximately 49% of annual GHG emissions from gate operations. Medium Airports account for around 41% of total GHG emissions, and Small Airports are responsible for roughly 10% of annual GHG emissions. Large and Medium Airports in Asia, Europe, and North America have the largest annual emissions. Asia and North America dominate in the Small Airports category. In general, the majority of GHG emissions are attributable to airports in Asia, North America, and Europe, highlighting the importance of greening the electricity supplies in those regions in order to increase the mitigation potential of gate electrification. Electrifying all turnaround operations for the 2354 commercial airports in the world would save, relative to the estimation of current practice (i.e. Scenarios 2a and 2b), on average between 10 and 12 million metric tons of GHG emissions annually. To provide some perspective, these savings are conservatively 1% of global aviation emissions (Graver et al 2019) and 3% of California's annual anthropogenic GHG emissions (CARB 2021). Given the relative GHG contributions of other economic activities (e.g. the cement industry), the carbon contribution from parked aircraft operations is not insignificant.

Figure 8. Annual life-cycle GHG emissions by scenario, airport size, and region. Regions: AF = Africa; AS = Asia; EU = Europe; LA = Latin America; NA = North America; ME = Middle East; RU = Russia; SP = Southwest Pacific. 'Ops' refers to the number of turnaround (or gate) operations that occur on an annual basis. In general, the majority of GHG emissions are attributable to airports in Asia, North America, and Europe, highlighting the importance of greening the electricity supplies in those regions in order to increase the mitigation potential of gate electrification.
Download figure:
Standard image High-resolution image
4. Discussion
Electrifying aircraft turnaround operations results in reductions in life-cycle GHG emissions, levelized annual costs, and monetized climate damages at commercial airports worldwide. Complete electrification (i.e. scenario 3a) yields the greatest reductions even across differing geographic regions and airport sizes. It represents a feasible, deployable, and affordable opportunity for significant GHG emissions reductions. Although not considered in the context of this analysis, there should be a concerted research effort to investigate practical questions associated with using gate electrification equipment and how this might impact emissions. For example, how might pilot or ground crew and maintenance procedures impact equipment utilization? How might emissions be impacted with different system configurations such as centralized boilers and chillers?
Under complete electrification, for the 24 case-study airports, the annualized capital cost per metric ton of GHG emissions removed is between $25 and $30 with no discernible difference between U.S. and non-U.S. airports (see section S8 in SI). For the 2354-airport dataset (which uses less specific data than the 24 case-study airports; see section S5 in SI), it would cost $2 billion to electrify gates at all U.S. airports and $8 billion at all other airports. As a mitigation opportunity, the annualized capital cost per metric ton of GHG emissions removed ranges between $60 and $70 for U.S. airports and between $80 and $90 for all other airports. These estimated costs per mitigated emissions can be compared to current, local carbon-market prices in Shanghai ($6 per metric ton), California ($16 per metric ton), Canada ($23 per metric ton) and Sweden ($126 per metric ton) (World Bank Group 2019). Furthermore, these mitigation costs are relative to scenarios 2a/2b where gate electrification equipment is on average used for 70% of every parked gate operation. Benefits from 100% electrification could potentially be even lower if in practice the gate electrification equipment is utilized less efficiently. When considering that capital costs will be recuperated within a couple of years, gate electrification is a prudent mitigation opportunity.
While other transportation sectors could decarbonize mainly through electrification, it will be difficult for the aviation sector (airlines) to reduce emissions because of the challenges associated with electrifying aircraft, especially large ones. Challenges with completely electrifying commercial aircraft fleet, particularly aircraft used in long-haul flights, stem from current limitations in battery capacity (Baumeister et al 2020) as large power amounts are required for the landing and take-off phases of flight (Epstein and O'Flarity 2019). The aviation industry needs to act to reduce its GHG emissions. Impacts from increased anthropogenic GHG emissions have dire consequences. The effects from droughts, wildfires, hurricanes, and sea level rise will lead to physical property damage to both infrastructure and natural ecosystems. Additional effects from climate change, which will be distributed unevenly across populations, include increased water scarcity, food insecurity, heat stress events, and economic vulnerability (Pachauri et al 2014). By consistently integrating gate electrification at all commercial airports, the aviation industry can actively mitigate future deleterious effects from climate change.
Gate electrification, in addition to reducing GHG emissions, improves air quality on the airport apron. Reduced exposure to air pollutants such as PM is a human health benefit for passengers, airport employees, and communities living within proximity of an airport. However, in locations where electricity is supplied by fossil fuel sources, such as coal, and where demand for air conditioning is high, the air quality burden stemming from gate turnaround operations is just shifted to communities living near electric power plants. Exploring that scenario is beyond the scope of this research, but it demonstrates the need to apply systems-level thinking to ensure that policies intended to improve one infrastructure system do not have unintended consequences for another.
Acknowledgments
F G and J R would like to thank Groupe ADP for providing funding support and data. F G would like to thank Paris Charles de Gaulle Airport, San Francisco International Airport, and Boston Logan International Airport for providing data. F G and J R thank Linda Perry of LeighFisher for providing data used in the analysis. We appreciate the help of Kevin Taylor in analyzing the data from Groupe ADP. We extend our appreciation to the following airports for responding to information requests: SEA, LAS, LAX, PHX, CLT, JFK, EWR, YYZ.
Data availability statement
All data that support the findings of this study are included within the article and the supplementary information files.