

Abstract
Peninsular Indian agriculture and drinking water availability are critically reliant on seasonal winter rainfall occurring from October to December, associated with the northeastern monsoon (NEM). Over 2016–2018, moderate-to-exceptionally low NEM rainfall gave rise to severe drought conditions over much of southern India and exacerbated water scarcity. The magnitude and dynamics of this drought remain unexplored. Here, we quantify the severity of this event and explore causal mechanisms of drought conditions over South India. Our findings indicate that the 3-year cumulative rainfall totals of NEM rainfall during this event faced a deficit of more than 40%—the driest 3-year period in ∼150 years according to the observational record. We demonstrate that drought conditions linked to the NEM across South India are associated with cool phases in the equatorial Indian and Pacific Oceans. Future changes in these teleconnections will add to the challenges of drought prediction.
Export citation and abstract BibTeX RIS

Original content from this work may be used under the terms of the Creative Commons Attribution 4.0 license. Any further distribution of this work must maintain attribution to the author(s) and the title of the work, journal citation and DOI.
1. Introduction
Deficiency of the summer monsoonal precipitation is one of the main drivers of meteorological drought in India, which if prolonged, can transform into more impactful agricultural and hydrological droughts (Mishra and Singh 2010, Mishra et al 2010, Mo 2011). Agricultural and hydrological droughts can pose lasting impacts on food production and water availability, respectively (Van Loon 2015, Samaniego et al 2018, Mishra 2020). India experiences two major monsoon seasons—the Indian summer monsoon (ISM), also known as the southwestern monsoon and the lesser-studied northeastern monsoon (NEM) or the winter monsoon (Gadgil and Gadgil 2006, Rajeevan et al 2012). The ISM is the major source of precipitation for much of India over the period of June to September (hereafter JJAS) and has been the focus of extensive study (Gadgil and Gadgil 2006, Singh et al 2019). On the other hand, the NEM is more important in selected parts of India and is associated with rainfall during the period between October and December (hereafter OND) (Kripalani and Kumar 2004, Zubair and Ropelewski 2006, Yadav 2012). In particular, the NEM significantly impacts peninsular India, where certain parts of South India receive a majority of their annual rainfall totals during the OND season (Rajeevan et al 2012). Despite lesser precipitation totals compared to the ISM, the NEM is critically important for water availability, agriculture, and the livelihood of millions of people residing in peninsular India.
Previously, studies have indicated that both monsoon seasons have experienced profound changes over the past few decades (Mishra et al 2012, Rajeevan et al 2012, Roxy et al 2015, Singh et al 2019). For instance, seasonal mean precipitation associated with the ISM has shown a declining trend leading to more frequent monsoon-season deficits (Mishra et al 2012, Christensen et al 2013, Roxy et al 2015). Similarly, the increase in precipitation associated with the NEM over the last few decades has been attributed to the warming of the Indian Ocean (Mishra et al 2012, Roxy et al 2015). Furthermore, the El Niño Southern Oscillation (ENSO) and Indian Ocean Dipole (IOD) phenomena are well-known drivers of deficits in monsoon rainfall (Ashok et al 2001, Kumar et al 2007) and are also expected to undergo changes with ongoing increases in greenhouse gases (Cai et al 2018, Timmermann et al 2018). Addressing the mechanisms of why and how these monsoon seasons are shifting under a warming world is critical for improving predictions of drought conditions in India.
Whereas previous studies have shown strong linkages between summer monsoon droughts in India and sea surface temperature (SST) variability in the equatorial Indian and Pacific Oceans (Kripalani and Kulkarni 1997, Barlow et al 2002, Niranjan Kumar et al 2013, Roxy et al 2015), few studies have focused on the causes of rainfall deficits associated with the NEM (Dimri et al 2016). From 2016 to 2018, South India witnessed severe drought conditions, which significantly impacted agriculture and water availability in the region ('Chennai water crisis: City's reservoirs run dry,' BBC 2019). The densely populated states of Andhra Pradesh, Karnataka, and Tamil Nadu continuously declared drought in 2016, 2017, and 2018 related to the deficits in NEM precipitation. The drought caused water crises in both urban and rural areas (Aguilera 2019). Despite the profound impacts of the 2016–18 drought in South India, its magnitude, drivers, and mechanisms remain unexplored. In this study, we focus on the 2016–2018 drought, quantify its severity, and investigate its causes and relationships with regional and global ocean–atmosphere variability. We place this extreme event in the context of the previous droughts and conclude that its severity was unprecedented over the observational record.
2. Data and methods
The NEM (October–December) is a dominant source of rainfall in South India (Rajeevan et al 2012). South India (Latitude: 8°N–15°N; Longitude: 74°E–81°E)) comprises of five Indian states and three union territories. The region encompasses nearly 19% of India's area and harbors around 250 million people, which is one-fifth of the total population of India (Census of India 2011). South India is an agriculturally rich part of the country, with over 60% of its rural population engaged in agriculture (Aulong et al 2012). The population depends largely on the NEM for agricultural production. We used gridded daily precipitation data available at 0.5° spatial resolution for the period of 1870–2018 (Mishra et al 2019). Mishra et al (2019) used station observations from India Meteorology Department (IMD) to develop the gridded precipitation for the pre-1900 (1870–1900) period, which was merged with the gridded data available for the post-1900 period (1901–2018; (Pai et al 2014)) from IMD. More details on the gridded precipitation data and evaluation of its quality can be obtained from Mishra et al (2019). The gridded data capture orographic precipitation along the Western Ghats, Northeast, and the foothills of Himalaya (Pai et al 2014, Mishra et al 2019).
Total water storage (TWS) data were obtained from the Gravity Recovery and Climate Experiment (GRACE) and GRACE follow on (GRACE-FO) missions. TWS is available for the period April 2002 to June 2017 from the GRACE satellites. The GRACE-FO mission provides the data from June 2018 to present. Therefore, the TWS data for July 2017 to May 2018 is not available. We obtained TWS from GRACE and GRACE-FO from NASA's Jet Propulsion Lab (JPL: https://podaac.jpl.nasa.gov/dataset/TELLUS_GRAC-GRFO_MASCON_CRI_GRID_RL06_V2) for the 2002–2019 period. The GRACE mascon product (RL06 V2) contains gridded monthly global water storage anomalies relative to mean, which is available at 0.5° spatial resolution (Wiese et al 2016). To remove the seasonal cycle from TWS, monthly mean TWS was removed from each month, and scale factors were applied.
To assess the influence of SSTs on the 2016–18 drought, we used monthly data from the HadSST dataset (Hadley Centre) for the period 1870–2018 at 2.0° spatial resolution (Rayner et al 2003). We obtained surface air temperatures (SATs) from Berkley Earth (Rohde et al 2013) to analyze anomalous temperature conditions during NEM droughts. Since SST data has a strong warming trend, we used Ensemble Empirical Mode Decomposition (EEMD; (Wu and Huang 2009)) to remove the secular trend (Wu et al 2011) from SST time series as in Mishra (2020). The EEMD method has an advantage over conventional detrending as it removes both linear and non-linear trends (Mishra 2020). We estimated SST and precipitation anomalies for the NEM (October–December) to diagnose the linkage between precipitation and SST. To examine the coupled variability of precipitation and SST, we use maximum covariance analysis (MCA; (Bretherton et al 1992)). In addition, we used empirical orthogonal function (EOF) analysis to obtain the dominant modes of variability in rainfall during the NEM when SST was not used. The MCA, performed on two fields (here precipitation and SST) together, identifies the leading modes of variability in which the variations of the two fields are strongly coupled (Mishra et al 2012). Sea level pressure (SLP) and wind fields (horizontal, u and meridional, v) were obtained from the European Centre for Medium-Range Weather Forecasts Reanalysis version 5 (ERA-5; (Hersbach and Dee 2016)) for the period 1979–2018 to understand the mechanism of the northeast monsoon. Further, SLP and wind fields were regridded to 2° to make them consistent with SST.
Towards predictability of NEM rainfall, we employed univariate and multivariate techniques. We use the lagged relationship between SST anomalies and rainfall over South Asia during the NEM as a predictor of OND rainfall. We used SST anomalies from the Nino 3.4 region and over the northern Indian Ocean (NIO; 6°–24°N, 40°–100°E) as a predictor of monthly NEM precipitation using the following three equations:


where ROND is rainfall during October-December (OND) over South India, Nino3.4AMJ is April-June (AMJ) SST anomalies over the Nino 3.4 region, SST-NIOOND is SST anomalies during OND over the northern Indian Ocean (NIO), a and b are the regression coefficients, and  is the residual.
3. Results
3.1. Unprecedented recent failure of northeast monsoon rainfall
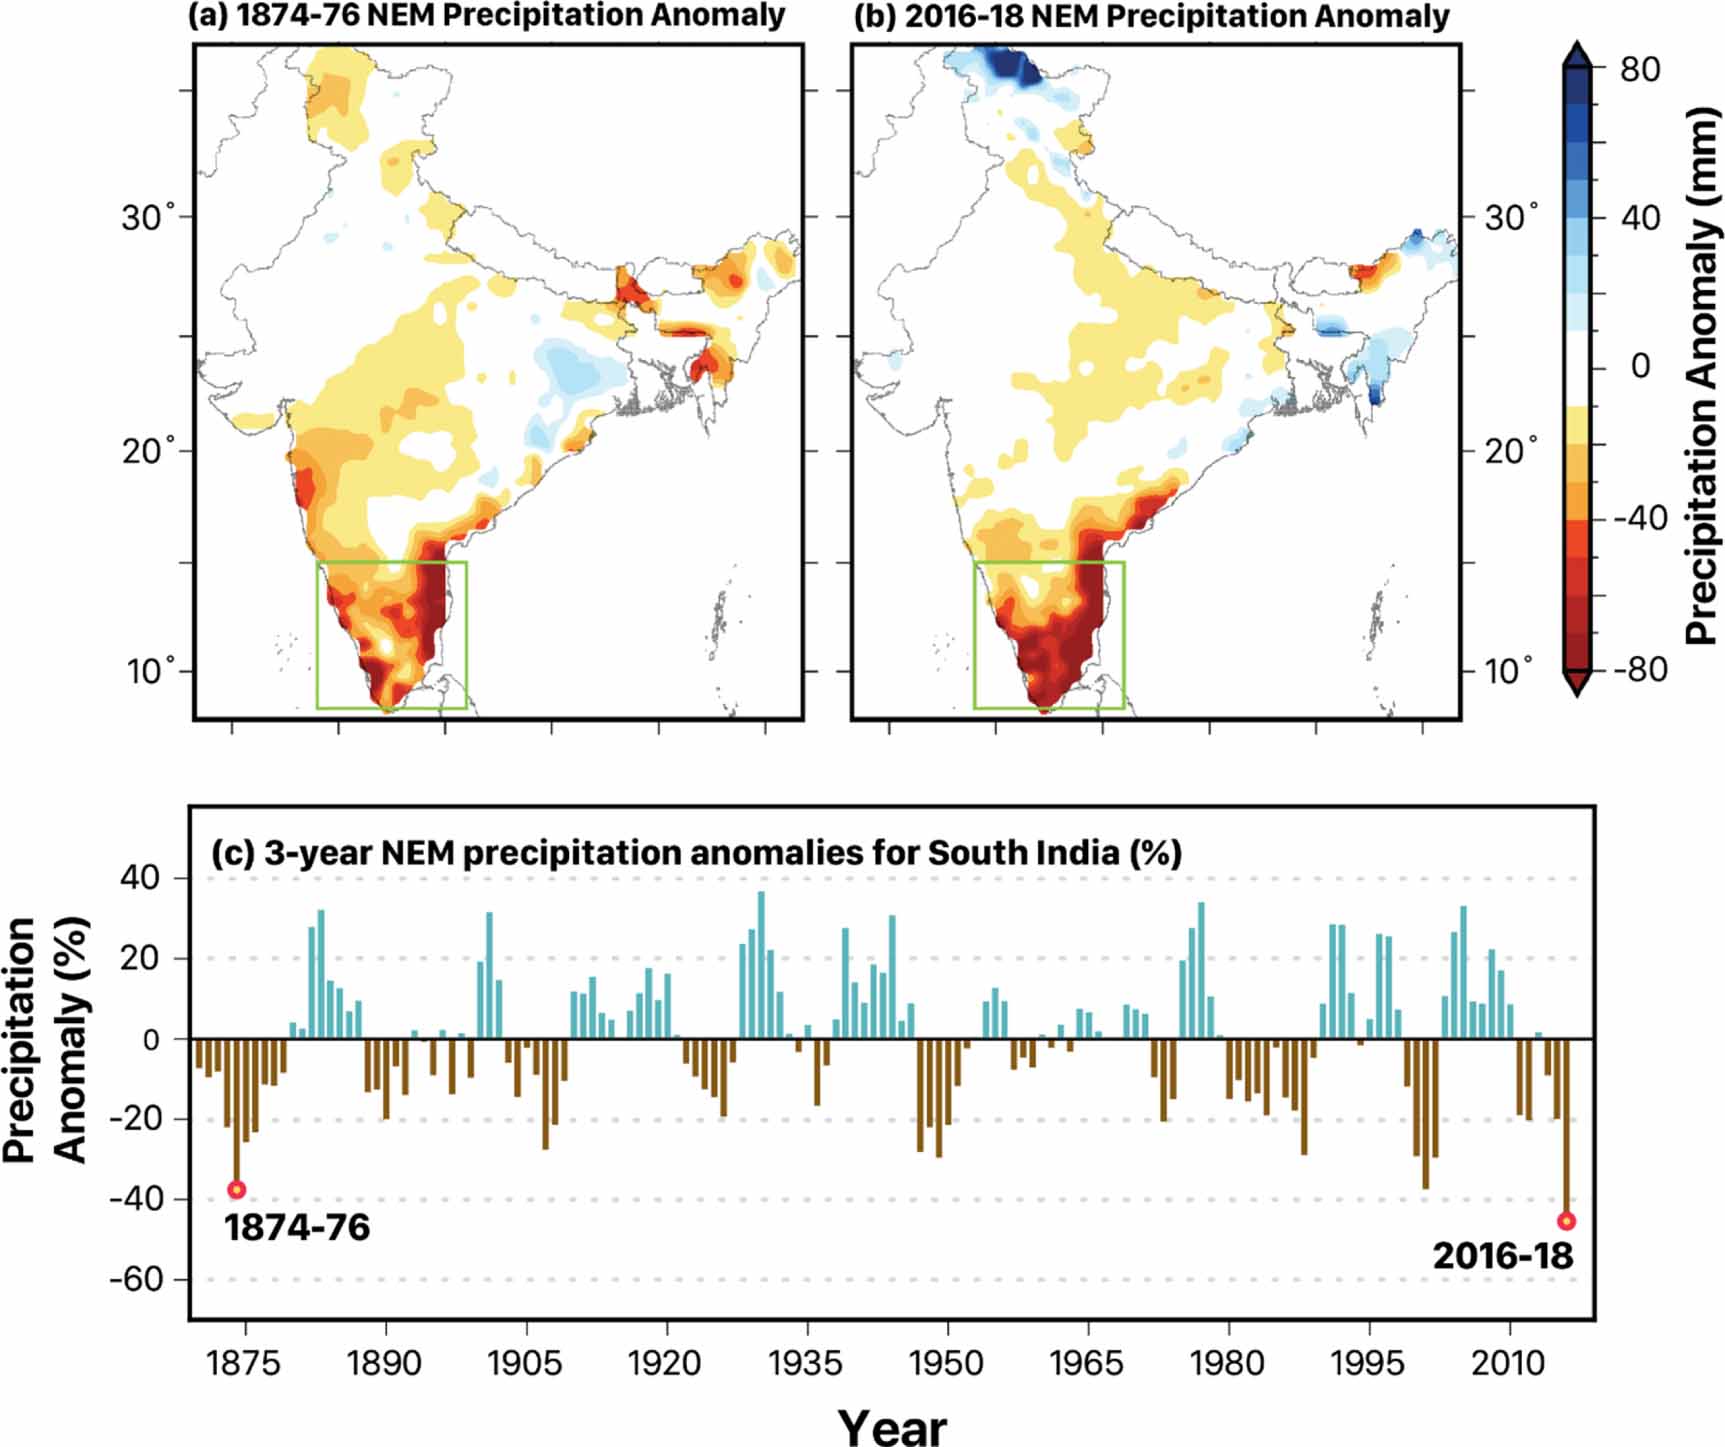
South India receives more than 40% of its total annual precipitation during the NEM season (figure S1 (available online at stacks.iop.org/ERL/16/054007/mmedia)), and thus deficits in NEM rainfall pose significant water-related challenges in the region. To investigate the long-term observational history of NEM rainfall in the region, we used rainfall observations from the IMD (Pai et al 2014), spanning from 1870 to 2018. Domain-averaged precipitation anomalies associated with the NEM indicate that most of South India experienced exceptional (>40%) precipitation deficits during 1874–1876 and 2016–2018 (figure 1). We calculated precipitation anomalies during the NEM for one, two, and three consecutive year durations over the 1870–2018 period to estimate abnormal deficit-years in the long-term record (figures 1, 2 and S4, table 1). There are five pronounced periods of drought (>29% deficits) in the overall record including the recent drought of 2016–2018, the droughts during 2001–03, 1949–1951, 2002–04, and the well-known Great Drought of 1876–78 (Cook et al 2010, Singh et al 2018), which was associated with the Great Madras Famine (Blanford 1884, Mishra et al 2019). Among these events, our analysis indicates that the Great Drought and the recent event of 2016–18 are the most severe (figure 1). During 2016–18, South India experienced the worst NEM drought over the last 150 years with a precipitation deficit of 45%, whereas the 1874–76 drought was the second-worst, with a deficit of 37% (table 1). We note that the 1-year and 2-year duration NEM deficits for 1876 (69%) and 1876–77 (54%) were comparable to the deficits during 2016 (63%) and the 2016–17 (52%) durations (table 1, figures S2–S4). However, the consecutive 3-year NEM deficit for 2016–18 was more significant than the Great Drought. We find that annual rainfall anomalies additionally indicate drought conditions in 2016, 2017, and 2018 (figure S5). Moreover, 2 and 3-year annual rainfall anomalies for 2016–17 and 2016–18 also show a major rainfall deficit in South India (figure S5). Thus, we conclude that the 2016–18 drought caused by the failure of the NEM also contained severe annual rainfall deficits.
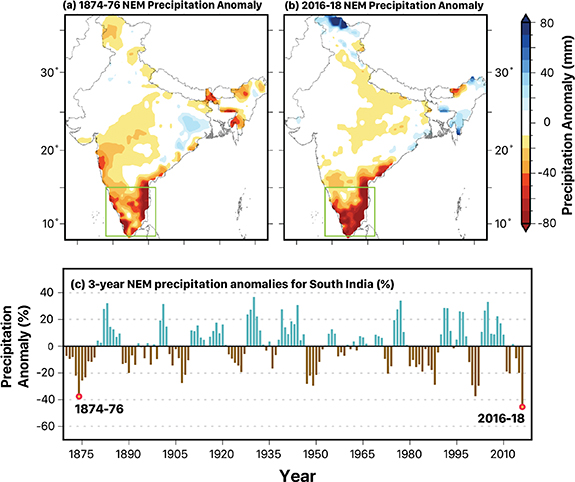
Figure 1. Three-year cumulative precipitation anomalies (mm) during the Northeast monsoon (NEM, October–December). (a), (b) The spatial pattern of 3 year cumulative precipitation anomalies (mm) during 1874–1876 and 2016–2018 periods, respectively, in southern India (denoted by the green box). (c) Area-averaged (over the green box) 3 year moving-mean precipitation anomalies (%) for the period 1870–2016. Red dots in (c) demarcate the two periods of interest, and show that the 2016–18 was the 1st and 1874–76 was the 2nd worst drought in last 150 years. Long-term precipitation data is based on station observations from the Indian Meteorological Department (IMD).
Download figure:
Standard image High-resolution image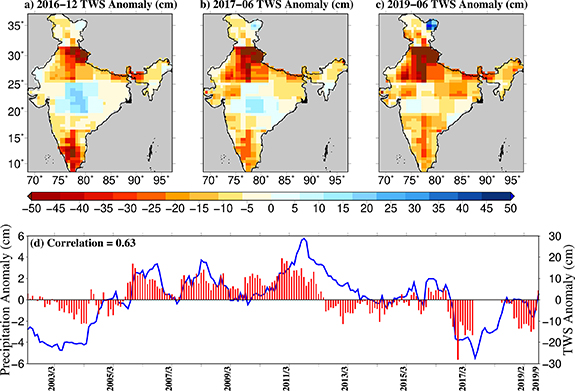
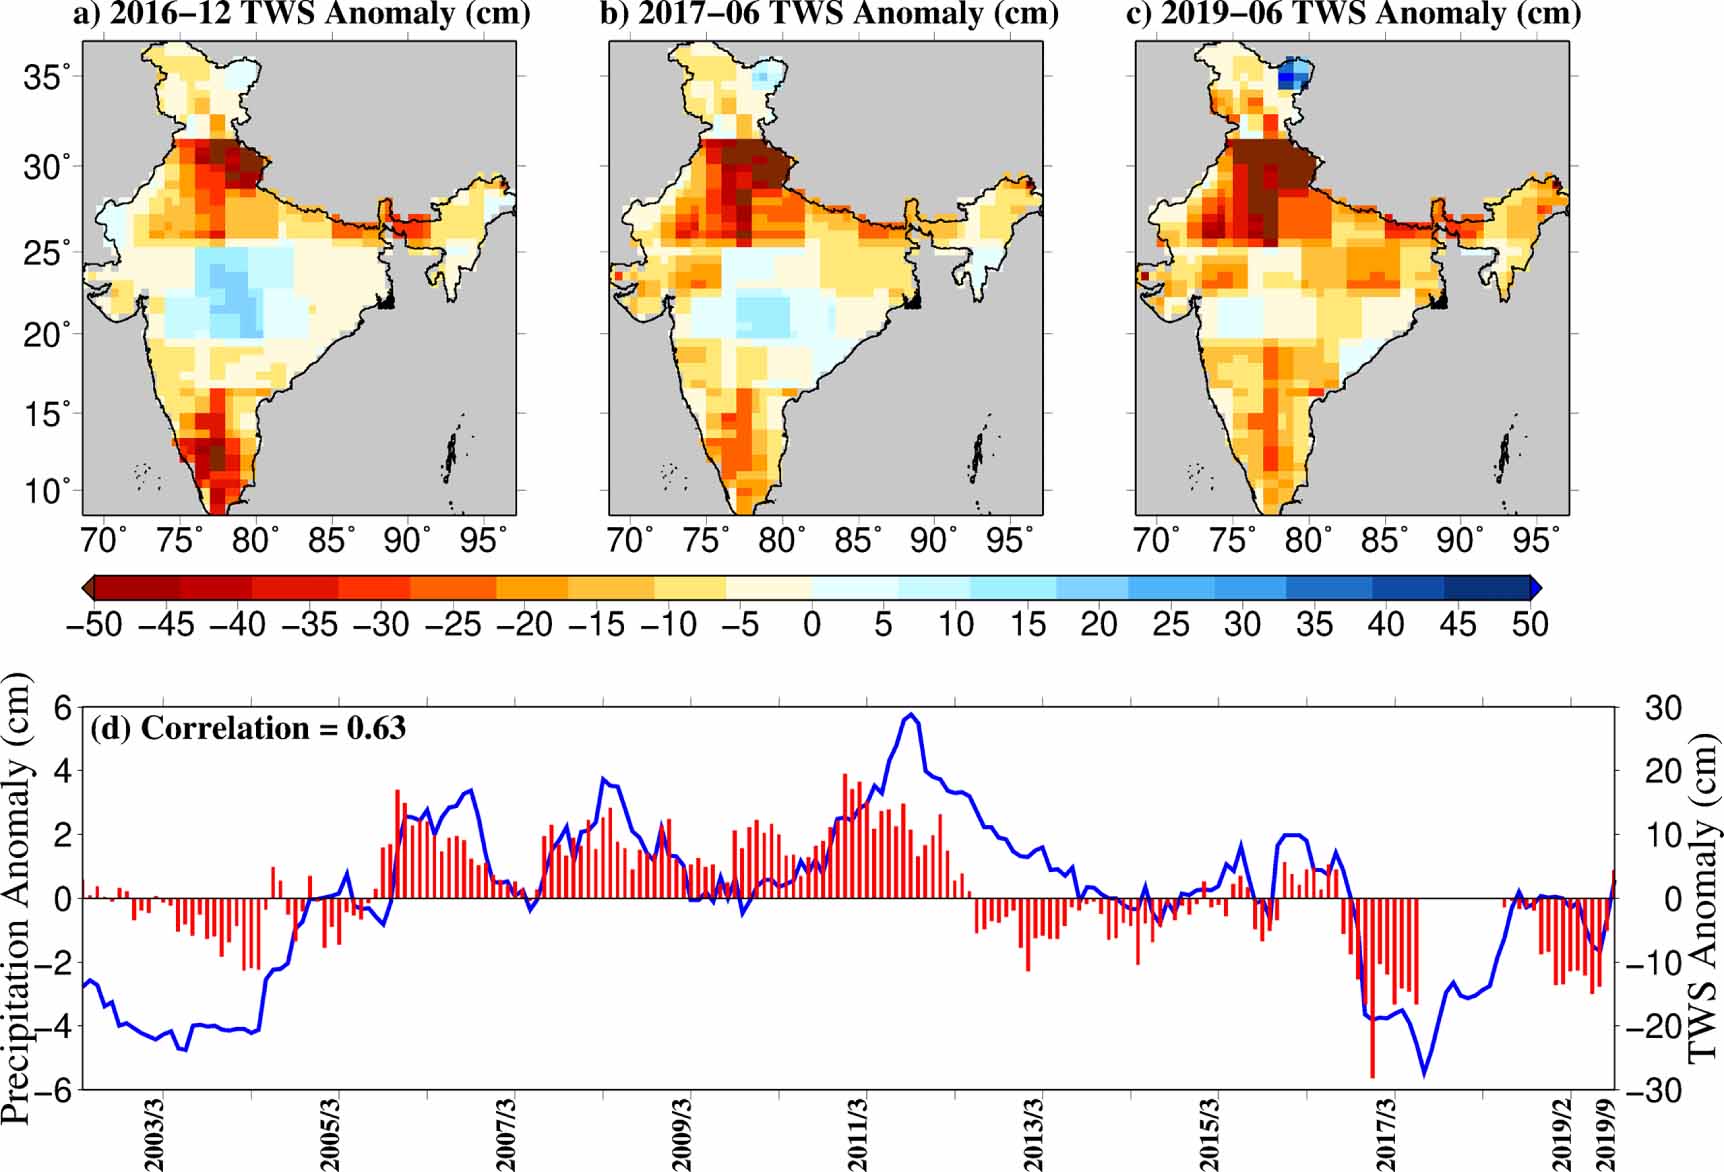
Figure 2. Total water storage (TWS) anomalies from the GRACE and GRACE–FO during 2002–2019. (a)–(c) TWS anomalies (cm) during December 2016, June 2017, and June 2019. (d) 12-month moving-sum precipitation anomalies (cm, in blue) and monthly TWS anomalies (cm, in red) aggregated over South India (south of 15°N). Note that the July 2017 to May 2018 period contains missing data as the GRACE-FO dataset is only available from June 2018 onwards. The Pearson correlation coefficient between TWS anomalies and precipitation anomalies is 0.63.
Download figure:
Standard image High-resolution imageTable 1. Top five driest years for one, two, and three-year cumulative northeast monsoon (OND).
| 2 year cumulative | 3 year cumulative | ||||
|---|---|---|---|---|---|
| Drought year | Precipitation anomaly (%) | Drought year | Precipitation anomaly (%) | Drought year | Precipitation anomaly (%) |
| 1876 | −68.82 | 1875–76 | −54.37 | 2016–18 | −45.40 |
| 2016 | −62.84 | 2016–17 | −51.73 | 1874–76 | −37.52 |
| 1938 | −59.71 | 1988–89 | −41.29 | 2001–03 | −29.56 |
| 1988 | −53.74 | 2002–03 | −39.50 | 1949–51 | −29.55 |
| 1974 | −49.31 | 1908–09 | −37.91 | 2002–04 | −29.55 |
Over individual NEM seasons, the two most extreme dry events occurred in 1876 and 2016 with precipitation deficits of 69% and 63%, respectively (table 1). The rainfall deficit in 2016 was more severe in comparison to the lack of precipitation in 2017 and 2018 (figure S2). The failure of the NEM in 2016 as well as relatively low rainfall totals over the consecutive years were the main causes behind the 2016–18 drought in South India (table 1). Overall, the 3-year NEM drought of 2016–2018 was more severe than the Great Drought of 1874–1876. Infamously, the 1876 drought resulted in famine and the deaths of millions of people (Mishra et al 2019, Mishra 2020). The more recent 2016–18 NEM drought considerably influenced water availability in the region and caused a water crisis across South India ('Chennai water crisis: City's reservoirs run dry,' BBC 2019).
Furthermore, the 2016–2018 NEM drought in South India was unprecedented in the last 150 years and had severe implications for water availability. TWS from the GRACE and GRACE–FO satellites showed a considerable loss in South India due to the recent (2016–2018) drought (figure 2). Twelve months moving precipitation anomalies pinpoint the onset of drought in South India during October 2016 and show that it continued till October 2018 (figure 2). Although there was a weak recovery from drought conditions for two months in November and December 2018, these rainfall totals were not enough to negate the influence of the overall event (2016–2018), which continued till August 2019 (figure 2), and was only alleviated by stronger NEM rains later that year. We also note that 12-month precipitation anomalies and TWS anomalies are well-correlated (r = 0.63), where local observations indicate that rainfall is the major contributor of TWS (Asoka et al 2017). Thus, we attribute the loss in regional TWS to the long-term 3-year drought, which was precipitated by the lack of NEM rainfall.
Total water loss in South India estimated from the GRACE satellite was 79 km3 in December 2016 (figure 2(a)). Similarly, GRACE–FO data reveal that total water loss in June 2017 and 2019 was 46.5 and 41.7 km3, respectively (figures 2(b) and (c)). Recovery in TWS occurred in late 2019 due to improved NEM rainfall over the region. The 2016–2018 drought caused a significant loss in TWS, which also likely resulted in a significant depletion in groundwater across South India. We caveat that we did not estimate the overall loss in groundwater due to uncertainty in soil moisture (Long et al 2013, Castle et al 2014)—an estimate outside the scope of this work—however we suspect that the groundwater depletion was driven by the drought in addition to increased groundwater extraction (Thomas et al 2017) during the drought (Asoka et al 2017). Despite the uncertainty in the estimation of total water loss from GRACE satellites (Long et al 2013), the combined influence of depletion in surface-water and groundwater during this event led to unprecedented water scarcity in South India (Aguilera 2019, 'Chennai water crisis: City's reservoirs run dry,' BBC 2019).
3.2. Mechanism of deficit during the Northeast monsoon
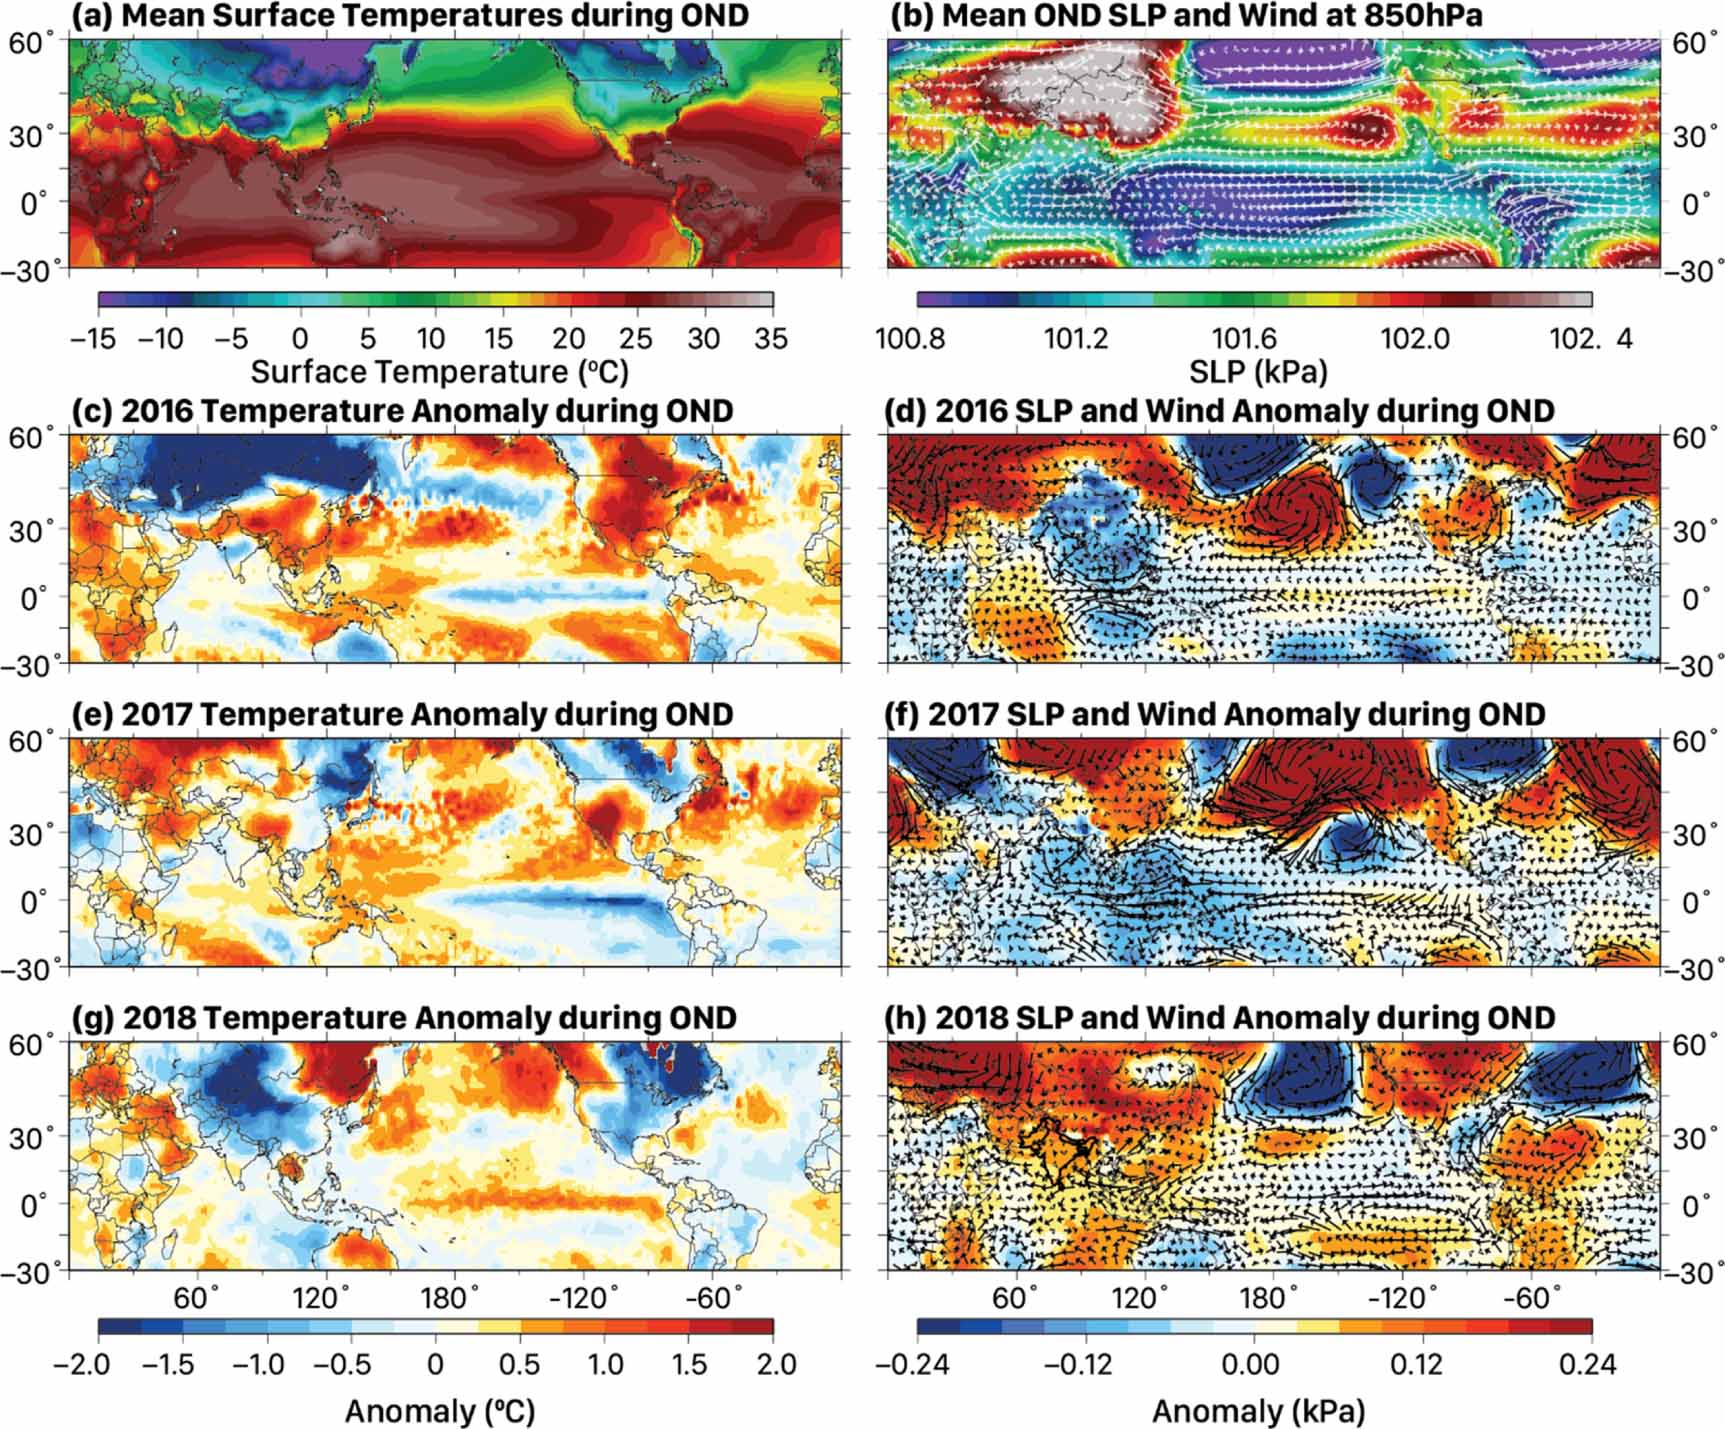
We examined circulation patterns to understand mechanisms behind variability in NEM rainfall. To do so, we first examined climatological surface temperatures (SAT and SST), sea-level pressure (SLP), and wind fields at 850 hPa during the OND season (figure 3). SLP and wind fields were taken from the ERA-5 reanalysis dataset (Hersbach and Dee 2016) whereas SSTs and SATs were taken from HadSST (Rayner et al 2003) and Berkley Earth (Rohde et al 2013), respectively. Climatologically during boreal fall, cooling SATs over the northwestern Pacific and northern latitudes alongside comparatively warmer mean-annual SSTs over the northern Indian Oceans set up easterly wind flow across the Bay of Bengal (figures 3(a) and (b)). In particular, warm SSTs in the western Indian Ocean can elicit easterlies across the Indian Ocean and favor moisture transport from the Bay of Bengal into peninsular India. These moisture-bearing winds, which become northeasterly before landfall, bring NEM rainfall to South India (Rajeevan et al 2012). Strong winds from across the South China Sea, driven by the underlying SAT and SLP patterns ultimately facilitate NEM rainfall. Thus, El-Niño-like conditions in the Pacific with cooler SSTs in the northern portion of the western tropical Pacific Ocean, juxtaposed with cooler SSTs in the eastern Indian Ocean and warmer SSTs in the west (i.e. resembling positive IOD-like conditions), all serve to enhance NEM rainfall over South India. It is to be expected that circulation patterns which weaken these processes ought to yield diminished NEM rainfall.

Figure 3. Atmospheric and oceanic patterns during the 2016–18 drought in South India. (a), (b) Climatological mean surface-air temperature (SAT, °C) and sea-surface temperature (SST, °C), mean sea-level pressure (SLP, Pa) and wind at 850 hPa (in (b)) during the October–December (OND) season. (c), (d) SST, SLP, and wind anomalies associated with the NEM during the OND season of 2016, (e), (f) 2017, and (g), (h) 2018. Mean SLP and wind fields were obtained from ERA-5 whereas SST was taken from HadSST and SAT from BEST.
Download figure:
Standard image High-resolution imageTo better understand the causes of rainfall deficits, we investigated anomalous patterns during the NEM season for 2016, 2017, and 2018 (figure 3). In 2016 and 2017, as expected, cool SST anomalies prevailed in the tropical Indo-Pacific and were associated with La Niña conditions in the central Pacific along with negative IOD-like conditions in the Indian Ocean (figures 3(c)–(f)). Both years witnessed anomalously cooler SSTs in the eastern tropical Indian Ocean and western tropical Pacific, and warmer SSTs in the western Indian Ocean and central Pacific. These SST patterns, alongside SLP and adjacent continental SAT patterns, gave rise to anomalous westerlies in the equatorial Indian Ocean, which weakened moisture transport from the Bay of Bengal during the NEM season of both events (figures 3(c)–(f)). Moreover, both years were associated with anomalously low SLP and cooler surface temperatures across the Indian sub-continent and Bay of Bengal, sustaining an anomalous anticyclonic pattern which inhibited moisture transport into South India (figures 3(c)–(f)). In 2018, the rainfall deficit conditions were slightly alleviated due to favorable warm conditions in the western tropical Indian Ocean and cooling in the East (development of a positive IOD event) alongside the development of El-Niño-conditions in the Pacific. However, it should be noted that western Indian Ocean warming was not particularly pronounced that year and alongside cooler temperature anomalies in the northern Indian Ocean, resulted in an overall deficit in NEM rainfall that year.
Next, we analyzed surface temperature and precipitation anomalies for the five most severe dry events in South India over the 1870–2018 period during the NEM season (figure 4). The major droughts in South India occurred in 1876, 2016, 1938, 1988, and 1974 (in order of severity). Out of these five droughts, four occurred during La Niña conditions. In contrast, the well-studied drought of 1876 during the NEM was linked with El Niño (figure 4)—a finding reported previously (Cook et al 2010, Singh et al 2018, Mishra et al 2019). However, it should be noted that cool SST conditions prevailed in the Pacific Ocean over the 1870–1876 period and the transition from the cool to warm phase occurred during the NEM season of 1876 (Singh et al 2018). Additionally, the western Indian Ocean was not anomalously warm as it typically is during El Niño years (figure 4(a)). Nevertheless, temperature and SLP anomaly composites for the most severe dry and wet NEM years reveal a general propensity for cooler SSTs in the Indo–Pacific (i.e. La Niña conditions) to be associated with precipitation deficits over South India (figures S6 and S7). On the other hand, warming in the central Pacific and Indian Oceans is associated with a stronger NEM and surplus precipitation (figure S7). Overall, OND cooling in the Indian and central Pacific oceans results in lower SLP and weaker wind fields, which ultimately drive rainfall deficits in South India.
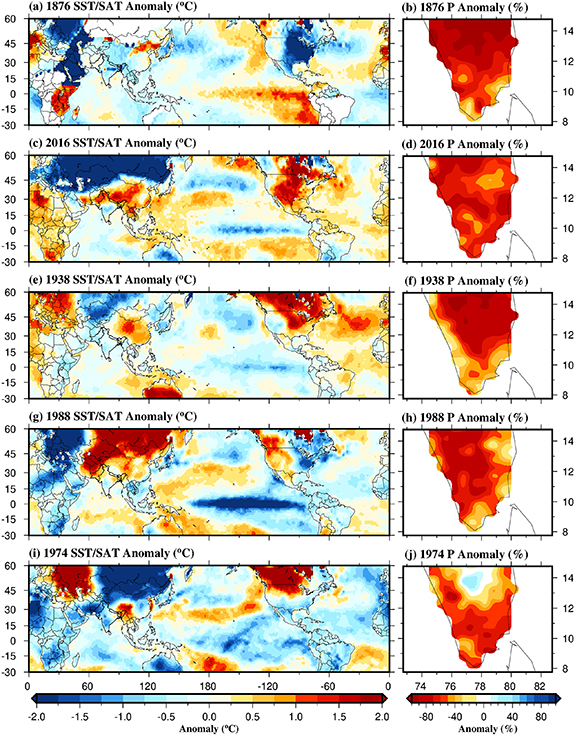
Figure 4. Sea surface temperature (SST)/surface air temperature (SAT) and precipitation (P) anomalies for the top five droughts that occurred in South India during the northeast monsoon for 1870–2018 period. SST and SAT datasets were obtained from Hadley Center and Berkley Earth, respectively. SAT data over few regions are not available for 1876.
Download figure:
Standard image High-resolution image3.3. SST variability during Northeast Monsoon
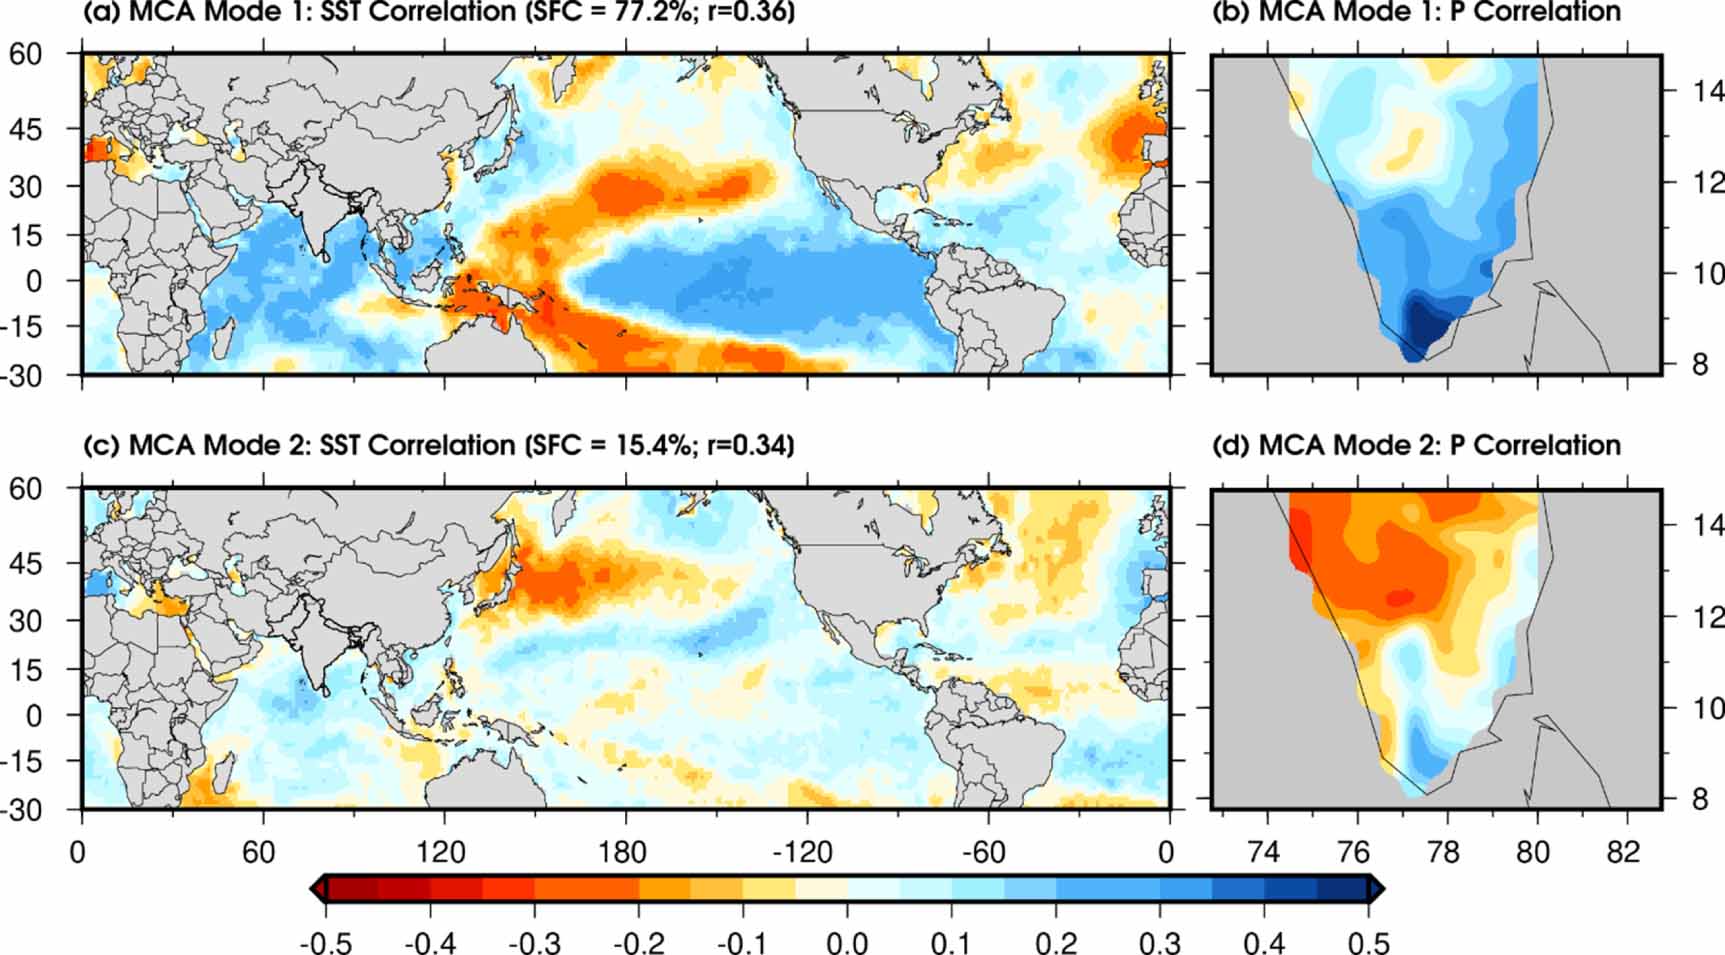
To clarify the relationship between SST and precipitation anomalies associated with the NEM, we performed MCA, which helps delineate the leading patterns responsible for co-variability between South Indian NEM rainfall and tropical SSTs. The first leading mode exhibits typical ENSO-like patterns of covariance and explains 77.2% of total variance (figure 5(a)). As demonstrated above with patterns of the major droughts (figure 4), MCA also indicates that negative SST anomalies over the central Pacific (i.e. La Niña) and Indian Oceans (negative IOD) result in below normal NEM precipitation over South India (figure 5(b)). The second leading mode of MCA exhibits a relatively weaker relationship between precipitation and SST anomalies during the NEM (figure 5). The second mode fingerprints the role of SST warming in the Indian Ocean as a driver of increased NEM precipitation in South India (Roxy et al 2015). We also note that there appears to be a slight dichotomy between northern and southern South India, where NEM precipitation in the latter region is more strongly linked with ENSO (figure 5). On the other hand, precipitation over the northern parts of South India is more strongly associated with the second leading mode (figure 5). This finding might help explain some of the ambiguity surrounding the mechanisms of the impact of the 1876–78 Great Drought on South Indian rainfall. Overall, the leading mode of SST and precipitation variability during the NEM shows that cold SST anomalies in the Indo-Pacific facilitate drought conditions over South India.
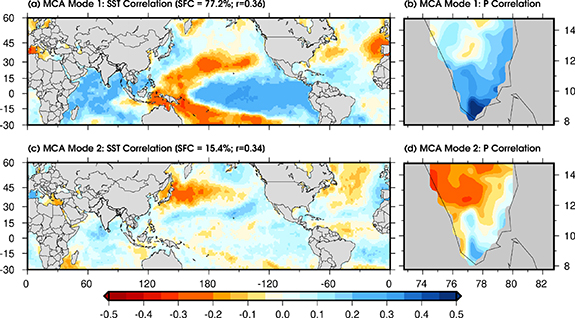
Figure 5. Links between South Indian precipitation and sea surface temperature (SST) during the Northeastern Monsoon season. (a), (b) Correlation patterns obtained from the first leading mode of maximum covariance analysis (MCA) performed between precipitation across South India (8°N–15°N and 74°E–81°E; see Green Box in figure 1) and SST during the October–November–December (OND) season over 1870–2018. (c), (d) Same as in the above panels but for the second leading mode of MCA. Rainfall was obtained from the IMD dataset whereas SST was retrieved from HadSST.
Download figure:
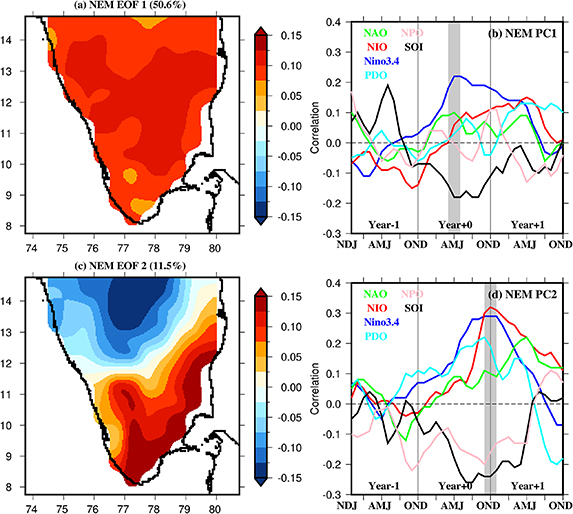
Standard image High-resolution imageWe performed EOF analysis to identify the dominant patterns of NEM rainfall in South India (figure 6). The first leading mode from the EOF analysis picks out rainfall variability across the entirety of South India and explains 50% of total variance (figure 6(a)). The second leading mode reveals a bipolar rainfall pattern across the northern and southern parts of South India and explains 11% of the total variance (figure 6). We note that the characteristics of rainfall variability derived from the first and second modes of EOF analysis are consistent with the leading modes obtained from the MCA (figure 5). Taken together, our findings inferred from both EOFs and MCA show that the first leading mode affects rainfall across South India, whereas the second leading mode delineates opposing rainfall trends in the North versus the southern parts of South India (figure 6).
Figure 6. The leading modes obtained from the empirical orthogonal function (EOF) analysis of rainfall during the NEM for the 1870–2018 period. (a) The first leading EOF mode of NEM, which explains 50.6% of the total variance in NEM rainfall in South India. (b) Lagged correlation between the first leading principle component (PC 1) and 3-month mean SST anomalies over different regions (Nino 3.4 (5°S–5°N, 120–170°W), North Indian Ocean (NIO; 6°–24°N, 40–100°E), North Pacific Ocean (NPO; 30°N–50°N, 120°E–175°W), North Atlantic Ocean (NAO; 6°–24°N, 10–60°W), Pacific Decadal Oscillation (PDO), and Southern Oscillation Index (SOI)). (c) and (d) same as (a) and (b) but for the second leading EOF mode and the corresponding PC 2. Year − 1, Year + 0, and Year + 1 represent the previous, current, and next year of the NEM season, respectively.
Download figure:
Standard image High-resolution image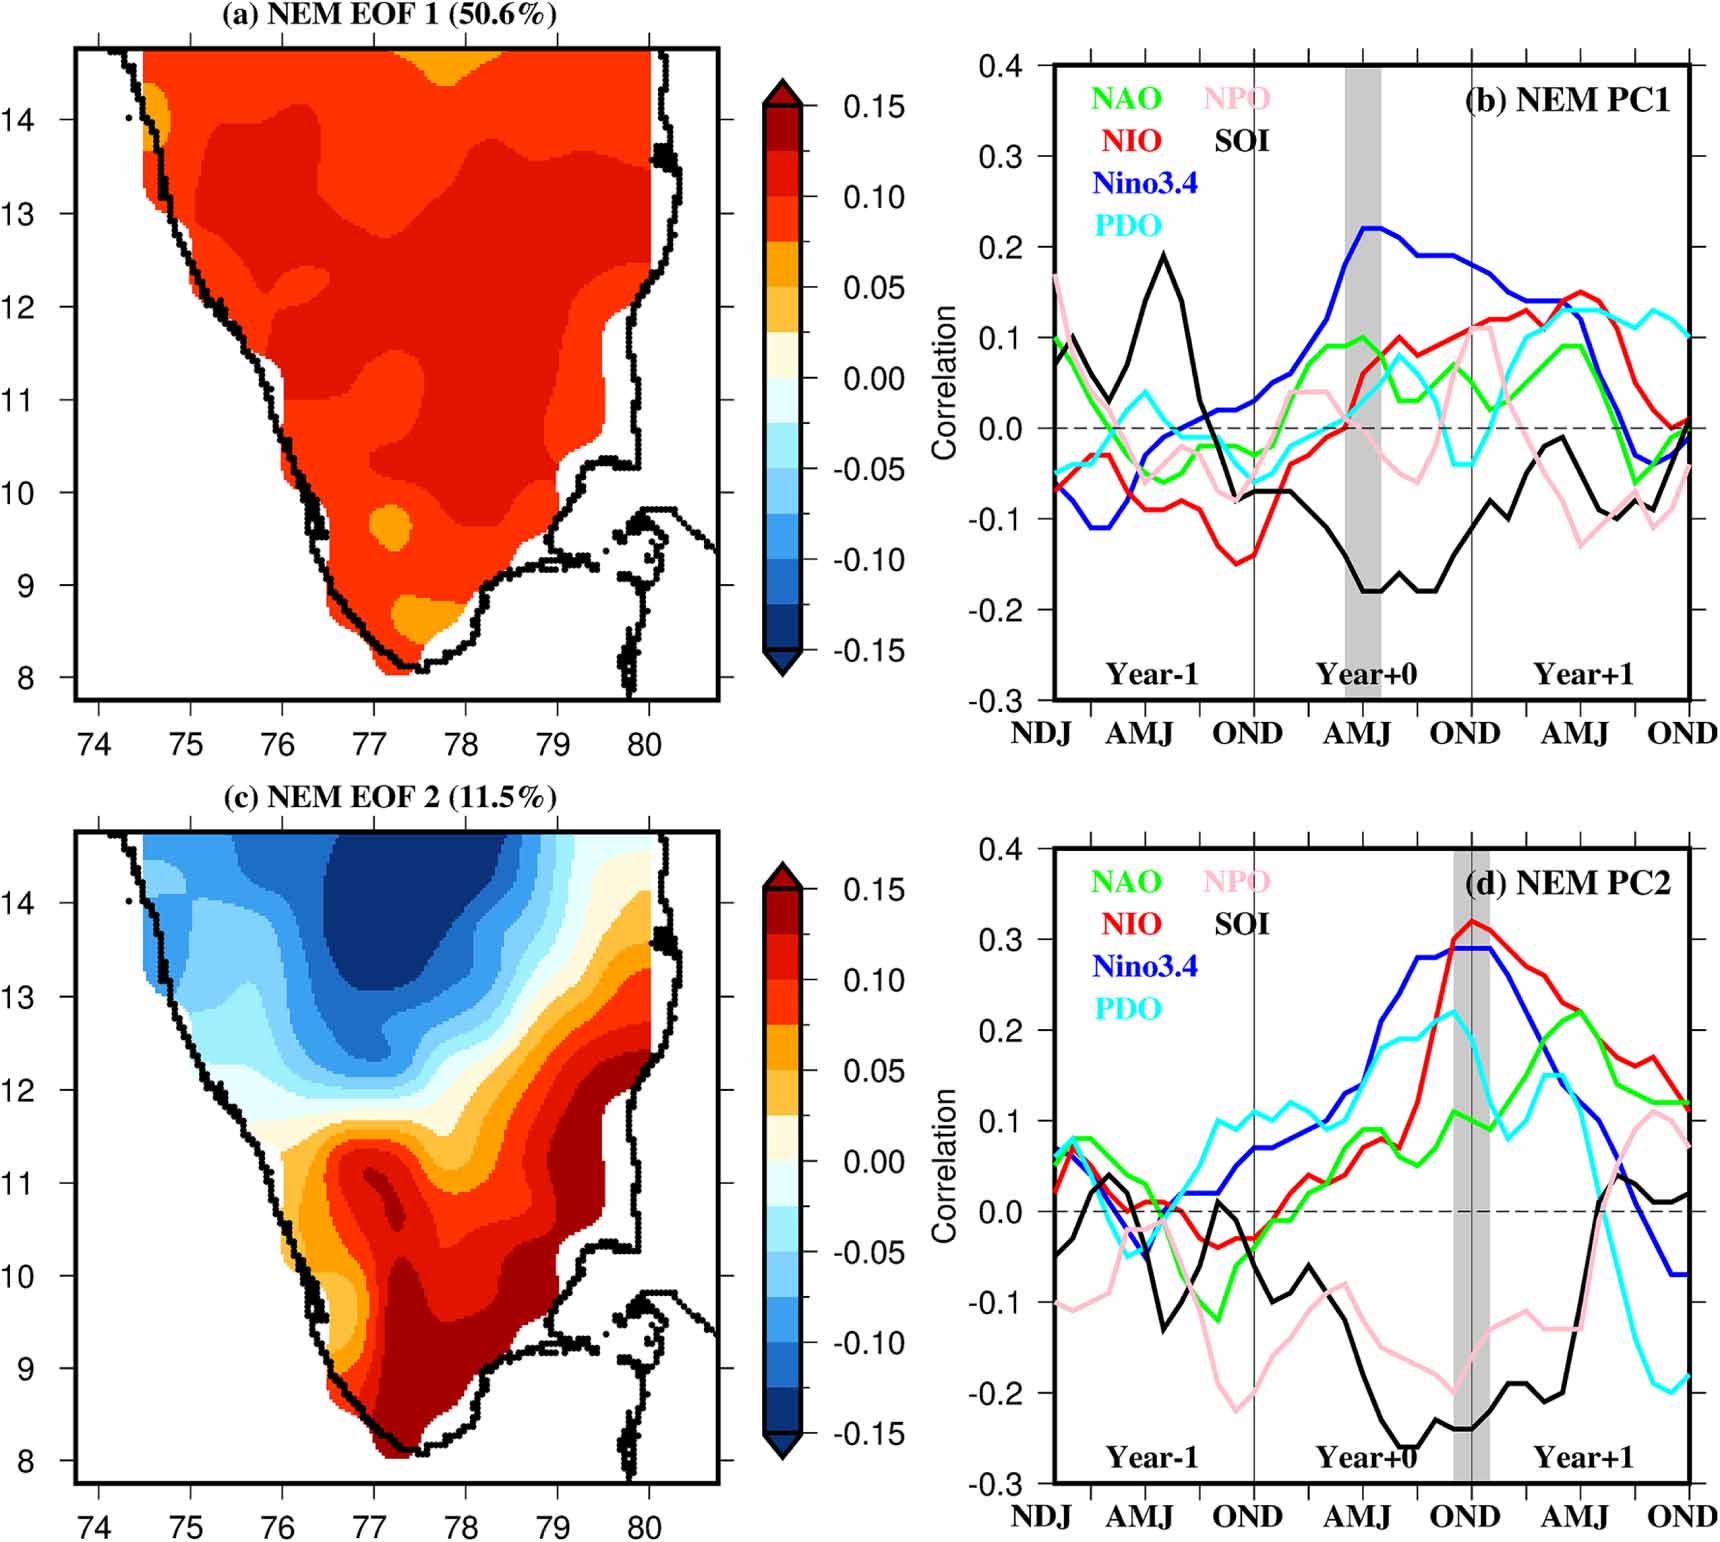
We calculated principal components (PCs) associated with the leading modes of variability derived from the EOF analysis (PC1 and PC2) to examine the predictability of NEM rainfall using SST anomalies (figure S8). We also computed the correlation between PC1 and SST anomalies in addition to oceanic indices (table S1) at different time lags (tables S2 and S3). We find that the first principal component (PC1) is strongly correlated (r = 0.23, P-value < 0.05) to SSTs from April–June (AMJ) in the Nino 3.4 region (figure 6). However, PC2 is more appropriately delineated by (r = 0.33, P-value < 0.05) SST anomalies from OND in Nino 3.4 and in the NIO (figure 6). We use this lagged relationship between oceanic indices and SST anomalies with PCs to establish a predictive model for NEM rainfall (as in Zhou et al 2019). Focusing on the first mode of variance, we used climatological Nino 3.4 SSTs from AMJ to predict rainfall in South India during OND (figure S9). We find that the OND rainfall is more skillfully predicted using AMJ Nino 3.4 anomalies in comparison to SST anomalies over OND NIO (figure S9). We also note that there is no significant increase in prediction skill when both AMJ Nino 3.4 and OND SST anomalies were used as opposed to Nino 3.4 SST anomalies alone (figure S9) due to high year-to-year variability between Nino 3.4 and NIO (figure S10). Overall, our analysis shows that SST anomalies at Nino 3.4 and over NIO can be used to predict rainfall during the NEM over South India with limited prediction skill.
4. Summary and conclusions
South India faced a severe water crisis during 2016–2018. In June 2019, a 'day zero' was declared in Chennai, Tamil Nadu, due to groundwater depletion and drying of four major reservoirs that supply water (Murphy and Mezzofiore 2019), largely induced by this event. We have shown that this extreme deficit was brought about by one of the worst droughts in the last 150 years. The 2016–2018 drought was worse than the 1874–1876 Great Drought, which was linked to the Great Madras famine and the deaths of several million in South India (Mishra et al 2019). The severity of the 2016–18 event during the NEM season peaked in 2016—the second singular driest year on record (after 1876). Dynamically, our study implicates negative IOD and La Niña conditions as facilitators for NEM rainfall deficits, where landward moisture transport from the Bay of Bengal into peninsular India is inhibited. The prevalence of La Niña throughout 2016 and 2017 (DiNezio et al 2017) further worsened the drought that started in 2016. Such rainfall deficits over consecutive years can result in multi-year drought, which have substantial and adverse impacts on surface and groundwater storage, and profoundly affect water availability and agriculture in the densely populated South Indian region. Although the intensity and timing of this recent event raise the possibility of anthropogenic forcing influencing NEM droughts, future work focusing on detection and attribution is required to separate the influence of natural variability (Thirumalai et al 2017, Williams et al 2020, Winter et al 2020). Moreover, potential changes in future patterns of SST variability in the Indian Ocean and tropical Pacific will add substantial uncertainty to projections and prediction of NEM rainfall.
Acknowledgments
We acknowledge the India Meteorological Department for providing the precipitation data. The last author appreciates financial assistance from the Indian Ministry of Human Resource Development (MHRD). The study is partially funded by the Ministry of Earth Sciences and Ministry of Water Resources forum projects. KT was supported by NSF Grant No. OCE-1903482 and acknowledges the University of Arizona and the Department of Geosciences for support.
Data availability statement
The data that support the findings of this study are available upon reasonable request from the authors.