

Abstract
Plug-in hybrid electric vehicles (PHEVs) combine an electric motor with an internal combustion engine and can reduce greenhouse gas emissions from transport if mainly driven on electricity. The environmental benefit of PHEVs strongly depends on usage and charging behaviour. However, there is limited evidence on how much PHEVs actually drive on electricity and how much conventional fuel they use in real-world operation. Here, we provide the first systematic empirical analysis of real-world usage and fuel consumption (FC) of approximately 100 000 vehicles in China, Europe, and North America. We find that real-world mean CO2 emissions of PHEVs are between 50 and 300 g CO2 km−1 depending on all-electric range, user group and country. For private vehicles, real-world CO2 emissions are two to four times higher than test cycle values. The high CO2 emissions and FC mainly result from low charging frequency, i.e. less than once per driving day. Our results demonstrate the importance of real-world vehicle emission measurements and indicate the need to adjust current PHEV policies, i.e. official emission values need to better reflect realistic electric driving shares and incentives need to put more emphasis on frequent charging.
Export citation and abstract BibTeX RIS

Original content from this work may be used under the terms of the Creative Commons Attribution 4.0 license. Any further distribution of this work must maintain attribution to the author(s) and the title of the work, journal citation and DOI.
1. Introduction
Plug-in hybrid electric vehicles (PHEVs) combine an internal combustion engine with an electric motor (Bradley and Frank 2009) and offer the potential to reduce greenhouse gas emissions (GHG), when driven on electricity, to contribute to the targets set by the Paris Agreement (Jacobson 2009, Plötz et al 2018, IEA 2020, Tal et al 2020). However, the potential of PHEVs to reduce local pollutants and global GHG emissions strongly depends on their real-world fuel consumption (FC), which is determined by real-world driving behaviour and the share of kilometres driven on electricity, the so-called utility factor (UF) (Chan 2007, Jacobson 2009, Flath et al 2013, Plötz et al 2017). Assessing FC of PHEVs is challenging as PHEVs use both electricity and conventional fuel for propulsion in a ratio that depends strongly on the driving and charging patterns of vehicle users as well as on vehicle characteristics (Smart et al 2014, Xu 2016, Zhou 2018). Despite growing PHEV market shares, little is publicly known about their real-world usage and resulting GHG emissions. There has been no large-scale systematic investigation, at least for Europe.
PHEV FC values are commonly assessed in standardized testing procedures, or test cycles. For Europe, the New European Driving Cycle (NEDC) and the Worldwide Harmonized Light-Duty Vehicles Test Procedure (WLTP) are most relevant (UNECE 2014, Tietge et al 2017). These test cycle values are usually considered for determining CO2 emissions of PHEVs. But the UFs used in the WLTP and NEDC test procedures are based on outdated information provided largely by vehicle manufacturers and may overestimate UFs and underestimate the real FC and thus emissions of PHEVs (Tietge et al 2017, 2019).
Here, we provide the first systematic overview of mean tailpipe CO2 emissions and deviation from test cycle values for PHEVs. Furthermore, we quantify the impact of major vehicle properties on CO2 emissions including all-electric range and engine power. This work differs from previous research in several aspects. First, it is to our knowledge the first systematic large-scale empirical overview of real-world FC of PHEVs in Europe. Second, by analysing data from previous studies with new primary data in a joint fashion, our work qualifies as the first meta-analysis on real-world PHEV usage.
The outline of this paper is as follows. The data and methods are presented in section 2, followed by the results in section 3. We discuss our findings in section 4 and close with conclusions in section 5.
2. Data and methods
2.1. Data
We collected data on real-world usage and FC of PHEVs from existing literature, research institutions, companies and online data bases. We collected data providing information on real-world FC, annual vehicle kilometres travelled, and UF. Our data covers China (CN), Germany (DE), Norway (NO), the United States (US), Canada (CA), and the Netherlands (NL) and includes data from private and company cars, i.e. vehicles owned by an organization that are assigned to an individual user and can also be used for private purposes. Note that our data does not cover cars owned by a company that are not allowed to be used for private purposes. Table 1 gives an overview of the sources, total sample sizes and PHEV models covered. The data is available as supplementary file (available online at stacks.iop.org/ERL/16/054078/mmedia).
Table 1. Overview of vehicle data sources by number of PHEV models and model variants covered, sample size, predominant user group, and country.
| Source | Models | Model variants | N | User group | Country |
|---|---|---|---|---|---|
| Spritmonitor.de | 27 | 51 | 1385 | Private | DE |
| German company | 14 | 21 | 72 | Company | DE |
| Voltstats.net | 1 | 3 | 11 073 | Private | US/CA |
| MyMPG | 10 | 20 | 326 | Private | US |
| UC Davis | 3 | 4 | 95 | Private | US |
| XiaoXiongYouHao.com | 60 | 92 | 6614 | Private | CN |
| Figenbaum and Kolbenstvedt (2016) | 7 | 7 | 1514 | Private | NO |
| Zhou et al (2018) | 6 | 6 | 192 | Private | CN |
| Xu et al (2016) | 1 | 1 | 50 | Private | CN |
| Mengliang et al (2014) | 1 | 1 | 14 | Private | CN |
| van Gijlswijk and Ligterink (2018) | 11 | 11 | 9600 | Company | NL |
| Ligterink and Eijk (2014) | 3 | 3 | 1200 | Company | NL |
| CARB (2017), Appendix G | 1 | 1 | 48 000 | Private | US |
| INL (2014) | 5 | 5 | 14 750 | Private | US |
| CARB (California Air Resources Board) (2017) Appendix G | 1 | 1 | 8309 | Private | US |
| Smart et al (2014) | 1 | 2 | 1405 | Private | US |
| Raghavan and Tal (2020) | 4 | 4 | 110 | Private | US |
| Total | 66 | 202 | 104 709 |
In total we collected data from primary and secondary sources of over 100 000 PHEVs. Data from Spritmonitor.de and XiaoXiongYouHao.com was provided by the website operators, data from Voltstats.net and MyMPG was collected manually by the authors. As users record their PHEV FC on a voluntary basis on these websites, there is a risk of self-selection bias. Tietge et al (2017, 2019) have shown that Spritmonitor, XiaoXiongYouHao, and MyMPG closely follow the distribution of several key vehicle variables in the newly sold fleets in the respective markets. Furthermore, these four new empirical sources and combined with 13 existing studies in a joint meta-analysis ensuring the robustness of our findings and low bias in our sample. The data of company cars in a large German company was provided by the company (which wishes to remain anonymous). We obtained a sample of 95 PHEVs directly from the UC Davis. A large part of our sample is aggregate PHEV information taken from California's Advanced Clean Car Midterm Review 2017 Appendix G on electric vehicles. The sample size information is taken from chapter II of the report whereas the UF and annual driving distances are taken from table 14 as well as table 20 of the same report (CARB 2017).
Our sample is dominated by North American vehicles, but the sample sizes for individual countries are still sufficiently large for conclusions and general patterns. For Germany, for example, our sample accounts for 1% of the total stock of PHEVs at the time of data collection, while for Europe (EU, UK, EFTA, and Turkey) 1.5% of the total stock are covered (EAFO 2020). The major part of vehicles in our sample is private, yet, a substantial number of more than 10 000 PHEVs are company cars, allowing profound analyses for this user group as well. In total, our sample covers 66 models and 202 model variants (Plötz et al 2020).
2.2. Methods
To compare actual FC to test-cycle values and to analyse the effect of vehicle properties such as system power and test-cycle all-electric range, a detailed list of vehicle specifications were collected. We retrieved information on vehicle system power (i.e. the maximum combined power of electric and combustion engine), fuel type, FC (in charge-depleting mode, charge-sustaining (CS) mode, and combined), as well as all-electric range according to NEDC, WLTP, and Environmental Protection Agency (EPA) (the five cycle) test cycles from the ADAC Autokatalog (an online vehicle database, see ADAC 2020) for PHEV models in Europe and Fueleconomy.gov for PHEV models for the U.S. market (containing EPA values for combined FC and charge-depleting mode consumption). The XiaXiongYouHao.com database provided NEDC combined FC as well as NEDC all-electric range for PHEVs available in China. For those vehicles in the US that are identical to vehicles on the European market such as BMW i3 REX and the Chevrolet Volt (which has been sold as Opel Ampera in Europe), the EPA data was enriched by NEDC values from the European counterparts. For those vehicles were this is not the case, only the deviation from EPA test values could be calculated (i.e. they are missing in table 2 below).
Table 2. Mean real-world and test cycle fuel consumption.
| Country | User group | NEDC | Weighted NEDC | Real-world | Weighted real-world |
|---|---|---|---|---|---|
| (litres/100 km) | (litres/100 km) | (litres/100 km) | (litres/100 km) | ||
| US | Private | 1.3 | 1.1 | 3.0 | 2.1 |
| NO | Private | 1.7 | 1.7 | 3.4 | 3.6 |
| CN | Private | 1.7 | 1.6 | 6.4 | 6.7 |
| DE | Private | 1.8 | 1.7 | 4.5 | 4.0 |
| DE | Company car | 2.0 | 2.0 | 6.6 | 7.5 |
| NL | Company car | 1.7 | — | 6.9 | — |
| (g CO2 km−1) | (g CO2 km−1) | (g CO2 km−1) | (g CO2 km−1) | ||
| US | Private | 30 | 26 | 70 | 49 |
| NO | Private | 39 | 39 | 79 | 84 |
| CN | Private | 39 | 37 | 148 | 155 |
| DE | Private | 42 | 39 | 104 | 93 |
| DE | Company car | 46 | 46 | 153 | 174 |
| NL | Company car | 39 | — | 160 | — |
In cases where the actual UF is missing and only the FC is given (for 10% of the sample and 203 of 244 aggregated observations), we estimate the real-world UF from the real-world FC and CS mode FC  as
as  . Here,
  is approximated by taking NEDC values with 50% addition for real-world driving, i.e.
  with
with  (AER = all-electric range). This method is slightly optimistic as a 50% deviation from NEDC is slightly above the fleet mean deviation for conventional combustion engine vehicles and hybrid vehicles (see Tietge et al
2019). It is optimistic as we increase the denominator in the second term of
(AER = all-electric range). This method is slightly optimistic as a 50% deviation from NEDC is slightly above the fleet mean deviation for conventional combustion engine vehicles and hybrid vehicles (see Tietge et al
2019). It is optimistic as we increase the denominator in the second term of  , and thereby increase the calculated UF. In cases with high actual FC, this approach can lead to negative UF. We set the estimated UF to zero in these cases (11 of 244 aggregated observations covering 0.1% of the total vehicle sample). If values from the US EPA are available, we use EPA values for CS mode FC, i.e.
  . Likewise, when the real UF is known, the actual FC is estimated by inversion
  for 18 of 244 aggregated observations covering 66% of the sample vehicles.
The distributions of real-world FCs are calculated as kernel density estimates (Wickham 2016). In the regression results, we use weighted least squares to adjust for differences in sub sample sizes. More specifically, the nonconstant variance of the individual sample means is corrected for by weighted each mean with the inverse of its standard error. In our case of mean values, the weights are thus proportional to the reciprocal of 1/√N; we thus use the square root of sample sizes as weights.
3. Results
3.1. Real-world fuel consumption and CO2 emissions
Figure 1 shows the distribution of real-world FC values in litres/100 km across the countries and user groups. We observe a broad distribution of real-world FC values, much broader than for conventional combustion engine vehicles (Tietge et al 2019). The mean FC varies between 2.1 and 7.5 l/100 km, depending on the country, user group and vehicle models. This corresponds to a range of mean tailpipe CO2 emissions, i.e. without emissions from electricity and fuel production, from 49 to 174 g CO2 km−1 at 2.32 kg CO2 l−1 of gasoline. Table 2 below summarizes the mean real-world and test cycle FC as well as CO2 emissions per km. As the samples in the countries cover PHEV models with different sample sizes, table 2 states unweighted and weighted means. The individual mean values by country and user group are affected by several factors such as the all-electric ranges of the models in the sample, charging and driving behaviour as well as the resulting UF. Their impact will be discussed in section 3.3.
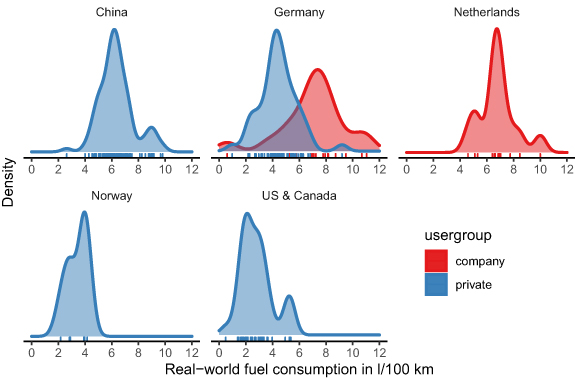
Figure 1. Distribution of real-world fuel consumption in litres/100 km by user group (private in blue and company car in red) and country (small panels). Small rugs next to the abscissa indicate actual observations per PHEV model and source.
Download figure:
Standard image High-resolution imageFor the country-specific analysis, the most recent data is for Germany and China with data from 2019 to 2020. The large mean FC in China is noteworthy and mainly due to low UF (cf section 3.2). In Norway and the US, users achieve higher UF and thus lower total FC than in the other countries under consideration (cf section 3.2). Company car data is only available for Germany and the Netherlands with greater sample sizes for the Netherlands. Note, however, that the distributions in Germany and the Netherlands are similar for company cars with a peak around between 6 and 8 l/100 km, i.e. four times higher than test cycle FC, and a broad distribution.
The mean deviation from test cycle values differs between countries, but on average, real FC is two to four times higher than the test cycle for private cars and three to four times higher for company cars. As the majority of vehicles in the sample have been certified according to the NEDC, we focus mainly on the deviation from NEDC. For private vehicles, the mean relation is 300%–340% (the range indicates the mean with two standard errors) and 135%–235% for the sample size weighted mean. This relation corresponds to a deviation between real-world and test cycle FC of 200%–240% or 35%–135%. The sample-size weighted deviation is smaller as North American vehicles, mainly Chevrolet Volt, Toyota Prius and BMW i3 REX with small test cycle deviation, dominate the overall sample. Furthermore, these vehicle models have high all-electric ranges (see section 3.3). For company cars, with data from Germany and the Netherlands, the deviation is even higher. The mean relation for company cars in both countries is 305%–395% or 205%–295% deviation and the sample size weighted mean relation is 340%–410% or 240%–310% deviation.
For the US, the mean real-world FC can also be compared to EPA testing values. Figure 2 shows the distribution of the relation between real-world and EPA test cycle FC. A value of 100% corresponds to perfect match between real-world and test cycle FC. Most PHEV models and sub samples have clearly above EPA FC. The unweighted mean relation between actual and EPA FC for the US is 213% (corresponding to a deviation of 113%) and the sample size weighted relation is 179% (or 79% deviation).

Figure 2. Distribution of relation of real-world fuel consumption in relation to EPA values. A value of 100% corresponds to perfect match between real-world and test cycle fuel consumption. Small rugs next to the abscissa indicate observations per PHEV model and source.
Download figure:
Standard image High-resolution image3.2. Real-world utility factor
A key indicator of PHEV usage and its potential environmental benefit is the share of kilometres driven on electricity, the so-called UF. The UF is the ratio between the distance driven on electricity and the total distance driven by a vehicle. If direct UF values were not available, we calculated the UF from the real-world FC (cf section 2.2). Figure 3 shows the mean UF as a function of all-electric range for all PHEVs sub-samples. Also shown is the UF assumed in the NEDC values (dashed line). Almost all mean real-world UF are below the NEDC value. Long-ranged PHEVs in the sample tend to be closer to test cycle values. Comparing privately owned vehicles and company cars with a given range, we observe lower mean UF for company cars throughout the sample. Accordingly, the deviation to test cycle UF is even higher for company cars. The deviation between mean UF in the sub samples and test cycle values shows noteworthy differences also between the countries. It is largest for privately owned vehicles in China and for company cars in the Netherlands, but is closest to test cycle values for privately owned vehicles in Norway and the US. Furthermore, the UF in most countries shows a tendency to increase with all-electric range, as expected.

Figure 3. UF versus NEDC test cycle range in km by country and user group (company cars in red and private vehicles in green). The dashed line indicates the NEDC test cycle UF.
Download figure:
Standard image High-resolution imageSome country specific effects can partially be explained by country specific factors. In Norway, battery electric vehicles receive higher incentives than PHEVs and thus PHEVs are less likely to be bought to mainly benefit from the lower purchase price or taxation (especially for company cars), but to actually take advantage of the possibility to drive on electricity. The high fuel and low electricity prices in Norway are an additional incentive to maximise electric driving. Furthermore, a small additional effect could come from the fact that public charging is comparatively easy in Norway, as there is only one charging card that allows to charge at almost all public charging points across the country (Figenbaum and Kolbenstvedt 2016).
The mean UF in China show a large variation even for a given range and only a slight tendency to increase with range. Chinese authorities monitor the real-world performance of PHEVs, but there is no enforcement or regulation that effectively encourages car owners to increase electric driving or charging. Also, there are no requirements on how frequently PHEV users should charge their vehicles in China. Furthermore, the lower availability of garages and private parking spots in China makes PHEV users without regular night charging option more likely (Li et al 2021). Additionally, the restrictions on driving and purchase of conventional fuel vehicles in major cities such as Beijing, Shanghai and Hangzhou make PHEVs highly attractive irrespective of the actual usage.
The Netherlands had high incentives of PHEVs as company cars from 2012 to 2016 leading to strong sales increase in company car PHEVs. However, no additional incentives for charging these cars were enacted. Instead, many PHEV company car users in the Netherlands have fuel cards that allow refuelling conventional fuel for free but they have to pay privately for charging the PHEV at home (van Gijlswijk et al 2018), which would require the installation of a private charging spot. These financial disincentives are likely the main reason why many company car PHEV users do not frequently charge their PHEVs resulting in particularly low UF.
For the US, only private vehicles are in the sample and many of the observations are from early adopters who are more likely to purchase a PHEV only if they have an option to recharge the vehicle regularly (Chakraborty et al 2020). In addition, 21 of the 23 PHEV model variants in the US sample are Chevrolet Volt, BMW i3 and Toyota Prius PHEV which are probably preferred options for buyers with above mean environmental concern and are frequently charged (Tal et al 2018, 2020, Chakraborty et al 2020). Beyond that, Chevrolet Volt and BMW i3 are range-extended PHEVs having an NEDC all-electric range of at least 80 km to up to 330 km. Accordingly, UF in the US are higher.
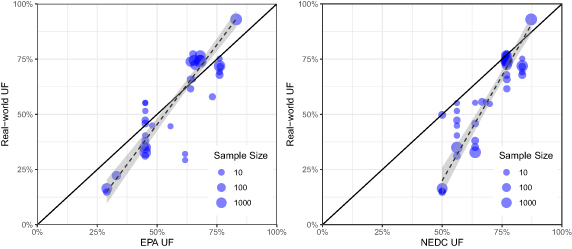
We also analyse the deviation between real-world UFs and EPA UFs for the US sample in more detail. Figure 4 compares the real-world UFs to EPA values as well as the real-world UFs to NEDC UFs. Short-ranged PHEVs have lower EPA values and lower real-world UF than long-ranged PHEVs. Figure 4 demonstrates that EPA values generally match the real-world UF quite well for large span of all-electric ranges. The sample size weighted linear regression in figure 4 (dashed line with 95% confidence interval) indicates a possibly overestimation for low EPA UFs and possible underestimation for large EPA UFs. In contrast, the NEDC UFs in the right panel of figure 4 overestimate the real-world UF for almost all all-electric ranges. Figure 4 demonstrates that test-cycle UFs can be close to real-world UFs if the test-cycle values are carefully designed. There are several potential reasons why the EPA UFs are more realistic. First, the more careful electricity consumption estimate in five cycles including the use of auxiliaries and more demanding driving cycles. Second, different assumptions about the frequency of charging. Third, more realistic calculation of the UF from the combination of driving data, the all-electric test-cycle range, and the assumptions about charging (all three are combined via  for the NEDC case). The first potential reason is very likely to play a role (see the explanation of the low NEDC UFs in the section 4), but a detailed discussion of the other factors is beyond this meta-analysis of real-world FC in the present paper.
Figure 4. Real-world UF versus EPA UF (left panel) and NEDC UF (right panel) for US vehicles only. The size of the circles indicates the (log of) sample size. The dashed line is a weighted linear regression of real-world UF on test-cycle UF (with the shaded area the 95% confidence interval).
Download figure:
Standard image High-resolution image
Lastly, for the case of Germany, the data is quite recent mainly with usage data from 2019 and early 2020. Home charging should not be a problem in Germany for the majority of PHEV users as about three quarters of passenger cars in Germany are parked in private garages or car ports overnight (MiD 2018) and the share can be expected even higher for PHEV owners, because of the higher purchase price of PHEVs and higher household income of PHEV owners (Plötz et al 2014, Frenzel et al 2015). Company car users in Germany, on the other hand, have similar financial disincentives as company car users in the Netherlands. They receive a tax benefit it they use a PHEV but this is not conditional on electric driving and many can be expected to own fuel cards and not to pay for conventional fuel, as in the Netherlands.
In summary, the real-world UF is typically only half of the NEDC test cycle values for private vehicles and even lower for company cars. Yet, the mean UF for some privately used PHEV models is close to 80% of the test cycle UF and the mean UF for users in Norway and the US are closer to test cycle UF compared to other countries.
3.3. Factors affecting real-world fuel consumption and CO2 emissions
The all-electric range and other vehicle properties such as system power can be expected to affect FC and thus tailpipe CO2 emissions. We use regression analysis of these factors on FC to quantify these effects. We use the NEDC value for the all-electric range as it is readily available for most PHEV models. System power, i.e. combustion engine power plus electric motor power, is included to account for different vehicle size or type and engine capacity. Strictly speaking, the system power is the maximal power available for propulsion. For most PHEV models, this is the sum of combustion engine and electric motor power. In range extended electric vehicles, however, the system power is smaller than the sum of engine and electric motor power because the combustion engine is not directly used for propulsion but for battery charging.
Since FC is strictly non-negative, we use an exponential function for the effect of vehicle models' all-electric range and power and control for user group and country specific effects with the following model
Here, system power ( ) is in units of 100 kW and all-electric range (
 ) in 10 km. The chosen dependence is physically meaningful: for
  , the FC approaches a finite value (i.e. the FC in CS mode) and goes to zero for
  . Likewise, the FC approaches zero for
  and grows with increasing power (for positive β1). The linear regression is performed after taking logarithms by weighted least squares.
Table 3 summarizes the results of a sample-size weighted and not sample-size weighted regression and shows the impact of all-electric range and system power on FC. The model itself and all coefficients (except for Norway as country dummy) are significant (p < 0.05) and the coefficients have the expected signs (β1 > 0 and β2 < 0). The regression results show relatively high goodness of fit (adjusted R2 > 0.8). Please note that the non-sample size weighted regression is mainly shown to demonstrate the robustness of the results as the sample size weighted model is more appropriate here. Furthermore, the regression models (2)–(4) in table 3 indicate the high explanatory power of all-electric range and system power for actual FC.
Table 3. Regression results on (log of) real-world fuel consumption. Coefficient estimates and standard errors in parentheses.
| Dependent variable: log(FCreal) | |||||
|---|---|---|---|---|---|
| (1) | (2) | (3) | (4) | (5) | |
| All-electric range (10 km) | −0.127*** (0.005) | −0.160*** (0.011) | — | −0.145*** (0.006) | −0.087*** (0.006) |
| System power (100 kW) | 0.306*** (0.026) | — | 0.596*** (0.049) | 0.525*** (0.026) | 0.281*** (0.023) |
| Company cars | 0.306** (0.112) | — | — | — | 0.315*** (0.056) |
| Country: China | 0.443*** (0.049) | — | — | — | 0.404*** (0.039) |
| Country: NL | — | — | — | — | 0.208** (0.075) |
| Country: NO | −0.119 (0.077) | — | — | — | −0.165 (0.086) |
| Country: US | −0.123* (0.054) | — | — | — | −0.193*** (0.052) |
| Constant | 1.552*** (0.061) | 2.414*** (0.084) | 0.262*** (0.089) | 1.442*** (0.069) | 1.376*** (0.057) |
| Observations | 211 | 211 | 216 | 211 | 225 |
| Sample-size weighted | Yes | Yes | Yes | Yes | No |
| R2 | 0.913 | 0.523 | 0.410 | 0.838 | 0.812 |
| Adjusted R2 | 0.910 | 0.521 | 0.407 | 0.837 | 0.806 |
| F-Statistics | 355*** (df = 6; 204) | 229*** (df = 1; 209) | 148*** (df = 1; 214) | 539*** (df = 2; 208) | 134*** (df = 7; 217) |
*p < 0.05; **p < 0.01; ***p < 0.001.
Controlling for user group and country specific effects, we find that a 100 kW increase in system power increases FC and thus CO2 emissions by 25%–36% (including 95% confidence intervals in the full sample-size weighted regression model (1) and 23%–33% in the non-sample-size weighted regression for comparison). The system power in the PHEV models in our sample cover a range of 90–674 kW with a mean of 225 kW, a 20% increase of system power is by 45 kW and would lead to an increase of FC and CO2 emissions by 11%–16%, keeping all other factors constant. Likewise, a 10 km increase of NEDC all-electric range decreases the FC by 11% and 14%, respectively (range from sample size weighted regression including 95% confidence intervals) with all other parameters fixed. This implies that FC and thus direct CO2 emissions are halved with every 55 km of all-electric range (50–63 km range from sample size weighted regression including 95% confidence intervals). While a significant effect of the all-electric range on FC is expected, the effect of the models' system power is comparatively strong.
For categorical variables, the reference categories are 'private' for user group and 'Germany' for country. The regression confirms the general observations of actual FC and UF in figures 1 and 2. Controlling for other factors, the mean FC of company cars is 10%–50% higher than for private vehicles (95% confidence intervals) and Chinese PHEVs show 35%–55% higher FC than PHEVs in Germany. The change in FC is not significantly different from zero for Norway. PHEVs in the US have 1%–23% lower FC compared to Germany. The Netherlands can only be included in unweighted regression model as the sample size is not available on the individual model level.
4. Discussion
The observed large real-world FC for PHEVs results from a 50% lower UF (on average) than assumed in NEDC values (cf section 3.2) and higher FC in CS mode. For conventional pure combustion engine vehicles, the mean real-world FC is about 40% higher than NEDC values (Dornoff et al 2020). If we apply the same 40% to conventional fuel driving of a mean PHEV, it would consume 1.4 times as much fuel in CS mode operation. Taken together, the combustion engine is used about twice as often as assumed in the NEDC values and consumes 40% more fuel. This leads to 2.8 or almost three times higher FC and explains the observation of a real-world FC of two to four times higher than in NEDC values. How much of the lower UF is due to low charging? The UF is lower than test-cycle values since (a) the actual all-electric range is smaller than expected, (b) vehicles show above average daily driving, and (c) lower charging. If electric consumption is 40% higher than test-cycle values (similar to conventional vehicles, see Dornhoff et al 2020), than this lowers the NEDC UF for the most common test-cycle range of 50 km by 12% or 6 percentage points (from 50/(50 + 25) = 66.7% to 50/1.4/(50/1.4 + 25) = 58.8%). In addition, the annual mileage is close to the average annual mileage for the US vehicles, but somewhat higher than the national average for the German vehicles. However, Plötz et al (2020) show that the higher annual mileage reduces the mean UF only by a few percentage points. Accordingly, the majority of the 50% lower UF compared to test-cycles is attributable to low charging, i.e. less than once per driving day. Only little data is available for WLTP certified vehicles so far, but as the UF expected from NEDC and WLTP are fairly similar, high deviation from WLTP can also be expected, as preliminary analysis confirms (Plötz et al 2020).
Our sample includes data from five countries and two user groups covering a total of more than 100 000 PHEVs, including literature values as well as recent PHEV measurements. We lack data on other important PHEV markets such as the United Kingdom and Sweden. However, framework conditions in these countries are comparable to those of other Western European countries with respect to the availability of home charging, typical driving distance, and income. Accordingly, countries with similar financial incentives (especially for company cars) can be expected to show similar PHEV usage and thus similar UF and FC values. PHEV usage might be notably different in Japan or Korea, but no data was available for those countries. Previous literature has shown that countries differ in the typical availability of home charging and public fast charging (Funke et al 2019). On the level of PHEV model aggregated data used here, such information is not available and an inclusion of country averages would mainly reproduce the country specific effects stated in table 3. However, this should be taken into account to analyse FC and UF on vehicle individual level in future research.
Our country samples show different distributions of car brands and models. The US sample, for example is dominated by the Chevrolet Volt, while the Chinese sample contains a large number of brands, especially domestic Chinese brands. The Dutch, Norwegian and German samples, on the other hand, contain a broad number of mostly European brands and models. As PHEV are almost exclusively petrol PHEV with the Mercedes E 300 de and Volvo V60 D6 the only exceptions in Europe and in our sample, we do not believe that there is sufficient data to draw conclusions on petrol and diesel PHEV separately. However, future research could analyse differences in real-world FC between petrol and diesel PHEV as more data becomes available.
Company car data was available only for Germany and the Netherlands, with a small sample of company car in Germany. Yet, the overall trends are the same for both countries, and the qualitative differences among private and company cars in charging behaviour can be expected with the existing financial framework conditions as one of the main drivers in both countries for PHEVs. In countries with less financial incentives for company car PHEVs, user behaviour and thus UF and CO2 emissions are likely to be closer to those of private users.
The regression models show that all-electric range and system power are the most important variables to explain the variance in actual FC. Both quantities are currently almost independent as the sample size weighted Pearson correlation between system power and all-electric range is only 0.08. Of course, the importance of system power and all-electric range in the cross sectional regression alone does not directly imply causation, but as engine size is technically related to FC and all-electric range clearly related to electric driving, we see strong reasons for causality here. Accordingly, the conclusion that a reduction of engine power and increase in all-electric range will reduce average real-world FC of PHEV appears robust.
For most online data sources, including Spritmonitor, MyMPG and XiaoXiongYouHao, registration and monitoring of FC is voluntary. It can be assumed that mainly those PHEV users who are sensitive to fuel economy register on these platforms. Thus, a certain self-selection bias understating FC could be present. However, Tietge et al (2019) have shown that FC data in Spritmonitor is consistent with panel data representative for the German population. Likewise, Tietge et al (2017) show that MyMPG fuel economy data is fairly representative for the US vehicle sales with respect to vehicle size, engine capacity, and number of cylinders but that fuel-efficient vehicles are over represented. Similarly, XiaoXiongYouHao data closely resembles annual sales data in China with respect to engine power, engine displacement, test cycle FC, and the share of vehicles with automatic transmission but that vehicle weight in the sample is slightly above the sales average (Tietge et al 2017). For PHEVs, users are known to have a strong interest in new technologies (Plötz et al 2014, Rezvani et al 2015) and this could be an additional reason to track their personal PHEV usage as a sign of technological interest rather than usage behaviour bias. Furthermore, our findings do not only rely on new empirical data from online sources but are the result of a meta-analysis of these new data with existing studies. The joint analysis of 17 sources in total ensures the robustness of our findings.
Furthermore, on the Spritmonitor.de website most of vehicle specifications are provided in free-text boxes and are not selected from a pre-defined list, leading to inaccuracies and thus difficulties in assigning correct vehicle characteristics from the list of PHEV models. The rigid data cleaning process, however, assured a high level of accuracy. Additionally, there are no required fields for data entries on Spritmonitor.de, which might lead to incomplete entries in a few cases.
5. Conclusions
PHEVs offer the potential to reduce CO2 emissions from road transport if mainly driven on electricity. Here, we show that PHEVs drive significantly less on electricity and show on average two to four times higher tailpipe CO2 emissions than expected from test cycles, in particular the NEDC. Depending on the PHEV model, user group and country, these emissions show a broad range of 50–300 g CO2 km−1. The reason for the large deviation are less frequent charging than assumed in test cycles, lower real-world all-electric ranges and higher than expected FC in combustion engine mode. The deviation is particularly large for company cars where existing financial incentives often make refuelling attractive and charging unattractive for PHEV users.
Governmental support for PHEVs and their accounting in the CO2 emission targets should thus better reflect their actual environmental benefit and incentivize a high electric drive share instead of the vehicle purchase alone. In addition, real-world FC and CO2 emissions of PHEVs could be improved by decreasing combustion engine power while increasing all-electric range and the frequency of charging. Accordingly, incentives need to set minimum electric ranges, favour longer ranges and be conditioned to reporting the actually realized electric drive share. Frequent charging should be incentivized, also by improving access to charging points, and conventional-fuel driving should be made less attractive.
In the future, the monitoring of real driving emissions, e.g. following Regulation (EU) 2018/1832 in Europe and starting with all newly sold vehicle in 2021, will make real-world FC data of all newly sold PHEV available to regulators. The findings of the present paper can be used as a reference point to compare today's PHEV fleet with the real-world FC and CO2 emissions of the next generation of PHEV models and adjusted incentive policies.
Acknowledgments
PP and CM acknowledge funding from the ICCT and from the Profilregion Mobilitätssysteme Karlsruhe, which is funded by the Ministry of Economic Affairs, Labour and Housing in Baden-Württemberg and as a national High Performance Center by the Fraunhofer-Gesellschaft. ICCT funding for the analysis was provided by the European Climate Foundation. We also thank Gil Tal and Scott Hardman from UC Davis for sharing data with us as well as Christian Weber and Erik Figenbaum from TØI who also shared data and interpretation.
Data availability statement
All data that support the findings of this study are included within the article (and any supplementary files).