

Abstract
The development of wind energy in West Africa is essential to meet the rising energy needs due to population growth and societal development. However, only few studies have investigated the changes in turbine hub-height wind characteristics over the region under changing climate. This study aims at assessing the impact of climate change on wind power density (WPD) over West Africa using the simulations from the newly developed Coupled Model Intercomparison Project version 6 (CMIP6) models. The CMIP6 near-surface wind speed and directions simulations for the historical climate (1985–2014) were compared with ERA5 reanalysis data using multiple descriptive statistics. Relative to ERA5 reanalysis, the CMIP6 models alongside their multimodel ensemble mean (EnsMean) realistically reproduce the near-surface wind characteristics (i.e. wind speed and directions) across most subregions of West Africa, although noticeable biases still exist. Overall, the CMIP6 EnsMean performs better than most individual models at capturing the near-surface wind speed over the region. Under global warming, we find a robust projected increase (about 70%) in WPD over the Guinea coast subregion of West Africa, especially in June–July–August season. The December–January–February and March–April–May seasons show alternating projected WPD increase and decrease, with predominantly robust projected decrease over the Sahel subregion. The projected increase over the Guinea coast has strong temporal qualities, with the end of the century (2070–2099) changes showing stronger magnitude compared to the mid-century (2040–2069) changes, and thus may provide a commercially viable renewable energy source.
Export citation and abstract BibTeX RIS

Original content from this work may be used under the terms of the Creative Commons Attribution 4.0 license. Any further distribution of this work must maintain attribution to the author(s) and the title of the work, journal citation and DOI.
1. Introduction
The recent advances in wind energy meteorology alongside innovative and cheaper technology have transformed wind energy into a front runner in the renewable energy industry. Although global wind energy potential is very large, there has been more research focus on wind hotspots such as China (Guo et al 2019, Abolude et al 2020), North America (Kulkarni and Huang 2014, Wang et al 2016, Breslow and Sailor 2002), and other wind-rich regions such as northern Europe and Northern Asia (Hueging et al 2013, Tobin et al 2015, Bandoc et al 2018). These hotspots rank highly in total installed wind capacity worldwide, with China, USA, and Germany being the top three countries (Abolude et al 2020) while countries in Africa, Oceania, and the Middle East are on the lower end (IRENA 2020, Chen et al 2020). Literature on wind power in Africa is quite robust but limited perhaps due to the high share of hydropower in the energy mix, sparsity of required data, and or energy crisis. For instance, Mukasa et al (2013) reported that the potential for wind energy production in Africa is numerous, and earlier adoption can perhaps reduce investment costs and switching costs. A study by Mentis et al (2015) identified South Africa, Sudan, Algeria, Egypt, Libya, Nigeria, Mauritania, and Tunisia as countries of high wind energy potential in Africa. Olaofe (2018) in a review study did some work on offshore wind energy characterization for Africa while Elsner (2019) remarked about an under-appreciated offshore wind energy potential over Africa similarly. On the national scales, Akinsanola et al (2017) assessed wind power potential for a site in Bayelsa, Nigeria while Udo et al (2017) did a similar assessment using four stations. Boudia et al (2016) combined station data from Algeria and her neighboring countries to develop a wind resource map for Algeria. Similar assessment studies have been conducted in South Africa (Ayodele et al 2012), Rwanda (Safari and Gasore 2010), Cameroun (Arreyndip et al 2016), Chad (Abdraman et al 2016), Ghana (Asumadu-Sarkodie and Owusu 2016), Libya (Elmabruk et al 2014), Burkina Faso (Landry et al 2017), Morocco (Monjid et al 2015), Ethiopia (Bekele and Palm 2009), and Zimbabwe (Hoves et al 2014) amongst others. Majority of these studies were conducted using data from meteorological stations and or gridded reanalysis products.
Ideally, wind energy potential can be estimated from station data, gridded reanalysis products, and model data where the latter required validation in order to quantify potential bias. After validation, these model data can then be used to investigate the future potentials of wind power both locally and globally. Advances in climate modelling have also made it possible to assess the impacts of global warming on wind speed and wind power potential. Global climate models (GCMs) and regional climate models (RCMs) are being increasingly used to investigate the projected changes in different meteorological parameters including wind speed. Using the multi-model ensemble mean (EnsMean) of 12 Coupled Model Intercomparison Project version 5 (CMIP5) GCMs, Zheng et al (2019) observed an increase in offshore areas with wind power density (WPD) more than 400 Wm2 but a reduction for those areas with WPD more than 800 Wm2 globally. Breslow and Sailor (2002) projected a decrease of about 1%–3% in wind speed over the United States in the next 50 years till 2050, and Chen et al (2012) reported almost equivalent wind speed at the end of the 21st century as last historical 35 years in China using AOGCMs. In Europe, Davy et al (2018) projected no changes in wind speed over the Black Sea using EURO-CORDEX (Europe-coordinated regional climate downscaling experiment) models while Tobin et al (2015) reported that at mid-century, wind power may increase by about 5% in most European countries. In Africa, Sawadogo et al (2020) projected predominant increases of up to 20% in WPD for the years 2021–2040 and 2041–2060 using a RCM that participated in the CORDEX. Soares et al 2019) projected an increase (decrease) in WPD in the northern (southern) regions of Africa based on an ocean-atmosphere regional model, while Fant et al (2016) similarly observed a decrease in 50 m wind speed over South Africa by 2050. Over West Africa where this study is focused, there is very limited evidence of scholarly articles using the most recent GCMs. While there are numerous studies on precipitation and temperature, wind power has seldom been discussed. In a recent study, Sawadogo et al (2019) used an EnsMean from 11 CORDEX RCMs to investigate changes in WPD under different global warming levels and reported an increase in monsoon wind speeds and WPD with magnitude relative to warming levels. As with projection studies based on GCMs and RCMs, there are biases in results due to initialization and parameterization schemes (Tobin et al 2015), limited physical processes representation (Stouffer et al 2017) and or model dynamics (Monrie et al 2020) which inevitably leads to uncertain and mixed results regarding the future prospects of wind energy not only globally but also in Africa (Sawadogo et al 2020).
To achieve improved representation and reduce uncertainty in climate projections, the CMIP phases provide large-scale coordinated simulations from state-of-the-art GCMs. The latest of such is the new generation CMIP6 models (Eyring et al 2016) that are now available for academic, scientific and research use. Assessing how well the CMIP6 models would reproduce the wind characteristics over West Africa and exploring the robustness of the projected changes in WPD is particularly crucial to meet the recent needs of energy stakeholders. Thus, the aim of this study is to investigate the future changes in wind speed and WPD over West Africa using the newly developed CMIP6 models. Before assessing the future changes in wind speed and WPD, the CMIP6 models were validated by comparing them to the newly developed ERA5 reanalysis wind.
2. Data and methodology
2.1. CMIP6 and ERA data
Output from 14 CMIP6 models (Eyring et al 2016; see table 1 for institutions, model names, primary reference, and spatial resolution information of each model) simulations that was available at the time of this analysis were used in this study. For each model, daily 10 m surface wind speed and directions from the first realization ('r1i1p1f1') for both the historical and projected (shared socioeconomic pathways; SSP5-8.5; O'Neill et al 2016) experiments were used. Since actual ground-based wind speed and direction dataset over West Africa are sparse and not publicly available, we used the recently released ERA5 (Hersbach et al 2019) reanalysis near surface wind speed and directions for model's validation. The ERA5, a fifth-generation reanalysis developed by the European Centre for Medium-Range Weather Forecasts has a horizontal grid spacing of about 31 km. This version has higher spatial and temporal resolution and various improvements.
Table 1. Information of the 14 CMIP6 climate models used in this study.
| S/N | Model | Institute | Resolution (°lon × °lat) | References |
|---|---|---|---|---|
| 1 | ACCESS-CM2 | Commonwealth Scientific and Industrial Research Organisation | 1.88 × 1.25 | Dix et al (2019a), Dix et al (2019b) |
| 2 | ACCESS-ESM1-5 | Commonwealth Scientific and Industrial Research Organisation | 1.88 × 1.24 | Ziehn et al (2019a), Ziehn et al (2019b) |
| 3 | BCC-CSM2-MR | Beijing Climate Center (BCC) and China Meteorological Administration (CMA) | 1.13 × 1.13 | Wu et al (2018), Xin et al (2019) |
| 4 | CanESM5 | Canadian Earth System Model | 2.81 × 2.81 | Swart et al (2019a), Swart et al (2019b) |
| 5 | CMCC-CM2-SR5 | Euro‐Mediterranean Centre on Climate Change coupled climate model | 1.25 × 0.94 | Lovato et al (2020a), Lovato et al (2020b) |
| 6 | EC-Earth3 | EC-EARTH consortium | 0.70 × 0.70 | EC-Earth (2019a), EC-Earth (2019b) |
| 7 | GFDL-ESM4 | Geophysical Fluid Dynamics Laboratory (GFDL) | 1.25 × 1.00 | Krasting et al (2018), John et al (2018) |
| 8 | INM-CM4-8 | Institute of Numerical Mathematics | 2.00 × 1.50 | Volodin et al (2019a), Volodin et al (2019b) |
| 9 | INM-CM5-0 | Institute of Numerical Mathematics | 2.00 × 1.50 | Volodin et al (2019c), Volodin et al (2019d) |
| 10 | IPSL-CM6A-LR | Institute Pierre-Simon Laplace (IPSL) | 2.50 × 1.26 | Boucher et al (2018), Boucher et al (2019) |
| 11 | MIROC6 | Japanese Modeling Community | 1.41 × 1.41 | Tatebe and Watanabe (2018), Shiogama et al (2019) |
| 12 | MPI-ESM1-2-HR | Max Planck Institute | 0.94 × 0.94 | Jungclaus et al (2019), Schupfner et al (2019) |
| 13 | MPI-ESM1-2-LR | Max Planck Institute | 1.88 × 1.88 | Wieners et al (2019a), Wieners et al (2019b) |
| 14 | MRI-ESM2-0 | Meteorological Research Institute (MRI) | 1.13 × 1.13 | Yukimoto et al (2019a), Yukimoto et al (2019b) |
The CMIP6 models and ERA5 datasets were regridded to a common grid of 2.81° × 2.81° (latitude × longitude) using an area-conserving remapping procedure, which is implemented in the Climate Data Operators (https://code.zmaw.de/projects/cdo) to produce multi-model summary statistics based on the lowest model resolution. In order to reduce uncertainty in this study, the multi-model ensemble mean of all the CMIP6 simulations defined herein 'EnsMean' was used following Akinsanola and Zhou (2019).
2.2. Methodology
The WPD (unit: W m−2) is an important measure for assessing the potential of wind energy generation in a location (Emeis 2013), and is defined in equation (1) as
where V is the wind speed at the adjusted-to-turbine hub height (taking herein as 90 m), and  is the air density (standard conditions are assumed for
  with a constant value of 1.225 kg m−3). In order to compute the WPD, most studies extrapolate the 10 m surface wind speed to the desired turbine hub height. There are numerous methods of extrapolating 10 m surface wind measurements to the turbine hub height. The power law method (Emeis 2005) defined in equation (2), used in this study assumes that wind speed at a certain height z is approximated by
where z is the height at turbine hub height (taking as 90 m),  is the reference height, wspd(
 ) is the wind speed at
  , and
, and  is the power law exponent. The near-surface wind speeds at 10 m is used in this study as the reference height wind speeds and we assume that
  = 1/7, as it is appropriate for open land surfaces and has been used in previous studies over the region (e.g. Akinsanola et al
2017, Sawadogo et al
2019). In this study, the WPD was calculated at each grid point over the study area for both the CMIP6 simulations (historical and SSP5-8.5) and ERA5 dataset. All the analyses and calculations presented in this study are for annual and entire seasonal means defined herein as: ANN (January–December), DJF (December–January–February), MAM (March–April–May), JJA (June–July–August), and SON (September–October–November), and were integrated over the West African domain (see figure S1 (available online at stacks.iop.org/ERL/16/044033/mmedia) in the supplementary information) and further assessed over the three subregions namely: Guinea coast (4°–8° N, 20° W–20° E), Savannah (8°–11° N, 20° W–20° E), and Sahel (11°–16° N, 20° W–20° E). The ability of the CMIP6 models to reproduce the regions near-surface wind speed is first evaluated by comparing the historical simulations with ERA5 reanalysis. Both spatial assessment and statistical approach (percentage bias, normalized root mean square error (NRMSE), and the pattern correlation coefficient (PCC)) were used to evaluate these models. We compute the projected changes by comparing two 30 year time slices from the projections (2040–2069, 2070–2099) to the historical period of 1985–2014, and the statistical significance was evaluated using a t-test. Also, grid points where at least 70% of the ensemble members agree on the sign of change in the EnsMean were further assessed, which provides further insight into the robustness of the projected changes.
= 1/7, as it is appropriate for open land surfaces and has been used in previous studies over the region (e.g. Akinsanola et al
2017, Sawadogo et al
2019). In this study, the WPD was calculated at each grid point over the study area for both the CMIP6 simulations (historical and SSP5-8.5) and ERA5 dataset. All the analyses and calculations presented in this study are for annual and entire seasonal means defined herein as: ANN (January–December), DJF (December–January–February), MAM (March–April–May), JJA (June–July–August), and SON (September–October–November), and were integrated over the West African domain (see figure S1 (available online at stacks.iop.org/ERL/16/044033/mmedia) in the supplementary information) and further assessed over the three subregions namely: Guinea coast (4°–8° N, 20° W–20° E), Savannah (8°–11° N, 20° W–20° E), and Sahel (11°–16° N, 20° W–20° E). The ability of the CMIP6 models to reproduce the regions near-surface wind speed is first evaluated by comparing the historical simulations with ERA5 reanalysis. Both spatial assessment and statistical approach (percentage bias, normalized root mean square error (NRMSE), and the pattern correlation coefficient (PCC)) were used to evaluate these models. We compute the projected changes by comparing two 30 year time slices from the projections (2040–2069, 2070–2099) to the historical period of 1985–2014, and the statistical significance was evaluated using a t-test. Also, grid points where at least 70% of the ensemble members agree on the sign of change in the EnsMean were further assessed, which provides further insight into the robustness of the projected changes.
3. Results and discussion
3.1. Evaluation of present-day wind characteristics
The spatial distributions of annual and seasonal mean wind speed and direction is presented in figure 1 for ERA5 reanalysis, EnsMean, and their relative biases (i.e. EnsMean minus ERA5) during the historical period of 1985–2014. The EnsMean is able to skillfully reproduce the spatial wind distribution (both the speed and direction) observed in the ERA5 on both annual and seasonal timescales. Broadly, the average offshore wind speed is nearly twice the onshore wind while wind direction was majorly south-easterly (north-easterly) below (above) the equator with a range of 2–8 ms−1. Near the shore and onshore, the wind direction is dominated by north-easterly in DJF (figure 1(d)), northerly in MAM (figure 1(g)), south-westerly in JJA (figure 1(j)), and partly north-easterly and easterly in SON (figure 1(m)) above the equator. Over the continental area (i.e. offshore), the wind speed is maximum in DJF onshore around the Sahelian region with a magnitude of about 8 ms−1, reducing through MAM, JJA, and SON to about 5 ms−1. The spatial plots show that coastal areas in Liberia, Sierra Leone, Guinea, and Gabon recorded the lowest wind speeds of about 2–4 ms−1 on both annual and seasonal timescales.

Figure 1. Spatial distribution of annual and seasonal mean wind speed and direction during the historical period, 1985–2014 for (a), (d), (g), (j), (m) ERA45, (b), (e), (h), (k), (n) EnsMean, and (c), (f), (i), (l), (o) relative biases. Grid point with statistically significant differences in (c), (f), (i), (l), (o) are marked with black stippling.
Download figure:
Standard image High-resolution imageThe EnsMean (figures 1(b), (e), (h), (k) and (n)) was able to capture most of the climatology details observed in ERA5 reanalysis similar to the findings of Sawadogo et al (2020), although considerable biases still exist. For instance, for the annual spatial wind speed (figure 1(c)), the EnsMean significantly overestimated the ERA5 over the Sahel and western half of Nigeria by about 30%–40%. Below 5° N, the EnsMean underestimate the annual wind speed by about 10%–20%, evident over southern Nigeria and Cameroun. These biases are statistically significant at 95% level. Seasonally, underestimation by the EnsMean was similarly more pronounced below 5° N and east of 8° E (around Cameroun) with peak value of about −40% observed in DJF and JJA and statistically significant only in the latter. Wind speed was overestimated by about 40%–60% in northern Nigeria albeit significant only in the north-east in DJF, while underestimations of only about −10% to −20% is observed below the 10° N that is significant only in parts of Guinea and Sierra Leone, as well as Ghana. MAM (figure 1(i)) showed slight levels of overestimation above the 10° N and in Sierra Leone while the region below 5° N latitude is again under-estimated. Underestimation (overestimation) is significant and high (i.e. about 30%–50%) around south-western Cameroun and Equatorial Guinea (Nigeria, Benin, Burkina Faso and Mali) in JJA shown in figure 1(l) while SON (figure 1(o)) appeared to have the least average biases as only a few areas shows high large differences with majority of the study domain showing a significant overestimation (underestimation) of about 10% above (below) the 6° N latitude.
3.2. Descriptive statistics and assessment of individual model performance
The ability of the ensemble members alongside their EnsMean to realistically represent historical 10 m wind speed is further assess across all the three subregions (i.e. Guinea coast, Savannah and Sahel) using a portrait diagrams and results presented in figure 2. Relative to ERA5, the percentage bias, NRMSE, and pattern correlation of the CMIP6 wind speed was investigated. Most of the models including the EnsMean showed percentage bias within the ±20% range over the Guinea coast although the negative bias was more than the positive bias. MRI-ESM2-0, MPI-ESM1-2-LR, MPI-ESM1-2-HR, MIROC6, and IPSL-CM6A-LR (BCC-CSM2-MR) all showed negative (positive) bias for the ANN, DJF, MAM, JJA, SON timescales as shown in figure 2(a) indicating an underestimation (overestimation) of near surface wind speed. INM-CM5-0, INM-CM4-8, and GFDL-ESM4 showed zero bias predominantly but with some overestimation (i.e. positive bias) in MAM and DJF. The Savannah subregion (figure 2(b)) showed a lot of positive biases, peaked around 40%–50% in BCC-CSM2-MR model for all timescales. Sahel on the contrary (figure 2(c)) exhibited varying levels of positive biases in most models and more pronounced in MRI-ESM2-0 and BCC-CSM2-MR models. One major difference between the Sahel subregion and others (i.e. Guinea coast and Savannah) is that the EnsMean also showed considerable positive bias, perhaps due to the individual model performances over the subregion. The bias at annual timescale appeared to be minimal over the three subregions when compared to the seasonal statistics. Overall, the CMIP6 multi-model mean performs better than most individual models at capturing the near surface wind speed over the subregions.

Figure 2. Portrait diagrams showing (a)–(c) percentage bias, (d), (e) NRMSE, and (g)–(i) PCC between ERA5 and all the CMIP6 models and EnsMean over Guinea coast (a), (d), (g), Savannah (b), (e), (h), and Sahel (c), (f), (i) subregions. The descriptive statistics are for annual and seasons.
Download figure:
Standard image High-resolution imageFigures 2(d)–(f) shows the results of the NRMSE scaled from 0 to 1. Over the Guinea coast (figure 2(d)), only MIROC6 exceeded 0.6 in DJF while MIROC6, IPSL-CM6A-LR, INM-CM5-0, INM-CM4-8, and EnsMean all have NRMSE of about 0.4 across the timescales. In the Savannah subregion (figure 2(e)), IPSL-CM6A-LR had the highest NRMSE of 0.8 followed by NRMSE of 0.6 in BCC-CSM2-MR in JJA and SON, and MIROC6 in DJF. Compared to the Guinea coast subregion, most of the models had NRMSE of around 0.2 for all timescales considered in the Savannah subregion. Most of the CMIP6 models in the Sahel subregion (shown in figure 2(f)) exhibit smaller NRMSE value (less than 0.25) across all timescales. The EnsMean performance is relatively similar across all the timescales and subregions. Furthermore, the PCC results for the models are shown in figures 2(g)–(i) for the Guinea coast, Savannah, and Sahel subregions respectively. For all the timescales considered, all the CMIP6 models had a PCC greater than 0.9 essentially indicating a good level of agreement with the ERA5. Peak PCC value of 0.98 was observed at least once in all the subregions and all the seasons albeit most pronounced in the Sahel subregion at annual timescale. These results provide reliable information on individual model performance in reproducing near surface wind speed over the region, addressing a research gap identified by Sawadogo et al (2019). Most of the CMIP6 models alongside their EnsMean exhibited relatively high PCC, low percentage biases and NRMSE thus highlighting a realistic representation of near surface wind speed over West Africa. Also, our results demonstrate that no single model is consistently the most reliable across all the timescales and subregions.
3.3. Projected changes in wind speed at turbine hub height
The spatiotemporal projected changes in wind speed at turbine hub height (i.e. 90 m) for the period 2040–2069 and 2070–2099 relative to the historical period of 1985–2014 is presented in figure 3 (percentage values) and figure S2 in the supplementary information (absolute values) for annual and seasonal timescales. At the annual timescale, the EnsMean project a statistically significant increase in hub-height wind speed for both 2040–2069 and 2070–2099 period by more than 40% along the 4°–11° N latitude belt, this increase is robust as at least 70% of the ensemble members agree on the sign change in the EnsMean. We found a robust statistically significant slight reduction (around −8%) in the eastern Sahel, evident only in the 2040–2069 period while parts of western Sahel exhibit similar robust decrease in 2070–2099 period. The observed projected changes at annual timescale is similar for all the seasons, although most grid points exhibit projected increases in wind speed than decreases and intensified towards the end of the century (2070–2099) than mid-century (2040–2069).
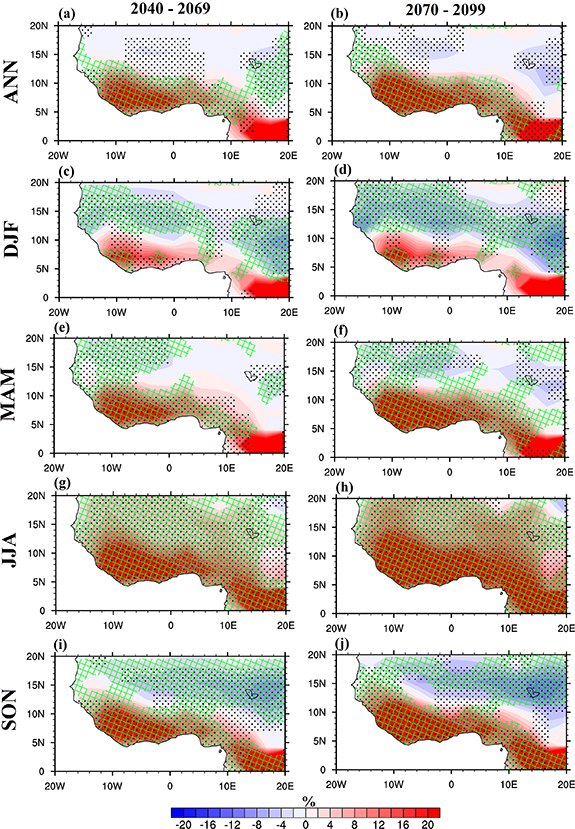
Figure 3. Projected changes in annual and seasonal wind speed at 90 m height over the period 2040–2069 and 2070–2099 relative to the historical period 1985–2014 for (a), (b) annual, (c), (d) DJF), (e), (f) MAM, (g), (h) JJA, and (i), (j) SON. Hatching in indicates grid points where at least 70% of the GCMs agree on the sign of the change in EnsMean, and areas with statistically significance differences at 95% confidence level are marked with black stippling.
Download figure:
Standard image High-resolution imageMore specifically, in DJF season (figures 3(c) and (d)), there is a projected robust reduction in wind speed over the entire Sahelian belt. These future decreases are statistically significant over most grid point and at least 70% of the model agree on the sign of change of the EnsMean. Future intensification dominates major parts of the Guinea coast, although only few grid points are statistically significant and have at least 70% intermodel agreement. The region of robust increase includes parts of the Fouta Djallon highlands, Ghana, and eastern Cameroon. The overall changes are consistent between the mid and end of 21st century, although relative spatial differences exist. In MAM shown in figures 3(e) and (f) however, there are slight differences compared to DJF and ANN both spatially and temporally. Strong increases that are statistically significant are observed in the Guinea coast and southern Savannah, this reduces eastward from about 16% to about 4%. Northwest of 11° N, there is a significant projected decrease in wind speed of around 6%. As in DJF, the projected late century MAM wind speed (figure 3(f)) is considerably higher (lower) for areas with projected increase (decrease) when compared to the mid-century albeit with similar spatial changes.
Furthermore, the JJA and SON (figures 3(g)–(j)) seasons show the highest projected robust changes. The projected changes in most grid points across West African have either statistically significant or have at least 70% of the ensemble members agreeing on the sign of change in the EnsMean. The JJA exhibit widespread spatial future intensification in wind speed that range from 14%–18% (2%–6%) below (above) 10° N in 2040–2069 and about 16%–20% (4%–8%) also observed below (above) the 14° N in 2070–2099. In terms of the absolute values (figure S2 in the supplementary information), the sign of the projected changes are spatially consistent across all the timescales with the percentage values. Robust projected increase is also evident in JJA and ranges from +0.2 to +0.6 m s−1 (+0.6 to +1.2 m s−1) in 2040–2069 (2070–2099). Worthy of note is a slight statistically significant increase (although with no intermodel agreement) in wind speed for both mid-century and late century over the eastern Guinea coast. In SON (figures 3(i) and (j)), there is a more widespread future decrease in wind speed above the 10° N that is statistically significant east of the 2° W alongside high intermodel agreement. The magnitude of the decrease is about 4%–10% in the 2040–2069 and 6%–16% in 2070–2099 period. Below 10° N, projected intensification in wind speed reaching around 16%–20% dominates the mid-century period. Similar but intense increase is evident in the late century. The overall changes are robust considering the high intermodel agreement and widespread statistically significant grid points.
3.4. Projected changes in wind power density at turbine hub height
To provide more robust study results, as well as accommodate the cubic relationship between wind speed and wind power, the projected changes in WPD based on the EnsMean is examined and presented in figures 4(a)–(j) for percentage values (figures S3(a)–(j) in the supplementary information for the absolute values). The WPD is projected to increase annually by about 50%–60% in most parts of the Guinea coast subregion in the mid-century (figure 4(a)), specifically in parts of Sierra Leone, Liberia, Cote D'Ivoire, Ghana, Togo and Benin. Eastward intensification towards Nigeria and Cameroun is evident in the late century (figure 4(b)). The observed increases are statistically significant and have majority of the ensemble members agreeing on the sign of change in the EnsMean. Although slight statistically significant projected decrease (about 15%) is evident around 12°–20° E, majority of the models disagree on the sign of change in the EnsMean in the late century.

Figure 4. Same as figure 3 but for WPD.
Download figure:
Standard image High-resolution imageIn figure 4(c) along the Savannah and Sahel (Guinea) subregions, there is statistically significant projected WPD decrease of about 10%–20% (20%–30%) in the west (east) of the study domain during DJF. On the west of the Guinea coast however, there is some increase in WPD with a range of 30%–50% significant only in the coastal parts of Sierra Leone, Liberia, Cote D'ivoire, Ghana, Togo, Benin, and Nigeria; and in some countries below the 5° N latitude. For the late century i.e. 2070–2099 (figure 4(d)), a statistically significant slight decrease of WPD is observed over the 12°–18° N belt that shifted southward to the 10°–15° N belt east of the 6° E longitude. In MAM, the spatial characteristics for both mid-century (figure 4(e)) and late century (figure 4(f)) are similar but the magnitude is higher in the latter. Most grid points over the eastern (mid-) Guinea coast exhibit projected increase in WPD of about 30%–60% (40%–60%) that is both statistically significant and has majority GCMs agreement while the areas above the 10° N appear to have less than 10% decrease. The magnitude of the increase is higher in 2070–2099 relative to 2040–2069 especially along the mid-Guinea coast gaining almost 10%–20% more WPD.
The projected WPD increase observed in JJA (figures 4(g) and (h)) is widespread, albeit higher in the Guinea coast and Savannah than Sahel. For the 2040–2069 period, an increase of about 60%–80% is observed around and below the 11° N latitude while for the 2070–2099 period, the maxima line advances northward to the 15° N. Notably also, the increase in WPD in the north of the study domain is more pronounced and stronger in the late century than mid-century. The increase in all these areas and regions were statistically significant, and majority of the individual models agree with the observed increase in the EnsMean. Similar patterns are observed in SON (figures 4(i) and (j)), although the changes are more diverse with the areas above (below) the 10° N showing future decrease (increase) in WPD of about 10%–30% (40%–70%) in the mid-century. In both mid-century and late century, all areas with significant increase (decrease) in WPD have high intermodel agreement. The results of the absolute projected changes presented in figure S3 in the supplementary information are spatially consistent across all the timescales with the relative changes.
3.5. Subregional projected changes in wind power density
Figures 5(a)–(f) shows the projected changes in WPD for all the CMIP6 ensemble members alongside their EnsMean across all the three homogenous subregions of West African and all the timescales, for both the mid-century and late century. The overall changes for the ensemble members range for 2040–2069 (2070–2099) period are −22% to +50% (−25% to +65%), −28% to +60% (−40% to +80%), and −40% to +50% (−55% to +95%) for Guinea coast, Savannah, and Sahel subregions respectively. For the Guinea coast subregion (figures 5(a) and (b)), across all the timescales considered, the EnsMean exhibit a projected increase in WPD except DJF in the 2070–2099 period. The EnsMean projected WPD increased by about 10%–28% over the subregion, with high intermodel agreement among the ensemble members, except in DJF in both mid-century (figure 5(a)) and late century (figure 5(b)) where model agreement was split 50:50. The projected increase was maximum in the JJA season and least in DJF for 2040–2099, while it was maximum in JJA and least in ANN in 2070–2099 period. Under the conventional RCP8.5 scenario, Sawadogo et al (2019) similarly projected an increase in WPD over the Guinea coast subregion dependent on warming level. In the Savannah subregion shown in figures 5(c) and (d), DJF again shows a decrease in WPD for both mid and late century. Projected changes intensified in 2070–2099 from mid-century values, supported by high intermodel agreement. DJF showed a decrease in WPD for both mid and late century with 100% intermodel agreement, but ANN and SON despite projected increase had only about 70%–80% of the models agreeing to the projected increase. The EnsMean projected increase is about 7% (10%) in ANN, 4% (10%) in MAM, 22% (34%) in JJA, and 12% (21%) in SON for mid (late)-century. At least three of the models projected WPD decrease in ANN and SON for mid-century (figure 4(c)) and late century (figure 4(d)), creating a range of −30% to +45% for 2040–2069 and −30% to +62% for 2070–2099 in SON. Furthermore, the WPD in the Sahel subregion is projected to decrease in all seasons except JJA for both mid and late century as shown in figures 5(e) and (f) respectively. WPD increased by about 12% (28%) in mid (late)-century, with all but three models (21%) agreeing on the sign of change over a range of −5% to +50% (−5% to +95%). At least ten of the models (71%) agree with the decrease over the subregion typified in the EnsMean for ANN, DJF, MAM, and SON while the remaining three models (21%) projected increase in WPD over the subregion, especially in ANN and SON where one model projected about 10% increase for both mid-century and late century. Across all the time scales and subregions, the sign of the absolute projected changes presented in figure S4 in the supplementary information is consistent with the percentage values.

Figure 5. Subregional projected changes in WPD over the period 2040–2069 and 2070–2099 relative to the historical period 1985–2014 over (a), (b) Guinea coast, (c), (d) Savannah, and (e), (f) Sahel.
Download figure:
Standard image High-resolution image
4. Summary and conclusion
Detailed projections of changes in wind speed and WPD are crucial for the development and sustainability of not only wind power systems, but also energy supply, thus overcoming energy crisis. The recent improvement in climate models (ranging from improved model physics to better representation of physical processes, among others) allows a more robust projection of wind energy potential. Spatial and temporal projected changes in mean turbine hub height wind speed and WPD over West Africa for the mid-century (2040–2069) and late-century (2070–2099) were examined using the most recent CMIP6 models. These changes were computed by comparing two future time slices with the historical period of 1985–2014. Before exploring the projected changes in wind speed and WPD, the CMIP6 models alongside their multi-model EnsMean were evaluated by comparing the model's near surface wind speed and direction data with the recently released ERA5 reanalysis data on annual (ANN) and seasonal (DJF, MAM, JJA, and SON) timescales.
The CMIP6 EnsMean was able to realistically reproduce the spatial distribution of present-day (1985–2014) wind speed and direction. The climatological monsoonal reversal of wind direction from north-easterly in DJF to south-westerly in JJA over the continental area of West Africa was accurately captured by the EnsMean. A thorough examination showed that the EnsMean performs better than most individual models at capturing the near surface wind speed over the region based on low percentage bias and NRMSE and relatively high PCC when compared to ERA5. Across all the ensemble members, the relative bias ranged from −40% to +50%, albeit more-overestimations in near surface wind speed were observed in the Sahel subregion. BCC-CSM2-MR exhibited the highest biases that peaked across all the timescales in the Savannah subregion. The NRMSE was highest in the Savannah subregion, with IPSL-CM6A-LR model having the maximum value of 0.8 in SON. Relative to ERA5, all the ensemble members have PCC greater than 0.9 across most of the timescales and all the subregions.
Projected intensification (about 20%) in hub height wind speed dominate the JJA, with highest magnitude over the Guinea coast subregion. This projected increase is remarkably robust as most grid points are either statistically significant at 95% level or have at least 70% of the ensemble members agreeing on the sign of the EnsMean or both. Wind speed decreased in SON and DJF over the Sahel subregion, with the magnitude of decrease intensifying towards the end of century. For both wind speed and WPD, the intra-seasonal variability is typified by the northward advancement of the maxima line in MAM and JJA and the southwards retreat of the same in SON and DJF. We found a projected intensification of WPD also in JJA (around 70%) and least in DJF, albeit only the Guinea coast subregion consistently showed significant increase with high intermodel agreement across all timescales. While JJA appeared to exhibit only projected increase in wind characteristics, SON and DJF showed increases (decreases) below (above) 10° N. It is pertinent to state here that the projected increase also has strong temporal qualities, with the end of century (2070–2099) changes showing stronger magnitude compared to the mid-century (2040–2069) changes. Subregions and seasons with increased (decreased) wind characteristics show higher (lower) values and or larger spatial coverage in the 2070–2099 projections resulting in a shrinkage of areas with null changes. The results also showed that the Sahel subregion was the most impacted with average projected WPD decrease while the Guinea coast and Savannah subregion gained the most in terms of projected WPD increase, with Guinea coast and Savannah exhibit high intermodel agreement. Essentially, the Guinea subregion is the most profitable for commercial wind power development especially in coastal areas where projected WPD increased relative to present-day values.
Overall, this study provides useful state-of-the-art information on wind power characteristics over West Africa by focusing on the improved representation and more robust features provided by recent coupled climate models (i.e. CMIP6 models). Despite the novelty and timeliness of this study, reducing uncertainties in projections due to model bias and/or accuracy could greatly benefit future studies. Also, temporal, seasonal, and geographical variations in atmospheric parameters (such as air density, roughness coefficient, and wind shear) may introduce some uncertainty into such projections as explored in Ulazia et al (2019). Nonetheless, the global long-term transition to renewable energy sources for environmental sustainability means that the results of this study are vital and perhaps quite overdue.
Acknowledgments
We acknowledge the support of the West Africa Science Service Centre on Climate Change and Adapted Land (WASCAL) and Climate Information for Integrated Renewable Electricity Generation (CIREG). We appreciate the World Climate Research Programme's (WCRP) working group on coupled modelling which is responsible for CMIP6 models. The authors acknowledge the climate modelling groups listed table 1 for producing and making their model outputs available and ESGF for archiving the model outputs and providing access. We are also grateful to the services that have operated the ERA5 datasets.
Data availability statement
The data that support the findings of this study are openly available at the following URL/DOI: https://esgf-node.ipsl.upmc.fr/projects/cmip6-ipsl/ and www.ecmwf.int/en/forecasts/datasets/reanalysis-datasets/era5.