

Abstract
The growing number of oxygen-deficient coastal zones around the world and their impacts on marine life has always been a controversial issue as their development is largely attributed to anthropogenic activities which can be mitigated by human actions. However, contrary to this prevailing understanding, we show here for the first time, using new coherent datasets from estuaries to coastal to offshore regions, that the world's largest hypoxic-anoxic zone along the west coast of India is formed through a natural process, i.e. upwelling of deoxygenated waters during the summer monsoon. We further demonstrate that the persistence and extent of this coastal oxygen deficiency depend on the degree of deoxygenation of source waters for the upwelling. Consequently, the anoxia is confined only to the central shelf between 11° and 18° N, which is equivalent to almost half of the western Indian shelf, where upwelling brings suboxic waters from the core oxygen minimum zone in the Arabian Sea.
Export citation and abstract BibTeX RIS

Original content from this work may be used under the terms of the Creative Commons Attribution 4.0 license. Any further distribution of this work must maintain attribution to the author(s) and the title of the work, journal citation and DOI.
1. Introduction
Oxygen minimum zones (OMZs) in the world seas form either naturally or anthropogenically. The naturally-formed OMZs, where the physical and biogeochemical processes reduce and maintain the concentrations of dissolved oxygen at sub-oxic levels (down to ≤10 µM), are generally located in offshore regions, whereas the anthropogenically-derived OMZs, where eutrophication and growth of phytoplankton are the primary causes, mostly occur in the coastal regions (Diaz and Rosenberg 2008, Isensee et al 2016). In the last few decades, >500 coastal sites across the globe have been found to be impacted by such eutrophication-induced hypoxia (Diaz and Rosenberg 2008, Breitburg et al 2018).
Acute oxygen deficiency, down to 0–22 µM and extending over 180 000 km2, is recurrently occurring over the west coast of India during the summer monsoon (SM—June to September), making it the world's largest hypoxic to anoxic zone (Naqvi et al 2000). The development of such acute conditions has been attributed to the upwelling of Arabian Sea OMZ waters (Banse 1959, Carruthers et al 1959), and later, while reiterating this natural development it has also been hypothesized to be intensified by the anthropogenically induced eutrophication (Naqvi et al 2000). Despite several studies in the recent past that have addressed the biogeochemical effects of this coastal anoxia, it is still unclear the exact mechanism(s) i.e. natural vs terrestrial and/or their combination, and their detailed dynamics behind the formation of this largest coastal anoxia.
The perennial OMZ in the eastern Arabian Sea, a natural source of deoxygenation for the western Indian shelf, is sustained by high biological production through winter convection and upwelling (Madhupratap et al 1996), cross-shelf transport of organic matter (Sarma et al 2020a), and sluggish renewal of mid-depth waters (McCreary et al 2013). Based on the numerical modelling, it was suggested that physical processes/circulation plays a major role in regulating OMZ than primary production/nutrients inputs in the Arabian Sea (McCreary et al 2013). This is important because the dissolved oxygen concentrations of the Arabian Sea OMZ remained consistent during the past half-century (Breitburg et al 2018), and its upwelling has transformed a large part of the western shelf of India into an oxygen-deficient state (Banse 1959, Carruthers et al 1959).
Terrestrial inputs can also contribute to the formation of coastal deoxygenation but the recently emerged evidences suggest that this could not be the only cause. Unlike the major and perennial rivers that flow along the east coast of India into the Bay of Bengal, only small to medium rivers flow along the west coast of India discharging ∼76% less freshwater laden with nutrients into the Arabian Sea (Krishna et al 2016). Much of these discharges are confined to a shorter period of about four months coinciding with the SM, with peak discharges in July–August when >80% of runoff occurs that dilute the nutrient load. Though India is the second-largest fertilizer consuming country in the world, transport of nutrients to the coastal sea will be heavily constrained by their highest retention in these monsoonal rivers (∼91%; Krishna et al 2016) compared to those in the North America and western Europe (74%; Alexander et al 2002, Boyer et al 2002), and global watershed (80%; Caraco and Cole 1999). This is reflected in the stable isotopic composition of suspended organic matter over the central-western shelf of India which did not reveal significant anthropogenic contribution (Maya et al 2011). Even the minor fraction of nutrients that escape into the coastal sea may not be fully utilized by coastal phytoplankton since rivers also discharge significant amounts of suspended sediments which along with overcast skies during the SM limit the primary production. Besides, it has been shown recently that hypoxic to anoxic waters exist over the south-western shelf of India (Gupta et al 2016, Sudheesh et al 2016, 2020) where no major rivers exist and the degree of coastal deoxygenation remain stable despite the hinterland experienced large-scale developmental activities in the last five decades (Gupta et al 2016). Collectively, these recent studies are suggestive of yet another process, besides that of anthropogenic origin, being chiefly responsible for the observed seasonal deoxygenation over the west coast of India.
Nevertheless, the seasonal acute oxygen deficiency along the west coast of India is recurrently happening possibly by both natural and anthropogenic sources but with unknown relative importance. Using the systematic oceanographic Eastern Arabian Sea (EAS) basin-scale data collected from 7 to 10 transects running from estuaries through coastal to offshore regions during different phases of the SM of 2018 (figure 1), we prove that the influence of terrestrial inputs is meagre while the oceanic factors largely drive the development of hypoxia/anoxia along the west coast of India. Apart, we also have focused on the spatio-temporal variation in upwelling and its linkage between dissolved oxygen concentrations of the OMZ and development of anoxia confined only to the central shelf during the progression of SM, which are hitherto unknown.
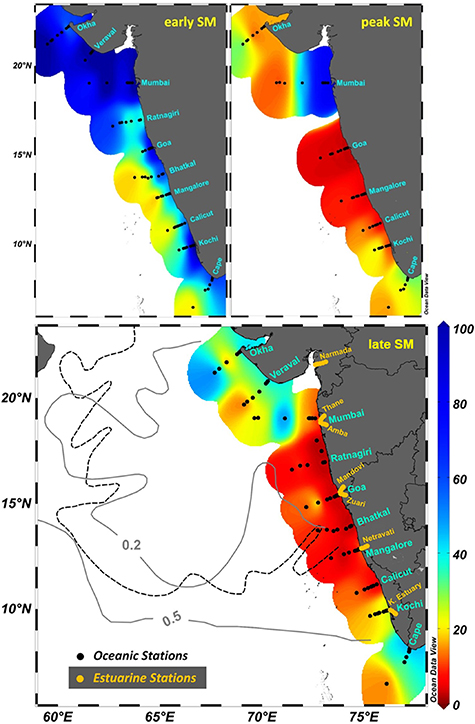
Figure 1. Study area and station locations overlaid on bottom oxygen (µM) during all three phases of SM. The dashed black line represents the boundary of OMZ/denitrification (Naqvi 1991), and solid grey lines of 0.2 and 0.5 ml l−1 (∼9 and 22 µM) represent oxygen distribution at 200 m (Wyrtki 1971). Progressive intensification of coastal oxygen deficiency during early to late SM is visible. Being proximate, core OMZ waters are sourced for upwelling onto the central shelf where anoxia prevailed.
Download figure:
Standard image High-resolution image2. Study area
The circulation in the EAS during the SM is characterised by an equator-ward West India Coastal Current (WICC), a poleward West India Under Current (WIUC) and the phenomenon of coastal upwelling (Shetye et al 1990). While this phase of WICC carries Arabian Sea High Salinity Watermass (ASHSW) from the north, the WIUC carries relatively ventilated waters towards the north (Naqvi et al 2006). The upwelling is supported by favourable winds/currents and propagates from south to north with time (Johannessen et al 1987), but its intensity weakens towards the north. These upwelling waters are sourced from the perennial OMZ (Banse et al 2014) and promote the development of deoxygenation over its shelf.
Among the estuaries discharging along the west coast of India (figure 1), the Kochi estuary in the south and Amba and Thane estuaries in the north are highly eutrophic compared to those in the central region, viz. Nethravati, Mandovi and Zuari, as the latter are less affected by the developmental activities.
3. Materials and methods
We made EAS basin-scale cruises during the three phases of SM viz. early SM (4 June to 9 July), peak SM (3 August to 6 September) and late SM (16 September to 8 October) of 2018 onboard FORV Sagar Sampada and ORV Sagar Kanya. Each cruise covered about 70–90 stations from 7 to 10 coast-offshore transects along the entire EAS (figure 1). Each transect was occupied between 30 and 2000 m depth contours, and additionally, very shallow stations (13 and/or 20 m) were occupied at Kochi, Mangalore, Goa, Mumbai, and Okha. Parallelly, seven main estuaries (downstream regions towards mouth) along the western India (figure 1), debouching adjoining our cruise transects, were studied twice during early SM (June) and late SM (September). The temperature and salinity profiles were recorded using a new Conductivity-Temperature-Depth (CTD) profiler (SBE 11 Plus, Sea-Bird, USA for cruises and SBE 25 for estuaries). Samples were collected from Niskin bottles attached to CTD rosette (cruises) and manually (estuaries).
Samples for dissolved oxygen were collected in 125 ml glass bottles, fixed by adding 1 ml of Winkler A (with Azide to remove nitrite interference) and Winkler B, and titrated against 0.001 N sodium thiosulphate potentiometrically (907 Titrando, Metrohm, Switzerland) (Carritt and Carpenter 1966). The small amount of oxygen carried by the reagents was not subtracted, and oxygen was estimated with a precision of ±0.15 µM. The new dissolved oxygen sensor (SBE 43, Sea-Bird) attached to CTD was maintained wet and rinsed regularly with 0.1% Triton X-100 followed by a rinse with fresh water. The oxygen sensor data, well correlated against the measured values (n = 1062; p< 0.001) across the water column, was used in this study. Apparent oxygen utilisation was calculated according to Garcia and Gordon (1992). Samples for nutrients, filtered through Whatman GF/F and preserved with saturated mercuric chloride (0.5% v/v), were analysed using an autoanalyser (Skalar San++) following standard methods (Grasshoff et al 1999), except nitrate which was analysed following the method of García-Robledo et al (2014). Ammonium was measured spectrophotometrically (Grasshoff et al 1999). The precisions of nitrate, nitrite, ammonium, and phosphate were ±0.01, ±0.03, ±0.1 and ±0.01 µM, respectively.
For particulate organic matter, 4–6 l of seawater was filtered through 47 mm Whatman GF/F filters (precombusted at 400 °C for 4 h) and preserved at −40 °C. The overnight oven-dried filters for carbon were decarbonated with HCl fumes, whereas nitrogen isotopic composition was measured from untreated filters. Carbon and nitrogen isotopic composition in these filters were analysed using an isotope ratio mass spectrometer attached to an elemental analyser (Thermo Flash 2000 + Delta V) with a precision of <0.1‰ and <0.3‰, respectively. Dissolved organic carbon and nitrogen in the filtrates were analysed using a TOC-TN analyser (Shimadzu) with an accuracy of ±1%. Chlorophyll a in the seawater (2–3 l filtered onto 25 mm Whatman GF/F filters in dark and stored at −80 °C) was extracted in 100% methanol and analysed using high performance liquid chromatography (Shimadzu Prominence) (Roy et al 2015).
4. Results and discussion
4.1. Significance of anthropogenic effect on coastal deoxygenation
Temporal changes between early, peak and late phases of the SM upwelling showed two significant features (figure 1): the gradual intensification of shelf oxygen deficiency from hypoxic during early SM to suboxic/anoxic by late SM and the other, a gradient in it, with the suboxia/anoxia (⩽5 µM) confined to the central shelf between 11º and 18º N, and hypoxia prevailing to the north and south of it. This reflects that almost half of the western Indian shelf in the central region is under acute stress. There are several factors that appear to unrelate the development of this coastal anoxia to the anthropogenic effect. First, the anoxic central zone is located away from receiving significant anthropogenic inputs unlike in the coastal waters off Kochi (10º N) in the south and Mumbai (19º N) in the north, the two largest coastal cities of west India, which receive substantial allochthonous inputs, yet remained at hypoxia during entire SM. The increased anthropogenic activities have not impaired these coastal waters (Balachandran 2001) as evident from their decadal changes. The Kochi estuary has been transformed from an autotrophic to a highly heterotrophic system between 1965 and 2005 (Gupta et al 2009) due to a 4–6 fold rise in anthropogenic nutrients (Martin et al 2010). Yet, its SM coastal hypoxia remains unchanged during this period (Gupta et al 2016) because the fast turnover rates of nitrogen within the flushing times of the estuary (Bhavya et al 2016) limits its export impact to the nearshore regions only (Gupta et al 2016, Bhavya et al 2017, 2018). This is also true with other monsoonal estuaries of west India which are acting as heavy sink zones and export only <10% of anthropogenic nutrients to the coastal sea (Krishna et al 2016).
Second, nutrient concentrations in the lower reaches of seven main estuaries along the west coast during early and late phases of SM showed more than two-fold lower concentrations in the estuaries of the central region, where coastal anoxia is confined, than those in the northern and southern regions (figure 2). Though not measured, the estuarine nutrients during peak SM can contribute to coastal deoxygenation. But the high nearshore surface salinity (upper 4 m) at the central shelf (Mangalore and Goa) during peak SM (34.27–35.36) compared to that of Kochi (24.26) shows weak runoff over the former shelf (figure 3), still, it maintained with nitrate replete (9.5–13 µM) and anoxic conditions (figure 1).
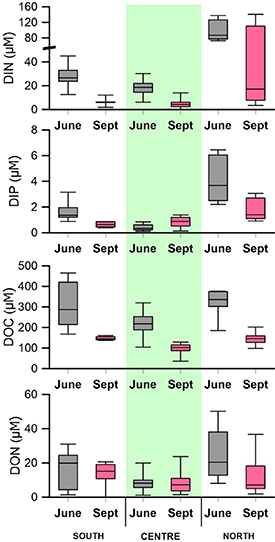
Figure 2. Water quality of the estuaries in downstream (towards mouth) along the north, central and southwest coast of India during early SM (June) and late SM (September). North estuaries are represented by Amba and Thane (Mumbai), Narmada (Bharuch); centre estuaries by Mandovi and Zuari (Goa), Nethravati (Mangalore), and south by Kochi estuary. Central estuaries carry the lowest nutrient concentrations to the adjoining coastal sea where severe anoxia sustains (figure 1).
Download figure:
Standard image High-resolution image
Figure 3. Surface salinity and isotopic signals of particulate organic carbon and nitrogen along the west coast of India. Except Mumbai and Okha sections which start from inner shelf stations (20 m) on x-axis, rest of the sections start from nearshore stations (13 m) and extend up to mid-shelf (50 m). Except at Kochi nearshore during the late SM when runoff was at a minimum, anthropogenic signals along the rest of the coast are highly insignificant. Exceedingly high δ15NPN (>10‰) values off Okha are due to the mineralisation of macro-tidal induced suspended organic matter from the mud-flats.
Download figure:
Standard image High-resolution imageThird, we examined the data on the stable isotopic composition of particulate organic carbon (POC) and nitrogen (PN) during the SM (figure 3). High δ15NPN (15.8 ± 1.6‰) and low δ13CPOC (−31.5 ± 1‰) were found in the sewage from a coastal outfall at Mumbai (Sarma et al 2019). These δ15NPN are distinctly higher than our measured values at nearshore regions of Kochi (7.7‰–7.8‰) and the rest of the west coast (8‰–13‰) including those reported off Goa earlier (7.77 ± 1.57‰; Maya et al 2011), indicating an absence of anthropogenic influence due to intense mixing and rapid dilution of these waters once enter the coastal sea. Similarly, except nearshore waters of Kochi during late SM (−15.3‰), the δ13CPOC from rest of the coast, including the anoxic central zone (−20‰ to −25.5‰) and off Goa (−19.0 ± 0.67‰; Maya et al 2011), largely fell in the range reported for organic matter of marine origin (−18‰ to −24 ‰; Cloern et al 2002, Bouillon et al 2003). Since the nearshore waters of Kochi show high δ13CPOC with high salinity during late SM, it precludes the possibility of significant terrestrial influence as it is quite close to the values observed for sea grass or macroalgae (−16‰ to −19‰; Hondula and Pace 2014). Notably, δ13CPOC (−21.7‰ to −22.2‰) during the maximum runoff conditions at Kochi nearshore during peak SM (salinity 24.26–28.1) also did not deviate significantly from the typical marine signature, when it maintained with bottom hypoxia (17–31 µM). These are in accordance with the last three decadal regular monitoring of coastal waters around India, which shows that the coastal waters within ∼2 km from the vicinity of population centres, especially mega cities like Kochi and Mumbai, only felt with significant anthropogenic effect (Madeswaran et al 2018) due to their rapid dilution beyond this distance. Thus the observed weak or no anthropogenic signal even at the nearshore stations (8–13 km away from the coast) along the EAS is consistent with no terrestrial nutrients influence beyond ∼15 km from the coast in the Bay of Bengal (Sarma et al 2020b).
Overall the isotopic data in conjunction with salinity during the study period (figure 3) suggests that the nutrient source of organic matter to the anoxic central zone is likely of marine origin. Higher δ15NPN in the central region (>9‰) compared to Kochi (7.1‰–7.8‰), despite salinity at the former region was higher than the latter, suggest the isotopically enriched source of nitrogen during the formation of organic matter as these values are higher than typical δ15N for phytoplankton in marine waters (Kumar et al 2004). The enriched source of nitrogen for these waters could be sewage (15.8 ± 1.6‰; Sarma et al 2019) or denitrified upwelling (9‰–12‰; Rixen et al 2014) or sediment pore water. However, no significant drop in salinity at these locations indicates the limited contribution of freshwater mediated waste supply. Therefore, it is highly likely that the source of nutrients for the formation of organic matter at these locations is marine-derived natural processes. Moreover, even during peak SM, when significant freshwater was received at Kochi nearshore (surface salinity ∼24), no significant increase in δ15NPN was observed implying rapid dilution of terrestrial inputs within few kilometres from the coast. Similar is the case with Mangalore where the low salinity front observed between stations 3 and 4 during peak SM shows δ15NPN of denitrified marine signals (figure 3).
To further confirm the possible influence of anthropogenic sources on coastal anoxia, paleoceanographic records are examined. Organic carbon isotopic composition and variability in iron content in the sediment core were taken as proxies for the source of carbon and redox conditions in the water column, respectively. The sediment cores from the shallow stations of the central west coast of India, dated to ∼350 years, were found to have a narrowly varied isotopic composition of organic carbon (−23‰ to −21‰) indicating its marine origin (Fernandes et al 2020). The authigenic iron contents in these cores also did not show significant variability between the recent and past centuries. Similarly, almost uniform Fe/Al (0.78 ± 0.04) and Mg/Al (0.32 ± 0.02) ratios in the sediment core in the last ∼700 years infer no considerable change in nature and source of detritus (Agnihotri et al 2008). Dinoflagellate cysts are good indicators of ecosystem eutrophication by anthropogenic factors (Price et al 2018), and their tracking history in the sediment core from the west coast of India also did not indicate any sign of terrigenous derived organic matter (D'Silva et al 2012). Unlike the coastal systems of the Gulf of Mexico, Gulf of St. Lawrence, etc where paleo records show a significant impact of anthropogenically derived eutrophication (Rabalais et al 2007, Gilbert et al 2010, Price et al 2018), the studies on coastal system of west India have not shown such effect. These findings along with our earlier observation of unchanged hypoxic conditions compared to five decades ago over the southwest coast of India corroborate the view that the coastal deoxygenation is supported by the oceanic processes (Gupta et al 2016).
All these observations collectively strengthen the possibility that the anoxic conditions along the central west coast are not primarily related to the anthropogenic effect.
4.2. Influence of circulation on the variation of OMZ and its expansion onto the coast
It is known that the upwelling waters of the EAS originate from the Arabian Sea OMZ (Banse 1959), however, it is unknown till now the depth and dissolved oxygen concentrations of source waters for the upwelling. Our results show that the extent of shelf deoxygenation follows the corresponding spatio-temporal changes in the distribution of dissolved oxygen concentrations in the offshore OMZ. To begin with, the upwelling of deoxygenated waters initiated in the south is progressed up to 15° N by early SM, and to the entire west coast by peak SM (figure 1). While doing so, the shelf exhibited significant deoxygenation gradients with anoxia confined to the central shelf between 11° and 18° N. The upper boundary of OMZ (20 µM oxygen), varied between ∼100 m in the south to ∼130 m in the north during early SM, shallows with the progression of the season to a peak to ∼70 m in the central region by late SM (figure 4), and accordingly forms the source for upwelling (figure 5). Further, the perennial OMZ has a southern boundary at ∼12° N (Naqvi 1991), its 0.2 ml l−1 (∼9 µM) dissolved oxygen isoline slopes northward up to 18° N (figure 1). These lead to a condition wherein the upwelling waters over the central shelf are sourced from the core OMZ which are suboxic (⩽10 µM) while those of the south and north are from hypoxic waters (∼20 µM) outside the core OMZ (figure 4). These core OMZ denitrified waters have enriched δ15NPN of 9‰–12‰ at 100–150 m (Rixen et al 2014), the upwelling of these waters contributed to higher δ15NPN over the central shelf (>9‰), consistent with the values reported earlier (Maya et al 2011), compared to the southern shelf (<8‰) (figure 3).
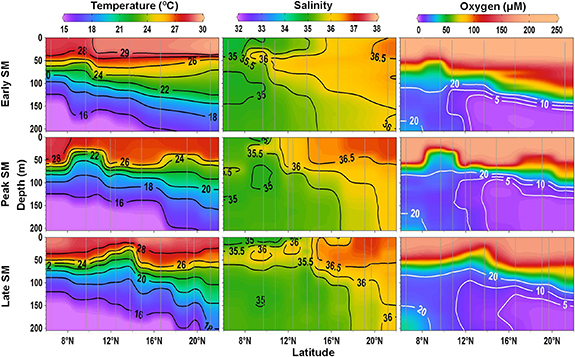
Figure 4. Latitudinal variation of upper ocean hydrography in the offshore region (2000 m) during all three phases of the SM. The shifting of the dome (vertical upliftment) from the south in early SM to the centre by late SM can be seen. Relatively aerated southern offshore waters restrict the upwelling of suboxic waters to the central shelf.
Download figure:
Standard image High-resolution image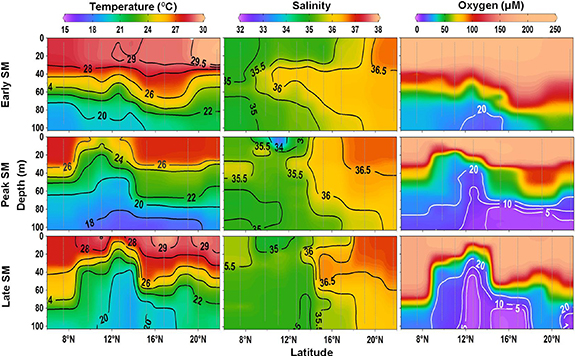
Figure 5. Latitudinal variation of hydrography at the shelf entrance (100 m) during all three phases of the SM. The upwelling of cool and suboxic waters are confined to the central region (11–18° N).
Download figure:
Standard image High-resolution imageThough the upwelling propagates from south to north, its onset in the south is evident at 100 m during January–February, peaks to the surface layers during the SM (June–August), and subsides abruptly thereafter (Gupta et al 2016). However, the present intra-seasonal data shows that while progressing to the north, the peak phase of upwelling over the southern and northern shelves end up at hypoxia while the upwelling over the central shelf is sustained till late SM but with suboxia/anoxia (figure 6). These changes in the coastal waters are also accompanied by similar changes in the offshore waters. The doming of the water column seen at 10° N during early SM shallows and strengthens in size up to 11° N by peak SM, and thereafter shifts to 14° N by late SM (figure 4). This shift, as shown by the weekly averaged satellite data on sea surface height anomalies, is governed by the formation of cold-core eddies in the south and central regions respectively during peak and late SM (figure 7). This leads to a shift in the upliftment of the water column/oxycline from outside core OMZ to within core OMZ during the progression of SM. Consequently, the core OMZ waters of the central region shoal from >100 m to ∼70 m between early and late SM, the corresponding change in oxygen regime in upwelling source waters from hypoxia to suboxia (figure 4) influences the intensification of deoxygenation over the central shelf (figures 5, 6 and 8). Such spatial and temporal shifting of cyclonic eddies, influencing the intensity and spatial spread of upwelling and, in turn, the patterns of distribution of dissolved oxygen over the shelf, as seen from the sea surface height anomalies from 2012 to 2017 (figures S1 and S2 (available online at stacks.iop.org/ERL/16/054009/mmedia)), is probably a recurrent feature.

Figure 6. Progressive changes in the inner shelf hydrography over the southern (Kochi) and central shelves (Mangalore and Goa) during early (upper panel), (b) peak (middle panel), and (c) late phases (lower panel) of SM upwelling. Cool waters persisted during the peak phase albeit the central shelf is relatively colder than the south. But by late SM, the southern shelf warmed due to cessation of upwelling when the central shelf still sustained with colder waters/upwelling. Despite peak upwelling, the south remained at hypoxia but suboxia/anoxia is maintained over the central shelf during both peak and late phases.
Download figure:
Standard image High-resolution image
Figure 7. Weekly variability of SSHA overlaid by geostrophic currents during August and September 2018 in the southeastern Arabian Sea. Red dots indicate the location of CTD casts. The black line indicates the isobath of 2000 m. The shift in a cyclonic eddy from the south (August) to the central (September) region resulted in a similar shift in vertical upliftment of subsurface waters, as can be seen from figure 3. Data source: https://las.aviso.altimetry.fr/las/UI.vm.
Download figure:
Standard image High-resolution image
Figure 8. Variation in coastal upwelling along the west coast of India during late SM. The presence of oxygenated Arabian Sea High Salinity Waters restricts the deoxygenated upwelled waters to subsurface depths in the northern shelf (Mumbai and Okha).
Download figure:
Standard image High-resolution image
The poleward west India under-currents at 50–150 m, gain strength between peak and late SM, carry relatively ventilated waters (Naqvi et al 2006) up to 11–12° N (figures 4 and S3). Their progression also restricts the upwelling of suboxic (<10 µM) core OMZ waters to the north of 11° N and governs the southern boundary of shelf anoxia (figures 1 and 5).
The equatorward advection of Arabian Sea High Salinity Watermass (ASHSW >36) with WICC also has a role in maintaining the oxygen gradients between the north and central regions. The oxygenated ASHSW is about 150 m thick in the north and caps the cold (20 °C) and hypoxic (∼20 µM) waters (figure 4). The upwelling of these relatively aerated waters over the shelf north of 19° N maintains its hypoxic conditions (figures 5 and 8). But between 18° and 12° N, the ASHSW is gradually eroded to <70 m, enabling an intense upwelling of suboxic waters on to the central shelf. However, the ASHSW still acts as a barrier for upward movement of anoxic layers along the central west coast. Though coastal anoxia is confined to 11–18° N, north of 15° N (for example, off Goa—figure 8) where the pycnocline is thicker, it is less-spread whereas the shallow pycnocline south of 15° N leads to large parts of the water column becoming anoxic, thereby the severity of anoxic volume is higher at Mangalore than at Goa.
4.3. Influence of shelf biogeochemistry and biology on deoxygenation
Though physical factors govern the spread of deoxygenated upwelling waters, shelf biogeochemistry and biology also play a crucial role in maintaining the observed gradients. In phase with the decreasing upwelling intensity towards the north, the phytoplankton biomass (column chlorophyll a) between the nearshore and mid-shelf regions during the SM months was higher in the south (77 ± 47 mg m−2) compared to the central (56 ± 26 mg m−2) and northern (56 ± 23 mg m−2) regions. But the corresponding bottom oxygen consumption rates (based on changes in apparent oxygen utilisation), following the decay of plankton, remained relatively higher in the central (1.91 ± 0.8 µM l−1 d−1) than in the southern (1.59 ± 0.6 µM l−1 d−1) and the northern (1.68 ± 0.4 µM l−1 d−1) regions. As the abundance of zooplankton and herbivorous fishes in the suboxic/anoxic (hypoxic) waters of the central (southern) shelf are expected to be lower (higher) (Stramma et al 2011, Gupta et al 2016, Roman et al 2019), the lower grazing loss of phytoplankton in the central shelf results in higher decomposition of sinking organic matter (figure S4) and intensifies oxygen depletion.
5. Conclusions
This study clearly shows that the development of seasonal anoxia over the central-western shelf of India is a natural phenomenon caused by the upwelling of core OMZ waters, to which upwelling driven biogeochemical processes add. The incidence and spread of this coastal anoxic zone may vary depending on the interannual variation in the intensity of SM, which in turn is influenced by climatic events. For example, the weak upwelling during El Niño-Southern Oscillation (ENSO) years has led to the incursion of relatively oxygenated waters and no or weak coastal anoxia was formed (figure S5). Even model studies have found prevention of anoxia formation during Indian Ocean Dipole (IOD) years over the west coast of India (Parvathi et al 2017), which also supports our argument of it being driven naturally. The observed weak cyclonic eddies during the IOD (2012) and ENSO (2014–2015) years relative to normal years (figures S1 and S2) also support this. Similarly, the ENSO years of weak winter cooling (Chakraborty et al 2017) can alternately weaken the strength of ASHSW and influence the upwelling intensity. The fact that equatorward spread of ASHSW through WICC interacting with upwelling influences the spatio-temporal variation of oxycline depth is a significant finding as larger the anoxic volume greater the reduction in habitat for higher pelagic organisms, which in turn, alters the trophic food web dynamics (Diaz and Rosenberg 2008, Stramma et al 2011). This is especially true during late SM when fresh water laden salinity stratification (oxic zone) is sharply retreating and upwelling driven anoxic volume is proportionately increasing it leads to a scenario of pelagic fishes gets trapped into the rapidly shrinking habitable oxic volume towards the coast and washed ashore over the central coast (at Goa beach, see figure 2.3.12 of Naqvi 2019). Similar fish mortality were also happening in the regions of sharp hypoxic-anoxic boarders such as one that happened at ∼11–12° N during late SM 2019 (figure S6). Nevertheless, the present study, pointing out the natural origin of the world's largest coastal anoxia over the central west coast of India as an example, may infer that not all the coastal anoxic systems around the world are anthropogenically dead zones.
Acknowledgments
The authors thank the Secretary, Ministry of Earth Sciences (MoES), and Directors of Centre for Marine Living Resources & Ecology, National Centre for Coastal Research, Chennai and National Institute of Oceanography (NIO), Goa for supporting this work. Thanks also to all the participants of the oceanographic cruises and estuarine field surveys for their help in collecting the data. The support extended by Vessel Management Cells of Sagar Kanya and Sagar Sampada as well as the Masters, crew and fishing hands is highly acknowledged. The suggestions and comments from Dr M Wafar and Dr V V S S Sarma, Scientists, NIO have greatly improved the presentation of the manuscript. The comments and appreciations of anonymous Reviewers are greatly acknowledged. This study is part of the in-house project Marine Ecosystem Dynamics of the eastern Arabian Sea (MEDAS) funded by MoES. This is CMLRE and NIO contribution numbers 134 and 6692, respectively.
Data availability statement
All data is available in the main text and the supplementary materials. The data presented here are archived in the Ministry of Earth Sciences central repository at www.incois.gov.in.
All data that support the findings of this study are included within the article (and supplementary files).
Author contribution statement
GVMG conceptualised the research and investigated the work. Ch VR, AYR, VS, NVHKC, KFB, PHM, BR and AKV have collected and analysed the data. GVMG, DJ, KKB and SK have analysed the data. GVMG developed the manuscript with significant contributions from all coauthors.