

Abstract
While large companies routinely announce greenhouse gas emissions targets, few have derived targets based on global climate goals. This changed in 2015 with the creation of the science based targets (SBTs) initiative, which provides guidelines for setting emission targets in line with the temperature goal of the Paris Agreement. SBTs have now been set by more than 500 companies. Methods for setting such targets are not presented in a comparable way in target-setting guidelines and concerns that certain methods may lead to overshoot of the temperature goal have not been investigated. Here, we systematically characterize and compare all seven broadly applicable target-setting methods and quantify the balance between collective corporate SBTs and global allowable emissions for individual methods and different method mixes. We use a simplified global production scenario composed of eight archetypical companies to evaluate target-setting methods across a range of company characteristics and global emission scenarios. The methods vary greatly with respect to emission allocation principles, required company variables and embedded global emission scenarios. Some methods treat companies largely the same, while others differentiate between company types based on geography, economic sector, projected growth rate or baseline emission intensity. The application of individual target-setting methods as well as different mixes of methods tend to result in an imbalance between time-integrated aggregated SBTs and global allowable emissions. The sign and size of this imbalance is in some cases sensitive to the shape of the global emission pathway and the distribution of variables between the company archetypes. We recommend that the SBT initiative (a) use our SBT method characterisation to present methods in a systematic way, (b) consider our emission imbalance analysis in its method recommendations, (c) disclose underlying reasons for its method recommendations, and (d) require transparency from companies on the calculation of established SBTs.
Export citation and abstract BibTeX RIS

Original content from this work may be used under the terms of the Creative Commons Attribution 4.0 license. Any further distribution of this work must maintain attribution to the author(s) and the title of the work, journal citation and DOI.
Corrections were made to this article on 25 June 2021. The spacing in table 2 was amended.
1. Introduction
It has long been common practice for large companies to report environmental performance and future performance targets (Mathews 1997). Since the early 2000s, the Global Reporting Initiative has encouraged companies to disclose environmental performance in the context of environmental carrying capacities (GRI 2002, UNEP 2015). This concept can be broadly understood as the maximum impact the environment can sustain without undergoing changes perceived to be unacceptable (Sayre 2008, Bjørn et al 2020). Several scholars have long argued that disclosure in the context of carrying capacity is essential for understanding whether companies' environmental performance and targets are compatible with a sustainable development (Dyllick and Hockerts 2002, Gray and Milne 2002, Veleva et al 2003, Ehrenfeld 2005, Milne and Gray 2013). However, the practice of setting corporate greenhouse gas (GHG) emission targets has, until recently, remained largely disconnected from the global challenge of avoiding dangerous levels of climate change (Bjørn et al 2017, Haffar and Searcy 2018, Dahlmann et al 2019, Walenta 2020). Instead, companies have set targets based on other concerns, such as national climate policy, competitors' targets and potential for low-cost emission reduction (Margolick and Russell 2001, Rietbergen et al 2015). However, the 2015 Paris Agreement (UNFCCC 2015) and near simultaneous creation of the Science Based Targets initiative (SBTi) appear to have provoked a steadily unfolding paradigm shift. During less than 5 years (2015–2019) more than ten times as many companies set a target based on a global climate goal (SBTi 2019b) than in the preceding 15 years (2000–2014) (Bjørn et al 2017). As of 18 December 2020, such a science-based target (SBT) has been set by 546 companies, including many large multinationals (SBTi 2020a). SBTs offer trajectories towards more long-term and also increasingly popular corporate 'net-zero' targets (NCI&DDEL 2020).
With increasing popularity of SBTs comes a need for critical appraisal of target-setting methods and their use by companies. For a target to be approved by the SBTi, it should be 'in line with what the latest climate science says is necessary to meet the goals of the Paris Agreement—to limit global warming to well-below 2 °C above pre-industrial levels and pursue efforts to limit warming to 1.5 °C' (SBTi 2020c). The initiative has since its foundation referred to seven broadly applicable target-setting methods for scope 1 and 2 emissions 4 , according to our count (see overview in table 1). The context-based carbon metric of the Center for Sustainable Organizations (CSO) (Ben & Jerry's 2006, McElroy 2008, 2018) was the first method to be formally described and made available in a spreadsheet tool (CSO 2020). This was followed by the British Telecom-Carbon Stabilization Intensity (BT-CSI) (Tuppen 2008) and Corporate Finance Approach to Climate-stabilizing Targets (C-FACT) (Autodesk 2009, Stewart and Deodhar 2009) methods, both of which were developed within specific companies for internal target setting and later presented publically. One of the developers of the BT-CSI method then went on to create the related greenhouse gas emissions per unit of value added 5 (GEVA) method (Randers 2012). Next, the World Wildlife Fund (WWF) and CDP (formerly the Carbon Disclosure Project) developed The 3% Solution (WWF/CDP 2013) focusing on the United States and the first method to differentiate between sectors. Together with other actors in what was to become the SBTi, WWF and CDP then developed the more broadly applicable sectoral decarbonization approach (SDA) (Krabbe et al 2015, SBTi 2015), later made available in the SBTi spreadsheet tool (SBTi 2019c). Lastly, the simple absolute contraction approach (ACA), formalized by Faria and Labutong (2019), has long been observed in practice 6 and is available in the SBTi spreadsheet tool (SBTi 2019c). Four of the seven methods have been made available in multiple versions since originally presented (see table 1).
Table 1. Overview of the seven broadly applicable SBT methods for scope 1 and 2 emissions, ordered after the year of the first version.
| Full name | Acronym | Available in a tool? | Year of first version | Year of latest version |
|---|---|---|---|---|
| Center for Sustainable Organizations' context-based carbon metric | CSO | Yes | 2006 | 2020 |
| Absolute contraction approach | ACA | Yes | 2007 | 2019 |
| British Telecom-Carbon Stabilization Intensity | BT-CSI | No | 2008 | — |
| Corporate Finance Approach to Climate-stabilizing Targets | C-FACT | Yes (no longer online) | 2009 | — |
| Greenhouse gas emissions per unit of value added | GEVA | No | 2012 | 2018 |
| The 3% Solution | — | Yes (no longer online) | 2013 | — |
| Sectoral decarbonization approach | SDA | Yes | 2015 | 2020 |
Some of the seven SBT methods lack explicit documentation of target equations and parameters, as also observed by Faria and Labutong (2019). Likewise, the ethical foundation for allocating global allowable emissions to individual entities is rarely clearly stated in the method documentation. Furthermore, current SBTi resources (i.e. website and guidance documents) do not present methods in a comparable way. This makes it challenging for companies or consultants to make informed method choices and for stakeholders to understand the value judgement embedded in the resulting SBTs. It is also not entirely clear why the SBTi generally recommends ACA and SDA over the other five SBT methods (SBTi 2020c), but suspected emission imbalances appear to play a role. For example, the SBTi explicitly dissuades the use of the GEVA method with reference to a mathematical approximation in the target equation that risks leading to an overshoot of global allowable emissions and, hence, the temperature goal of the Paris Agreement (SBTi 2019a, 2020c). This concern has been echoed in other studies (Krabbe et al 2015, Walenta 2020). In addition, Li et al (2019) pointed out that an emission imbalance between SBTs and global allowable emissions may occur if companies use a mix of methods. No comprehensive analysis has yet addressed these emission imbalance concerns for all individual SBT methods and method mixes.
This study aims to systematically identify the characteristics of each SBT method, clarify the differences between methods and explore issues related to emission imbalance from a theoretical perspective. First, we develop and apply a framework to characterize and compare the seven SBT methods. Second, we apply the SBT methods to a simplified scenario of global production, composed of eight archetypical companies. This allows us to compare SBTs across company types and methods and to quantify the balance between aggregated company SBTs and global allowable emissions under different conditions. We then provide recommendations to the SBTi.
2. Methods
2.1. Characterizing methods
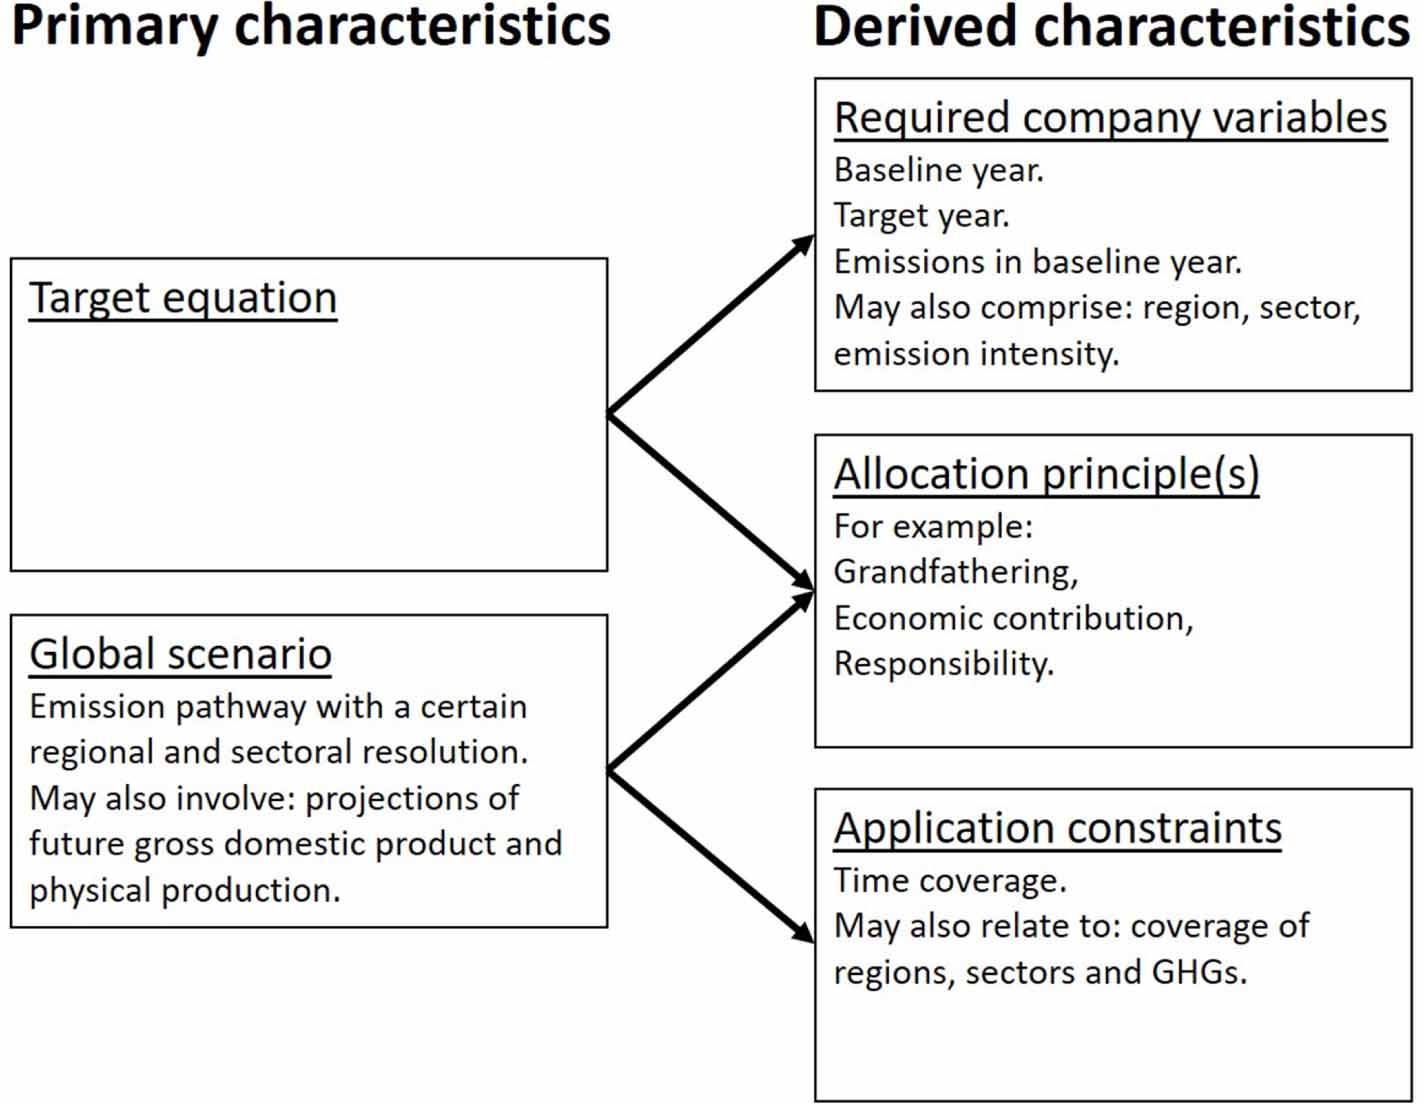
Figure 1 presents our framework for characterizing and comparing SBT methods. Adapted from Faria and Labutong (2019), we distinguish between primary and derived method characteristics and cover application constraints explicitly. The primary characteristics of any SBT method are comprised by a target equation and a global scenario, related to future allowable emissions and, possibly, future economic activity. Derived characteristics, i.e. required company variables, one or more allocation principles and application constraints, are derived from those primary characteristics (black arrows in figure 1).
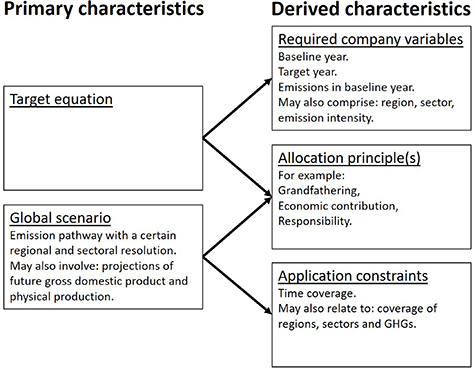
Figure 1. Framework for characterizing and comparing SBT methods. The arrows link derived characteristics to their primary characteristics. Adapted from Faria and Labutong (2019).
Download figure:
Standard image High-resolution imageWe reviewed all available method documentation (see section 1 for references) to identify the five characteristics of each method and version. For three of the methods, target equations were only indirectly documented through spreadsheet tools (CSO and C-FACT) or by presenting a common required annual decrease in emission intensity (GEVA). We derived these target equations explicitly by a combination of Faria and Labutong's (2019) method review and reverse engineering of target calculation tools and contacted the developers for verifying the equations. For each method, we then derived required company variables directly from the target equation. Next, we identified the global scenario, to the extent possible by the sometimes incomplete method documentation, and adopted SBTi's temperature goal classification of the involved emission pathway, where available (SBTi 2019a). We then derived application constraints by identifying aspects not covered by the global scenario, such as certain years, regions, sectors and GHGs. Finally, we derived allocation principle(s) from each method's target equation and global scenario in accordance with the broader literature on allocating carrying capacity to anthropogenic entities, e.g. van den Berg et al (2020) and Bjørn et al (2020).
2.2. Applying methods to simplified scenario of global production
2.2.1. Calculating SBTs for archetypical companies
We constructed a simplified scenario of global production, composed of two unspecified regions, two unspecified sectors and eight archetypical companies. We defined the eight companies by assigning them all combinations of two arbitrarily chosen values for three variables: (a) region and sector; (b) baseline emission intensity; and (c) projected annual activity growth, as illustrated in the left panel of figure 2. All companies have the same baseline year activity measured in value added.
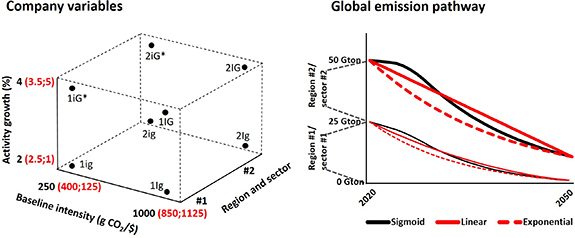
Figure 2. Illustration of the company variables and global emissions pathway within the simplified scenario of global production. The left panel shows the variable values for the eight company archetypes with company names coded according to region and sector (#1 or #2) and whether the variable values are 'low' (lowercase letter) or 'high' (uppercase letter) for baseline emission intensity (i/I) and projected annual activity growth (g/G). The red company variable values are used in the sensitivity analysis. The right panel shows the sigmoid-shaped global emission pathway, split according to region #1/sector #1 and region #2/sector #2 and with the red emission pathways (linear and exponential) used in the sensitivity analysis. *Companies 1iG* and 2iG* have dynamic annual activity growth (starting with 4%, in the original scenario), which serves to ensure that the sum of projected company value added is equal to the projected sectoral and regional GDP in all years.
Download figure:
Standard image High-resolution imageWe developed a common global scenario, assuming a sigmoid-shaped emission pathway leading to a 78% net 7 reduction of 2020 emissions in 2050 (illustrated in right panel of figure 2). The global emission scenario corresponds to cumulative emissions in the 2020–2050 period of 921 Gton CO2-eq and is broadly consistent with a typical '1.5 °C high overshoot' or 'lower 2 °C' scenario (Rogelj et al 2018, p 117). Within the scenario, we assumed that region #1 and sector #1 will reduce emissions at a steeper pace than region #2 and sector #2, so that 90% of emissions in 2050 will take place in region #2 and sector #2, versus 50% in 2020. Our emission scenario includes emissions of all GHGs from all activities with an economic output (such as industry and agriculture) and excludes direct emissions from final consumption by households and governments. These excluded emissions are largely related to combustion of fuels by individuals and account for roughly 12% of the current global total 8 . Hence, when referring to 'global allowable emissions', we imply that an unspecified pre-allocation to final consumption activities already has taken place. In both regions and sectors and at the global level, we assumed a 3% annual increase in real gross domestic product (GDP) during the 2020–2050 period. The parameter values in our scenarios' baseline year (2020) for emissions (50 Gton CO2-eq) and GDP (8 × 10⁷ million US$) were inspired by UNEP (2020) and the World Bank (2020). The projected annual increase in real GDP (3%) is generally consistent with the scenarios of the International Energy Agency (2017).
We calculated SBTs specified as percentage reductions in baseline (2020) absolute emissions for each company's scope 1 activities for the period 2020–2050 using each method, except for The 3% Solution due to its restrictive focus on the United States and 2020 target year. In our application of the SDA method, we assumed the companies' projected growth in physical production to be proportional to their projected growth in real value added. Since that method assumes the power sector will reduce absolute emissions at a much steeper rate than other sectors (Krabbe et al 2015), we considered sector #1 and #2 rough approximations of the power sector and a mix of other sectors, respectively. In our application of the BT-CSI and C-FACT methods, we considered region #1 and #2 rough approximations of developed and developing countries, respectively, since these methods assume steeper emission reductions in developed countries (Tuppen 2008, Stewart and Deodhar 2009).
To evaluate the robustness of our results, we developed eight sensitivity analysis scenarios involving combinations of smaller and larger differences between the variable values of the archetypical companies (left panel of figure 2, in red) and the use of linear and exponential global emission pathways (right panel of figure 2, in red). In all cases, the combined company variables are consistent with the global scenario. For example, the sum of company value added is equal to GDP in all years. The linear and exponential global emission pathways also lead to a 78% emission reduction in 2050, but involve slightly different cumulative emissions than the sigmoid shape (943 and 799 vs. 921 Gton CO2-eq).
2.2.2. Calculating emission imbalance
For each set of method-specific SBTs, we calculated the yearly (y) emission imbalance (EI):
GE is global allowable emissions prescribed by the common global emission scenario, c1 to c8 refer to the eight companies, and SBT refers to the calculated emission target. A positive emission imbalance means there are 'leftover' (or unused) global allowable emissions after allocation of emissions to companies for a given year. A negative emission imbalance means that global allowable emissions are exceeded by the sum of company SBTs for a given year. Further, for each SBT method we calculated a cumulative emission imbalance ratio (CEIR) for the 2020–2050 period:
The ratio shows the importance and sign of the cumulative emission imbalance relative to global allowable emissions for the time-integrated period.
Next, we performed the emission imbalance calculations (equations (1) and (2)) for three hypothetical mixes of methods: (a) selection of the method giving the highest cumulative SBT ('least challenging') for each company; (b) selection of the method giving the lowest cumulative SBT ('most challenging') for each company; and (c) random assignment of methods for each company with ten iterations. All calculations are documented in the supplementary spreadsheet (available online at stacks.iop.org/ERL/16/054019/mmedia).
3. Results
3.1. Method characterization and SBTs for the eight archetypical companies
As summarized in table 2, the seven SBT methods are characterized by a range of allocation principles and required company variables; they are based on different global scenarios and corresponding temperature goal classifications. The methods are generally universally applicable for target years up to 2050, but some methods cannot be applied to certain sectors and regions. The ACA, GEVA, CSO and SDA methods are available in several versions involving different global scenarios and corresponding temperature goal classifications 9 (each method retains the same target equation in all versions). Below, we provide an individual analysis of the methods, roughly ordered from simplest to most complex, according to the target equations (see SM 1 (available online at stacks.iop.org/ERL/16/054019/mmedia)). We also review the calculated SBTs for the scope 1 emissions of the eight archetypical companies (left axes of figures 3(a)–(f)). The calculated targets were based on our common global scenario, which is different from the method-specific scenarios identified in table 2. Hence, differences in target equations are the only reason that the SBTs for each of the eight companies differ across the six SBT methods. SM 2 presents the calculated SBTs for the sensitivity analysis, which involves different company variables and shapes of the global emission pathway.

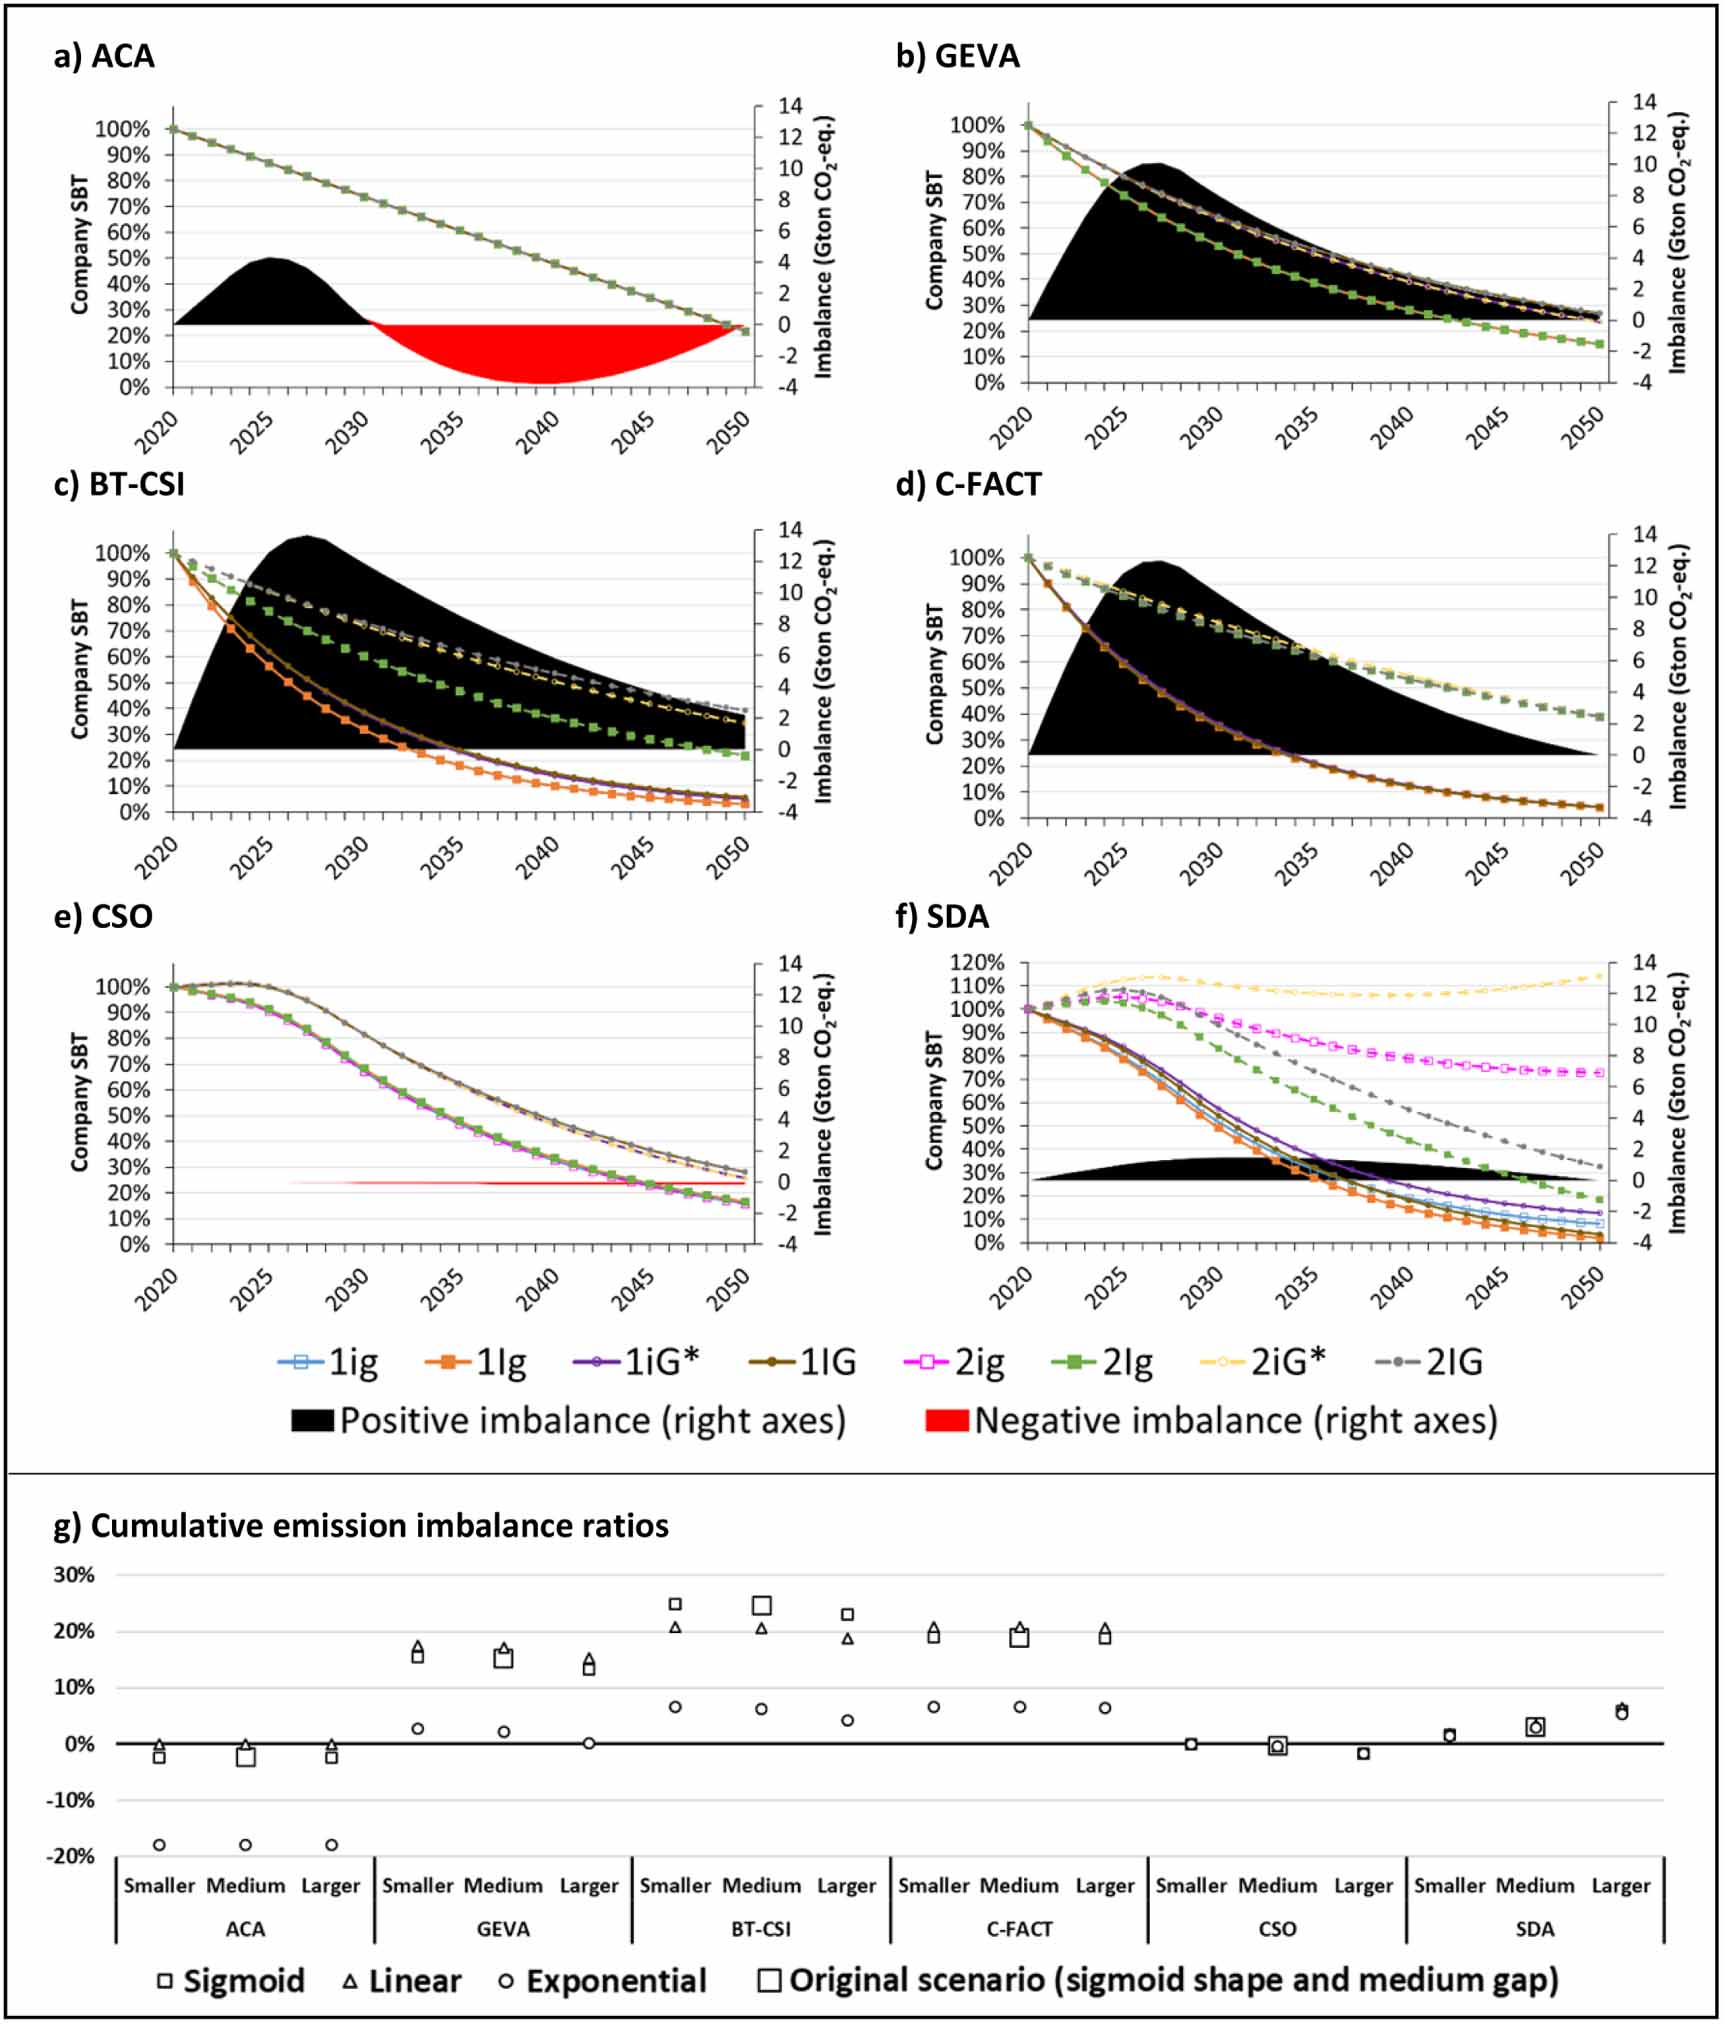
Figure 3. Application of six SBT methods to the eight archetypical companies and corresponding emission imbalance. Figures (a)–(f) show the resulting company emissions pathways and global emission imbalance. The SBTs are presented using the left axes, indexed to 2020, and the emission imbalances using the right axes. Similar charts for the eight sensitivity analysis scenarios are provided in SM 2. Figure (g) presents the cumulative emission imbalance ratios for each method for the original scenario and the eight sensitivity scenarios, according to shape of global emission pathway (sigmoid, linear or exponential) and gap between company variable values (smaller, medium or larger). The methods vary with respect to the shapes of SBT pathways, the extent to which the SBT pathways diverge and the size and sign of emission imbalances. The cumulative emission imbalance ratios vary in sign and are sensitive to distance between company variable values and shape of global emission pathways for most methods (see SM 2 for details).
Download figure:
Standard image High-resolution imageTable 2. Summary of the characteristics of the seven SBT methods in all versions made available since 2015. Method versions are numbered chronologically according to their respective global scenarios. Target equations are presented in SM 1. IPCC = Intergovernmental Panel on Climate Change. OECD = Organisation for Economic Co-operation and Development. RCP = Representative Concentration Pathway.
| Method | Allocation principle a | Company variables required in addition to baseline year, target year and baseline year emissions | Global scenario, involving emission pathways, temperature goal classification (bold) and, potentially, GDP projections | Application constraints |
|---|---|---|---|---|
| ACA (3 versions) | Grandfathering | None | 1) Subcategory of RCP2.6 scenario family in the Fifth Assessment Report of IPCC (Pachauri et al 2014) that keeps overshoot to under 0.4W/m2 (SBTi 2019b); 2°C.2) An emission scenario envelope derived from Huppmann et al (2018) (SBTi 2019a); Well-below 2°C.3) An emission scenario envelope derived from Huppmann et al (2018) (SBTi 2019a); 1.5°C. | — |
| GEVA (2 versions) | Grandfathering Economic contribution | Baseline year emissions per value added, projected value added in target year, country development status. | 1) Unspecific reference to IPCC: "...cut GHG emissions by 50% by 2050..." (Randers 2012); 2°C; Assumes world annual GDP growth rate of 3.5% (constant prices).2) Not fully disclosed b : "...based on an absolute emissions reduction of about 75% by 2050 from 2010 levels...broadly compatible with high-confidence IPCC (RCP2.6) pathways, and its ambition is intermediate between the IEA 2DS and B2DS pathways..."; Between 2°C and Well-below 2°C (SBTi 2019c). | — |
| BT — CSI | Grandfathering Economic contribution Responsibility | Baseline year emissions per value added, projected value added in target year, country development status. | Not clear: "...developed countries are expected to aim for an emissions peak between 2012 and 2015, with 30% cuts by 2020 and at least 80% cuts by 2050. Developing countries meanwhile will essentially maintain a trajectory of rising emissions to 2020, peaking at around 80% above current levels, with cuts of 20% against 1990 levels by 2050." (Tuppen 2008); 2°C; Assumes global GDP growth rate of 5.9% per year (current prices). | — |
| C-FACT | Grandfathering Economic contribution Responsibility | Baseline year emissions per value added, projected value added in target year, country development status. | Unspecific reference to IPCC: "...85 percent absolute reduction from current levels for industrialized countries and 50 percent for developing countries" (Stewart and Deodhar 2009); 2°C. | — |
| CSO (3 versions) | Grandfathering Economic contribution Responsibility c | Baseline year emissions per value added, projected value added until target year, country development status c | 1) Fifth Assessment Report of IPCC, RCP 2.6, OECD-specific; 2°C; Assumes GDP growth rate of 2.5% per year in OECD (current prices) as a default (otherwise user-defined in tool).2) SSP1-2.6 from Coupled Model Intercomparison Project (CMIP6); 1.761°C. d ; Assumes short-term decrease in global GDP due to COVID-19, followed by a growth rate of 3.9% pear year (current prices) as a default (otherwise user-defined in tool).3) SSP1-1.9 from Coupled Model Intercomparison Project (CMIP6); 1.345°C. d ; Assumes short-term decrease in global GDP due to COVID-19, followed by a growth rate of 3.9% pear year (current prices) as a default (otherwise user-defined in tool). | — |
| 3% solution | Grandfathering Responsibility Cost-optimization Physical production | Sector classification, market share in baseline year, projected market share in target year. | Unspecific reference to IPCC's Fourth Assessment Report, Working Group III (Netz et al 2007): "Annex I (developed) countries need to reduce GHG emissions by 25–40% below 1990 levels by 2020, and 80–95% below 1990 levels by 2050." (WWF/CDP 2013); 2°C; Future sectoral activity and emissions according to business as usual and cost-saving scenario follows Annual Energy Outlook 2012 from the US Energy Information Administration (EIA 2012) and unpublished assessment by McKinsey and Company, respectively. | Utilities excluded; only United States; only 2020 target year. |
| SDA (2 versions) | Grandfathering Cost-optimization Physical production e Convergence e | Sector classification. In addition for homogenous companies: Baseline year emissions per unit physical activity, physical activity in baseline year, projected physical activity until target year. | 1) 2DS scenario of the International Energy Agency (IEA 2014); 2°C; Future sectoral activity and emissions according to 2DS scenario of the International Energy Agency (ETP 2014). 2) B2DS of the International Energy Agency (IEA 2017); Well-below 2°C; Future sectoral activity and emissions according to B2DS of the International Energy Agency (ETP 2014). | Coal mining, oil and gas refining, agriculture excluded. Only covers CO2. |
a Responsibility is here considered equivalent to Right to development and Capabilities, as we could not distinguish between the three principles based on the method documentation. b The most recent version of the GEVA method has been fully documented by the SBTi (Chang 2018), but the document has not been publically released and so its information is not disclosed here. c Only the first version of the CSO method relies on the Responsibility principle and, consequently, only that version requires country development status. d The SBTi has not classified these version of the CSO method to a temperature goal. The levels of warming stated here (1.761°C and 1.345°C by 2100) are given by the method documentation (CSO 2020). e The SDA method only relies on the Physical production and Convergence sharing principles in its application to "homogenous" sectors.
3.1.1. ACA
The ACA method is the simplest, requiring that each company reduces its emissions at the same annual reduction rate required globally to meet an established temperature goal. This reflects the Grandfathering allocation principle, i.e. past emissions being 'grandfathered' into future emission allowances (Knight 2014). The ACA method exists in three versions, reflecting different emission pathways presented by the Intergovernmental Panel on Climate Change (IPCC) and related to different temperature goal classifications ('2 °C', 'Well-below 2 °C' and '1.5 °C'). Application of the ACA method (figure 3(a)) results in a linear emission pathway from baseline year to target year, identical for all eight archetypical companies.
3.1.2. GEVA
In addition to Grandfathering, the GEVA method relies on the Economic contribution principle, which holds that a company's absolute decrease in emission should be smaller the more it is expected to increase its value added. The method exists in two versions that apply different emission pathways. Application of the GEVA method (figure 3(b)) results in exponential emission pathways from baseline year to target year. The effect of the Economic contribution principle can be observed by the two clusters of graphs that separate the four companies with low (2% per year) and high (4% per year) projected growth rates.
3.1.3. BT-CSI
The BT-CSI method is similar to the GEVA method, but uses separate emission pathways for developed and developing countries. Accordingly, companies in developed countries are expected to reduce emissions more than those in developing countries. This appears consistent with the Responsibility, Right to development or Capability principles (EEA/FOEN 2020, van den Berg et al 2020). Application of the BT-CSI method (figure 3(c)) yields exponential SBT pathways, differentiated according to projected growth rates, as with the GEVA method (figure 3(b)), and according to whether companies are located in developed countries (region #1) or developing countries (region #2), which is a stronger differentiator for this method.
3.1.4. C-FACT
The C-FACT method relies on the same sharing principles as the BT-CSI method and exists in a single version, applying an IPCC scenario consistent with the '2 °C' target classification. However, C-FACT assumes that all companies in a region will reduce absolute emissions by the same degree between the baseline year and a fixed future year (2050 per default). Hence, application of C-FACT (figure 3(d)) leads to exponential SBT pathways that are mainly differentiated based on whether companies are located in developed countries (region #1) or developing countries (region #2).
3.1.5. CSO's context-based carbon metric
The CSO method relies on the same sharing principles as BT-CSI and C-FACT, but considers every year of a global emission scenario, instead of just the baseline and target years. The three versions of CSO apply different global emission pathways from IPCC, including one that corresponds to below 1.5 °C warming. In the more recent method versions, the emission pathways do not explicitly differentiate between developed and developing countries (as this is not done in the underlying data source, see table 2). Like GEVA and BT-CSI, application of CSO (figure 3(e)) leads to a differentiation of companies with low and high growth projections. The SBT pathways are sigmoid shaped, reflecting the common global emission pathway applied (figure 2, right panel). The CSO tool (CSO 2020) allows for adjustment of SBTs if the company does not follow its original SBT pathway, so that the originally calculated cumulative SBT remains fixed. Note that we did not differentiate between regions in our application of the CSO method, to be consistent with its most recent version.
3.1.6. The 3% Solution
The 3% Solution differentiates between the industrial sectors of companies as per the Cost optimization principle (van den Berg et al 2020). This principle holds that the emission reduction burden should be distributed in such a way between sectors that the total cost is minimized. This criterion is reflected in the methods' sector-specific emission pathways (detailed in table 2). These emission pathways are specific to the United States and consistent with the Responsibility principle (or Right to development or Capability, see above). The 3% Solution also relies on the Grandfathering principle and the Physical production principle. The latter is similar to Economic contribution in considering expected activity growth, but it uses sector-specific physical indicators of production instead of value added as activity measure (Bjørn et al 2020). The methods' single version is restricted to the target year 2020 and, hence, no longer operational.
3.1.7. SDA
The SDA method builds on The 3% Solution, but is applicable to companies in any country and does not rely on the Responsibility principle (or Right to development or Capability, see above). Instead, SDA relies on the Convergence principle (Meyer 2000) 10 , as it assumes that all companies in a sector will converge towards a common emission intensity in 2050. SDA is also the only method to calculate targets for scope 1 and scope 2 emissions differently. The approach to calculating scope 2 emission targets reflects both the projected decrease in emission intensity of power production and the projected changes in the sectoral power need per unit of activity. For companies that are 'heterogeneous' (not producing a homogenous output), the SDA method simplifies to pure emission grandfathering of absolute sectoral emissions. The two versions of SDA reflect different sectoral emission pathways, both developed by the International Energy Agency, and are consistent with the '2 °C' and 'Well-below 2 °C' target classification, respectively. Like CSO, the SDA method considers every year of these emission pathways. Application of SDA (figure 3(f)) leads to sigmoid-shaped SBT pathways that diverge to a much greater extent than for the other methods. This is due to the sectoral differentiation and differences in baseline emissions intensities and projected growth rates. Hence, the 2050 SBT for company 1Ig (power sector, high baseline emission intensity and low growth—see figure 2, left part) is a 98% reduction in baseline emissions, versus the 2050 SBT for company 2iG* ('other sectors', low baseline year emissions intensity and high growth) of 14% increase in baseline emissions. Note that despite the SDA method's separate target calculations for scope 1 and 2 emissions and for 'homogenous' and 'heterogeneous' sectors, our calculated SBTs (figure 3(f)) are only for the scope 1 emissions of 'homogenous' companies.
3.2. Emission imbalance analysis
3.2.1. Individual SBT methods
None of the six SBT methods have a perfect balance between the sum of SBTs and global allowable emissions when applied to our simplified global production scenario (figures 3(a)–(f)). GEVA, BT-CSI, C-FACT and SDA have positive imbalances throughout the 2020–2050 period, meaning there are 'leftover' global allowable emissions after allocation of emissions to the eight companies (equation (1)). CSO has a small negative imbalance and ACA has a positive imbalance up until 2030 and a larger negative imbalance in the remaining part. Considering the entire 2020–2050 period, the cumulative emission imbalance ratios (CEIR in equation (2) vary from −2.4% (ACA) to 24.7% (BT-CSI) (figure 3(g)). As briefly explained in table 3, the emission imbalances are all caused by assumptions and approximations within the methods' target equations (further details in SM 1). The two most common sources of imbalance are implicitly assuming that the global emission pathway has a specific shape (linear for ACA and exponential for GEVA, BT-CSI and C-FACT) and approximating the rate by which each company must reduce their emission intensity with the globally required rate (GEVA and BT-CSI).
Table 3. Sources of emission imbalance. More details are given in SM 1.
| SBT method | Sources of emission imbalance |
|---|---|
| ACA | Implicitly assumes a linear global emission pathway. |
| GEVA | Implicitly assumes an exponential global emission pathway; approximates the rate by which each company must reduce the emission intensity with the globally required rate. |
| BT-CSI | Implicitly assumes an exponential global emission pathway; approximates the rate by which each company must reduce the emission intensity with the globally required rate; assumes that the year that regional emissions peak is used as company baseline year. |
| C-FACT | Implicitly assumes an exponential global emission pathway; SBT pathways do not exactly add up to an exponential pathway when companies' value added does not increase (or decrease) at a constant compound rate. |
| CSO | The calculation of the required percentage decrease in companies' emission intensities between baseline and target year is approximate. |
| SDA | Involves an artificial capping of a variable that accounts for the projected change of companies' market shares. Without the variable capping, the emission imbalance would be zero under all conditions tested here (see the supplementary spreadsheet). |
The emission imbalance ratios show substantial sensitivity to the shape of the global emission pathway for the four methods that implicitly assume a specific shape, with the ratios being closest to zero for ACA using the linear pathway and for GEVA, BT-CSI and C-FACT using the exponential pathway (figure 3(g)) 11 . For these four methods, the linear pathway is generally 12 associated with highest positive imbalance, followed by the sigmoid and exponential pathways. This is due to differences between their cumulative global emissions (943, 921 and 799 Gton CO2-eq, respectively). The emission imbalance ratios also show varying degrees of sensitive to the gap between company variables (indicated by 'smaller', 'medium' and 'larger' in figure 3(g)) for all methods, except ACA (not requiring any company variables). A larger gap generally 13 leads to a lower positive emission imbalance. The CSO method, followed by the SDA method, has the overall lowest emission imbalance across all scenarios (figure 3(g)).
3.2.2. Mixes of SBT method
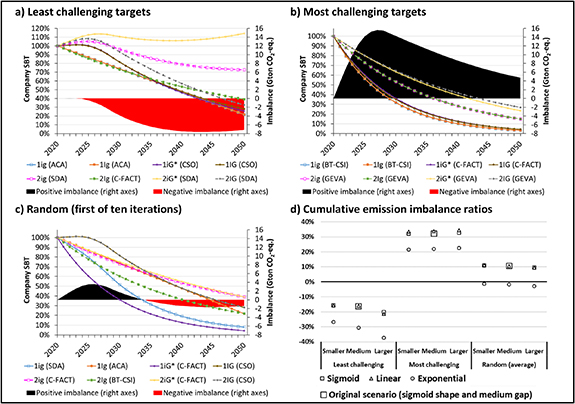
The SBT method that leads to the least challenging target differs across the eight archetypical companies (see legend in figure 4(a)). If each company was to choose the least challenging SBT, the resulting emissions reductions would fall substantially short of global allowable emissions between 2025 and 2050 (figure 4(a)), yielding a cumulative emission imbalance ratio of −16.3% (figure 4(d)). BT-CSI, C-FACT and GEVA are associated with the most challenging targets across the eight companies (see legend in figure 4(b)). Selection of these challenging targets would lead to a 'leftover' of global allowable emissions, yielding a cumulative emission imbalance ratio of 32.2% (figure 4(d)). In the first iteration, the random application of methods lead to a positive imbalance up until 2033, followed by a slightly smaller negative imbalance in the remaining period (figure 4(c)). The ten iterations of random method applications spanned a cumulative emission imbalance ratio of −1.7% to 25.0%, averaging 10.6% (figure 4(d)). The frequent positive emission imbalance associated with random method applications reflects that most methods have a positive emission imbalance (see figure 3).
Figure 4. Application of three mixes of SBT methods to the eight archetypical companies and corresponding emission imbalance. figures (a)–(c) shows the resulting company emissions pathways (left axes) and global emission imbalance (right axes). The method applied to each company is given in parentheses in the legends for the three method mixes. Figure (d) presents the cumulative emission imbalance ratios for each method for the original scenario and the eight sensitivity scenarios, according to shape of global emission pathway (sigmoid, linear or exponential) and gap between company variable values (smaller, medium or larger). The method mix resulting in the 'least challenging' targets have a substantial negative cumulative emission imbalance ratio, while the opposite is observed for the method mix resulting in the 'most challenging' targets. A random mix of methods has a moderate positive imbalance ratio for scenarios involving sigmoid and linear emission pathways and a minor negative imbalance ratio for scenarios involving exponential emission pathways.
Download figure:
Standard image High-resolution image
As was the case for most individual methods (figure 3(g)), the emission imbalance ratios of the three method mixes are generally sensitive to the shape of the global emission pathway and the gap between company variables (figure 4(d)). However, the sign of the emission imbalance ratio is consistent across the sensitivity scenarios, except for the random method mix.
4. Discussion
4.1. Novelty and comparison to similar literature
This study is the first systematic characterization and comparison of all SBT methods for scope 1 and 2 emissions and the first analysis of balancing issues between global corporate SBTs and global allowable GHG emissions. We expanded on the description of four SBT methods of Faria and Labutong (2019) and investigated earlier concerns about emission imbalances (Krabbe et al 2015, Faria and Labutong 2019, SBTi 2019a, Walenta 2020). Our systematic presentation of target equations for all methods (SM 1) may serve as a key reference for practitioners and researchers. We find that most methods, if selected by all companies, would result in more aggressive SBTs than necessary for supporting global temperature goals. This finding appears contrary to the concern of the SBTi (2020c, 2019a) that the GEVA method may lead to an overshoot of the temperature goal (further discussed below). In contrast, we find that global allowable emissions may be substantially overshot if companies systematically choose the SBT method that gives them the least challenging target. This mirrors the finding of Du Pont and Meinshausen (2018) that a median 2100-warming of 2.3 °C would result if each nation state was to choose the least-stringent approach for allocating global allowable emissions consistent with 2.0 °C of warming.
4.2. Limitations and future work
We focused on SBT methods broadly applicable for scope 1 and 2 emissions. Future studies should also pay attention to the emergence of methods for scope 3 emissions (Li et al 2019, SBTi 2019c, 2020c) and methods dedicated to specific industry sectors (SBTi 2020d). For the latter, it is particularly important to understand whether the sectoral emissions scenarios, in aggregate across methods, are consistent with the temperature goal of the Paris Agreement.
We took an archetype approach in the application of SBT methods. This led to a manageable number of companies and meant that the influence of individual company variables on SBTs could easily be observed. As a consequence, the results of our analysis may not be representative of the actual situation with a much larger number of companies, whose variables follow different distributions. Therefore, it is plausible that certain distributions of company variable values could lead to a negative emission imbalance for the GEVA method, as claimed by the SBTi (2020c, 2019a). Future studies may aim to simulate emission imbalances under more realistic conditions (in terms of numbers of companies and distribution of variable values), at the cost of increased model complexity. Such analyses should also consider potential issues related to corporate emission accounting with regards to completeness and accuracy (Busch et al 2020), emission outsourcing (Hertwich and Wood 2018, Baumert et al 2019), emission offsetting 14 and carbon dioxide removal (NCI&DDEL 2020).
While simulations can provide a theoretical understanding of the emission imbalance issue, they must be complemented by empirical studies of companies' actual SBTs and progress towards achieving them. Such studies have been hampered by a lack of documentation about methods used to set SBTs and an inability to evaluate progress over time. The recommendations provided below would enable such empirical analyses of emission imbalances that consider, for example: companies' choice of SBT method, consistency between the baseline years chosen by companies and the first year of the global scenario, consistency between companies' activity projections and those assumed at the global (or regional or sectoral) level, the influence of other corporate emission targets (not set according to the SBT approach) and companies' performance towards achieving targets.
4.3. Recommendations to the science based targets initiative
4.3.1. Presentation of SBT methods
Currently, the SBTi presents the ACA and SDA methods separately, but groups the GEVA, BT-CSI, C-FACT and CSO methods together under terms like 'economic intensity target-setting methods' (SBTi 2020c). Given our findings of non-trivial differences between the characteristics of these four methods (table 2) and the resulting SBT pathways (figure 3), they should be presented separately. In the future, the SBTi could use our framework (figure 1) to characterize new SBT methods. Currently, the initiative makes incomplete references to allocation principles. For example, the SBTi correctly identifies the SDA method as being based on Convergence, but omits that it is also based on Grandfathering, Physical production and Cost-optimization (see table 2). We encourage the initiative to be explicit about the allocation principles involved in each method, as these represent a central normative aspect of target-setting.
4.3.2. Method recommendations
The SBTi currently recommends ACA and SDA over the other methods (SBTi 2020c). As mentioned (section 1), the reasoning behind this recommendation is not entirely clear, but emission imbalance appears to play a role. However, our results indicate that concerns over emission imbalance should favour the CSO and SDA methods, rather than ACA and SDA (figure 3(g)). Of course, there may be other valid reasons favouring the SDA and ACA methods over CSO. For example, the SBTi cautions against using measures of economic emission intensity (which CSO relies on) in sectors characterized by volatile prices (SBTi 2020c). On the other hand, the SDA method has more application constraints than ACA and CSO (table 2), especially considering that the SBTi no longer recommends applying SDA on heterogeneous companies (SBTi 2020c). Strictly speaking, the SDA method is also currently not applicable with 'the latest climate science', since it relies on sectoral emission scenarios predating the IPCC's Special Report on Global Warming of 1.5 °C (IPCC 2018) 15 . Given these pros and cons of individual methods, the SBTi should be transparent about the reasons underlying its method recommendations.
4.3.3. Documentation of approved SBTs
We welcome SBTi's recommendation that 'a company should screen several of the methods and choose the method and target that best drives emissions reductions' (SBTi 2020c). This would reduce the risk of a global emission overshoot, such as observed in our 'least challenging targets' scenario (figure 4(a)). We also agree with the SBTi that companies should describe 'the assumptions and methods used to set the target' (SBTi 2020c). However, most companies currently only present their SBT and not how it was calculated 16 . This lack of transparency makes references to a 'scientific basis' appear somewhat undeserved and effectively hides underlying value judgements from stakeholders. We therefore encourage the SBTi to make target documentation a requirement. Reasons for withholding information, e.g. if a company considers activity projections sensitive, should be stated.
4.4. Outlook
This study provides new insight on the characteristics of and differences between SBT methods and potential emission imbalances arising from their use. Future research is needed to understand SBT method selection, company performance against established SBTs, and anticipated and realized emission imbalances. Increased transparency by the SBTi and companies setting SBTs is needed to strengthen the integrity of SBTs, so that they can play a serious role in closing the large gap between countries' current climate targets and the goal of the Paris Agreement (Marland et al 2015, Lui et al 2020, UNEP 2020).
Data availability statement
Any data that support the findings of this study are included within the article and its supplementary material.
Acknowledgments
We thank Mark McElroy (Center for Sustainable Organizations) and Bill Baue (r3.0) for initial discussions on study design and subsequent comments to a paper draft and Andres Chang (Science Based Targets initiative) for initial discussions on analysing emission imbalances. We also thank four anonymous reviewers for their valuable comments. This research was funded by the Natural Sciences and Engineering Research Council of Canada (NSERC) Discovery Grants Program (Grant Number RGPIN/6956-2017) and the Concordia University Horizon Fellows Program.
Footnotes
- 4
Scope 1 GHG emissions refer to direct emissions by a company and commonly relate to fuel combustion, physical or chemical processing and leakages. Scope 2 emissions refer to indirect GHG emissions from a company's consumption of purchased electricity, steam, and heating/cooling (WBCSD/WRI 2004).
- 5
Value added may be defined as 'sales revenue less the cost of goods and services' (Randers 2012).
- 6
- 7
We report all emission figures for the simplified scenario of global production on a net basis, i.e. gross emissions minus potentially avoided emissions (for example, via carbon sequestration and storage) and removed carbon dioxide from the atmosphere.
- 8
We derived the 12% share from the environmentally extended multi-regional input‐output database EXIOBASE v3.7 for the year 2011 (Stadler et al 2019).
- 9
In theory, users may modify the global scenario of any of the seven SBT methods, for example by changing the parameter values in the CSO tool (CSO 2020), in effect creating additional method versions. Here, we only consider the global scenarios embedded in methods by their developers.
- 10
The literature has mainly considered convergence in terms of per capita emissions of countries. Here, we interpret the Convergence principle in terms of emission intensities of companies.
- 11
When using the exponential pathway, the emission imbalance ratios are higher for BT-CSI and C-FACT (both relying on separate emission pathways for developed and developing countries) than for GEVA (only relying on a global pathway). This is largely because the two regional emission pathways comprised by our global exponential pathway are only approximatively exponential (see figure 2, right panel). See the supplementary spreadsheet for an emission imbalance analysis for alternative versions of BT-CSI and C-FACT with no differentiation between developed and developing countries.
- 12
The BT-CSI method is an exception, since emissions in region#2 (developing countries) peak in 2025 for the sigmoid-shaped global emission pathway (whereas the peak is in 2020 for the other two pathways). This conflicts with the assumption of the method's target equation that the year that regional emissions peak is used as company baseline year (see SM 1 for details).
- 13
The SDA method is an exception. The method's variable capping, mentioned in table 3, means that companies that are projected to grow at a slower pace than the sector average are required to reduce emissions more than they otherwise would have been. This effect is more pronounced the larger the difference between projections of company growth and sector growth is. Therefore, a larger gap between company variables leads to a higher positive emission imbalance for this method.
- 14
Offsets are here understood as 'discrete GHG reductions used to compensate for GHG emissions elsewhere' (SBTi 2020c). The SBTi does not allow offsetting as a means to achieve SBTs (SBTi 2020c), but does allow market-based scope 2 accounting, which has some potential drawbacks in common with offsetting (Brander et al 2018, NCI&DDEL 2020).
- 15
More recent scenarios have insufficient sectoral resolution. The SDA method is therefore currently 'stuck with' IEA scenarios from 2017 (see table 2).
- 16
The SBTi website does not disclose the methods used to calculate the listed approved SBTs (SBTi 2020a). Of the 437 companies with approved SBTs covered by the CDP (2020) dataset, only 23 reported the method used, according to our count (CDP 2020). This information does also not appear to be given in corporate sustainability reports, based on our screening of a small sample of reports.