

Abstract
The pilgrimages of Muslims to Makkah (Hajj and Umrah) is one of the largest religious gatherings in the world which draws millions of people from around 180 countries each year. Heat stress during summer has led to health impacts including morbidity and mortality in the past, which is likely to worsen due to global warming. Here we investigate the impacts of increasing heat stress during the peak summer months over Makkah at present levels of warming as well as under Paris Agreement's targets of 1.5 °C and 2 °C global mean temperature increase above pre-industrial levels. This is achieved by using multi member ensemble projections from the half a degree additional warming, prognosis and projected impacts project. We find a substantial increase in the exceedance probabilities of dangerous thresholds (wet-bulb temperature >24.6 °C) in 1.5 °C and 2 °C warmer worlds over the summer months. For the 3 hottest months, August, September and October, even thresholds of extremely dangerous (wet-bulb temperature >29.1 °C) health risks may be surpassed. An increase in exceedance probability of dangerous threshold is projected by two and three times in 1.5 °C and 2 °C warmer worlds respectively for May as compared to the reference climate. September shows the highest increase in the exceedance probability of extremely dangerous threshold which is increased to 4 and 13 times in 1.5 °C and 2 °C warmer worlds respectively. Based on the indicators of hazard, exposure and vulnerability, we carried out probabilistic risk analysis of life-threatening heat stroke over Makkah. A ten time increase in the heat stroke risk at higher wet-bulb temperatures for each month is projected in 2 °C warmer world. If warming was limited to 1.5 °C world, the risk would only increase by about five times, or half the risk of 2 °C. Our results indicate that substantial heat related risks during Hajj and Umrah happening over peak summer months, as it is the case for Hajj during this decade, will require substantial adaptation measures and would negatively affect the performance of the rite. Stringent mitigation actions to keep the global temperature to 1.5 °C can reduce the risks of heat related illnesses and thereby reduce the non-economic loss and damage related to one of the central pillars of a world religion.
Export citation and abstract BibTeX RIS

Original content from this work may be used under the terms of the Creative Commons Attribution 4.0 license. Any further distribution of this work must maintain attribution to the author(s) and the title of the work, journal citation and DOI.
1. Introduction
Religious rites and celebrations are of fundamental importance to communities of faith all over the globe. The question, if and how climate change may affect the performance of such rites and celebrations is therefore central to assess its full impacts. Specifically, religious ceremonies regularly draw together some of the biggest crowds on the planet (Pew Research Centre 2012). During summer months, such gatherings would be threatened by heat-related illnesses (Soomaroo and Murray 2012, Almazroui et al 2017), which can range from minor (heat cramps, edema, prickly heat, and syncope) to serious conditions (heat exhaustion or heatstroke) (Abdelmoety et al 2018). One such event involving all these illnesses is Hajj, which is considered to be one of the largest congregations in the world, when millions of Muslims from across the globe travel to Makkah, Saudi Arabia every year, and visit the faith's holiest sites.
Hajj is one of the five pillars of Islam and is considered obligatory, at least once in the lifetime for all adult Muslims who are financially and physically healthy and capable (Khan and Shambour 2018). During Hajj, millions perform religious rites together during the short period, within a confined geographical area, making Hajj a very complex system to manage especially when the weather conditions are also not favorable (Yamin and Albugami 2014). During Hajj days, pilgrims mainly stay in tents (occupying <1.4 m2/individual) in the plains of Mina, adjacent to Makkah, where they perform different rituals (Yamin and Albugami 2014). However, on the second day (called 'The day of Arafat'), there is a mass movement of all pilgrims from Mina to the plains of Arafat (∼15 km on foot) starting from dawn until afternoon. All pilgrims then leave Arafat after sunset to spend night at Muzdalifa (∼9 km trip) before going back to their tents in Mina (Noweir et al 2008). These and other such rites seem quite demanding, both physically and mentally, when it comes to performing Hajj in summer.
Besides Hajj, another minor pilgrimage called Umrah, also attracts large crowds towards Makkah throughout the year. Currently, both of these mass gatherings are attended each year by over 20 million Muslim pilgrims, and as per Saudi Government's Vision 2030 the number of Umrah pilgrims alone would reach 30 million by 2030 (Yezli et al 2017). This implies that the number of Umrah pilgrims per calendar month is expected to rival or even exceed the number of pilgrims during Hajj (Yezli et al 2017). Performing laborious religious rituals under scorching heat requires extra mental as well as physical strength, and thus puts many at risk of health hazards.
During these rituals, pilgrims are challenged by extensive stressors involving lengthened movement on foot among large crowds within a confined area, on steep inclines and rough terrain, wearing special outfits and being exposed to sun and thirst. Heat stroke and heat exhaustion may be less common problems among acclimatized Saudi Arabians, these however are the most common medical emergencies among the pilgrims from other parts of the world and lack of proper treatment could exacerbate the condition to organ failure, convulsions, coma, and increasing intracranial pressure (Ghaznawi and Ibrahim 1987). Additionally, diverse immunization makes the pilgrims more susceptible to acquire illnesses and acute infections (Shirah et al 2017).
In the Gregorian calendar, Hajj occurs 10 d earlier each succeeding year, and might occur during the boreal summer for several consecutive years, when the temperature usually exceeds 45 °C (Khan and Alghafari 2018). Over the 21st century, dates of Hajj event fall during extreme heat conditions for three different decades. For the next 10 years, Hajj will take place during summer time (table S1, which is available online at stacks.iop.org/ERL/16/024037/mmedia).
1.1. Heat stress in the middle east
Temperature and relative humidity are directly related to body heat exchange, and therefore best predict times when climate conditions become dangerous consistent with human thermal physiology (Mora et al 2017). A human body generates heat due to the process of metabolism which is dissipated to the surrounding environment, thus maintaining a body core temperature of ∼37 °C (Raymond et al 2020). If the ambient temperature goes beyond this value, the second law of thermodynamics dictates that the human body would be unable to dissipate heat at a normal rate, thus resulting in body heat accumulation (Mora et al 2017). Similarly, the human body is capable of shedding heat through evaporative cooling which becomes ineffective at high values of relative humidity, and therefore body heat accumulation can occur at temperatures lower than the body core temperature. Indices of extreme heat that are solely based on ambient temperature, therefore, do not fully represent the amount of heat stress suffered by the human body (Li et al 2017, Ahmadalipour and Moradkhani 2018). An established indicator of heat stress which takes into account temperature–humidity combination is the wet bulb temperature (TW) which has been thoroughly employed as a measure of human discomfort in published literature (Pal and Eltahir 2016, Im et al 2017).
Outside physical activities which are part of the Hajj and Umrah rituals make pilgrims susceptible to heat stress. Although the extent of human mortality and morbidity is considerably modified by the facilities provided during the Hajj, TW value of as low as 21 °C has resulted in >100 pilgrims falling victim to heat stroke in the past (Noweir et al 2008a). Assessment of future heat stress over the Middle East has received the interest of research community recently, and is considered as a hot spot where the TW have been projected to reach 35 °C (Pal and Eltahir 2016, Ahmadalipour and Moradkhani 2018). Saudi Arabia's plan to host substantially increased number of Hajj pilgrims by 2030 (Yezli et al 2017), also to accommodate an ever growing muslim population world-wide, makes the future heat stress risks due to global warming an issue of paramount importance (Pew Research Center 2011).
In a previous study carried out over Southwest Asia, for the first time the implications of future humid heatwaves on the Muslim ritual of Hajj under different greenhouse gas emission scenario were brought to the forefront (Pal and Eltahir 2016).This is followed by a recent study based on a wet-bulb estimation of future heat stress over Makkah with representative concentration pathways (RCP) 4.5 and RCP 8.5 using the output of three CMIP5 Global Climate Models (GCMs) (Kang et al 2019). Since a lot of planning is involved in hosting a ritual like Hajj that is performed by millions in a confined geographical area, robust information for relevant temperature targets like the one defined by UNFCCC in its Paris Agreement is of utmost importance (Schleussner et al 2015). Moreover in addition to computing the likelihood of future changes in a hazard like heat stress, a quantitative assessment of associated risks can play a crucial role in developing the roadmap for disaster risk reduction strategies (IPCC 2012). Moreover since Hajj takes place at different times of the year, provision of such information at sub-annual time scales is also critical for policy making.
In order to fill the above mentioned gaps in existing literature, we use data of a multimodel intercomparison project 'Half a degree additional warming, prognosis and projected impacts' (HAPPI), specially designed to examine patterns of extreme climate events at Paris Agreement targets of 1.5 °C and 2 °C (Mitchell et al 2017). HAPPI data has been used for assessing the avoided heat related mortality in key European cities in the past (Mitchell et al 2018). Here we aim to analyze the same dataset to identify how much heat stress can be avoided for Hajj pilgrims if we limit the global temperature rise to 1.5 °C as compared to 2 °C. The rest of the paper is organized as follows; the next section describes Data as well as methods used for the calculation of TW, followed by Results and Discussion. The last section describes our main conclusions.
2. Data and methods
The HAPPI experiment is specifically designed to study the differences in the impacts of climate change at 1.5 °C and 2 °C above pre-industrial levels, and has been employed in a range of recent studies including on changes to the hydrological cycle, tropical seasonality and crop production (Döll et al 2018, Faye et al 2018, Schleussner et al 2018, Saeed et al 2018a). Three time periods (Reference 2006–2015, 1.5 °C and 2.0 °C above pre-industrial) are considered under HAPPI, each spanning 10 years. Further details about the experimental setup can be found in (Mitchell et al 2017). Here we use a set of four HAPPI GCMs (ECHAM6, MIROC5, CAM4-2degree and NorESM1) that have been bias corrected to improve the representation of regional features with ISI-MIP2b bias correction methodology using the EWEMBI (EartH2Observe, WFDEI and ERA-Interim data Merged and Bias-corrected for ISIMIP) dataset (Lange 2017). In a previous assessment, this bias correction method has shown marked improvements in the mean values of multiple variables against observations, as well as their associated extremes for all the four HAPPI models used in this study (Saeed et al 2018b). In total, 19 ensemble members per GCM (Global Climate Model) are bias corrected which sums up to 760 years of daily data. Bias correction is carried out for historical as well as two future time periods for the two variables i.e. maximum temperature and relative humidity.
Daily wet-bulb temperature (TW) is calculated based on the empirical equation developed by (Stull 2011), and used for the region in the past application over middle east (Ahmadalipour and Moradkhani 2018). This equation is based on air temperature and relative humidity:
where TW, T and RH denote wet-bulb (°C), dry bulb (°C) and relative humidity (%). TW can be calculated for any air temperature, and we use daily maximum near-surface air temperature for the calculation of TW (Ahmadalipour and Moradkhani 2018). We calculate TW for all the 19 bias corrected ensemble members of four GCMs as well as EWEMBI data which is used as proxy observation.
Furthermore, we construct a time series by taking the spatial average over the region (39.5° N–40.5° N; 20.5° E–21.5° E) around Makkah, and calculate the highest value of TW for each time step . For the calculation of exceedance probabilities and risk ratio (RR) shown in figures 4 and 6, we rank the time series so that the highest value receives a rank of 1 (Makkonen 2006). For each value in the time series, the exceedance probability (p) is calculated as;
where m is the rank (rank 1 given to the highest value) and n represents the number of timesteps in the ensemble.
2.1. Assessing dangerous thresholds for Hajj activities
Despite the fact that physiological attributes of the human body and its tolerance to heat is distinct in different regions of the world (Ahmadalipour and Moradkhani 2018), different matrices and thresholds have been used to quantify the impact of wet bulb temperature. For instance, a TW of 35 °C is considered a limit of human tolerance to heat stress as evaporative cooling at and beyond this limit becomes significantly less effective (Sherwood and Huber 2010), a threshold which seldom occurred in the historical climate (Schär 2016, Raymond et al 2020). For physical labor or demanding outside activities, a TW of 32 °C has been established as an upper limit beyond which such activities may not be safely conducted (Coffel et al 2017). In another study, the 84th percentile of daily TW is considered as optimal wet-bulb temperature at which the heat-related mortality risk shows lowest value (Ahmadalipour and Moradkhani 2018).
A recent study over Makkah employed the criterion from U.S National Weather Service (USNWS) which defines 'dangerous' and 'extremely dangerous' thresholds of 24.6 °C and 29.1 °C respectively (Kang et al 2019). For the sake of consistency, and under the motivation to add further information to findings of the study by Kang et al (2019), we also use the USNWS definition of danger and extreme danger thresholds and align our analysis with these thresholds in the proceeding section.
3. Results
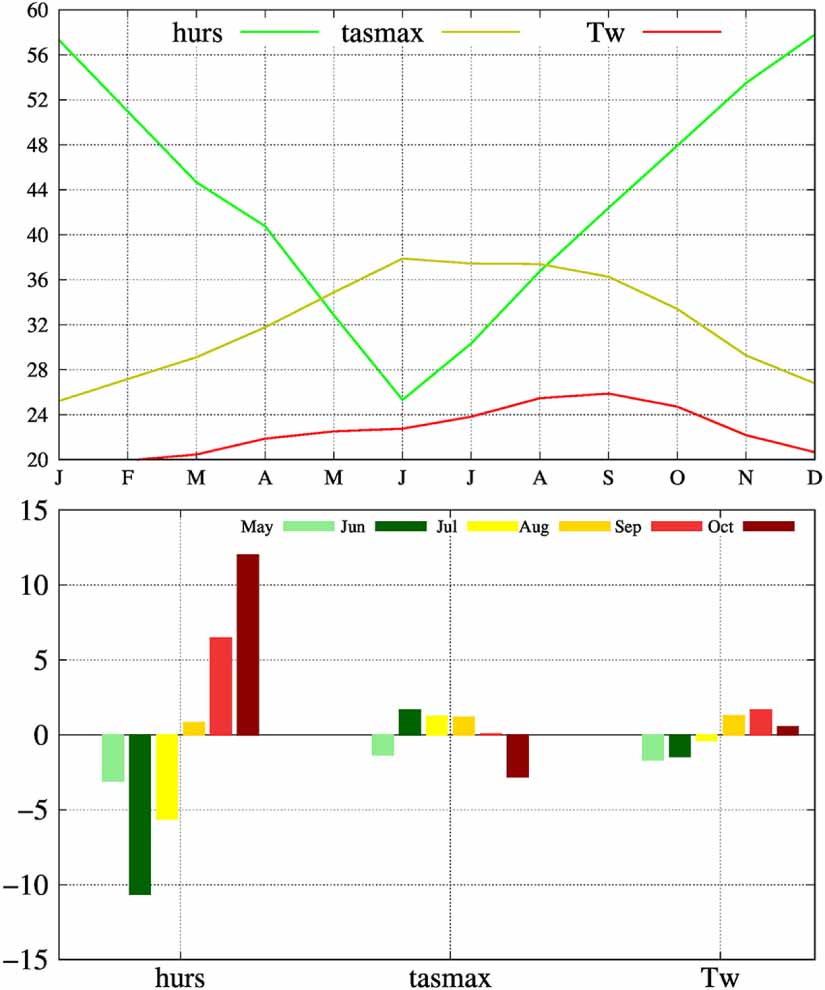
Like most of the middle east, the climate of the Arabian Peninsula is semi-arid to arid, with high annual temperatures and low precipitation. The regions has undergone a significant increase in surface temperature with the reported rate of increase of 0.10 °C per decade over the time period from 1960 to 2010 (Attada et al 2019). The city of Makkah is characterised by a strong annual cycle of relative humidity (hurs), while maximum temperature (tasmax) remain very hot to warm (figure 1). Westerly winds from Red Sea transport humid air into the region that results in the consistent increase of hurs from the lowest values in June to higher values towards the end of the year over Makkah (Kang et al 2019) (figure 1). At the same time, June shows highest tasmax values followed by July, August and September. Despite being the hottest month, top panel of figure 1 indicates that June has a lower value of TW,while July, August, September and October come out as the top 4 months with highest TW values.
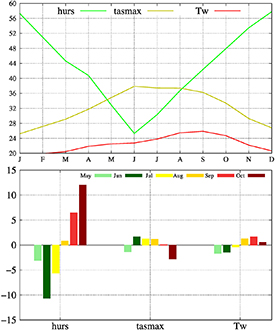
Figure 1. Representation of relative humidity (hurs (%)), maximum temperature (tasmax (°C)) and wet-bulb temperature (TW (°C)) based on EWEMBI data averaged over the period 1980–2010. Top panel shows annual cycle of the three variables. Bottom panel shows the anomalies calculated by subtracting the mean of 6 summer months (May–October) from the value of each month for the three variables.
Download figure:
Standard image High-resolution imageTo further explore the relative contribution of tasmax and hurs to TW, the bottom panel of figure 1 presents anomalies for the 6 hottest months of the year over Makkkah. The months from June to September show small variations in tasmax, while anamolies in TW follow the pattern of hurs which changes gradually from negative to positive for these 4 months. In October, tasmax drops sharply while hurs has the maximum value among the summer months resulting in October to have third highest heat stress values over Makkah. This indicates that although TW depends on both hurs and tasmax, large intraseasonal anomalies in hurs determine the relative severity of heat stress among the peak summer months over Makkah.
3.1. Validation
The ability to capture observed features of the distribution of TW varies across the four GCMs in the reference period as shown in figure 2(a). CAM4 overestimate the peak as compared to EWEMBI, while peak of ECHAM6 occur at higher temperature. However, no model significantly deviates from the observed curve that mostly falls within the inter-model ensemble spread. Further zooming into the tail of the distribution shows that three GCMs (CAM4, ECHAM6, MIROC5) underestimate the observed distribution while one model, NorESM1 overestimates it figure 2(b). However, the observed curve falls well within the multimodel ensemble band for both body as well as tail of the distribution, which shows the advantage of HAPPI-like experiments where individual models might show deviations but a multimodel multi-realization approach results in better representation of the present day climate.
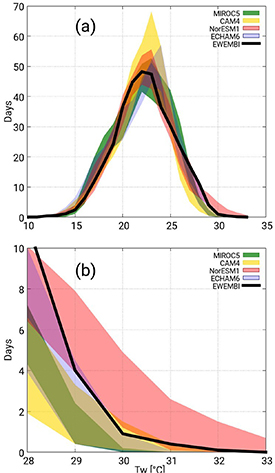
Figure 2. Histogram distribution of annually averaged number of days for each GCM (reference period) versus EWEMBI (2001–2010) averaged over Makkah data (top panel); same but zoomed over the extreme right tail of the distribution (bottom panel). Colour bands show the spread of the 19-member ensemble for each GCM. Histogram bins are taken from 10 °C to 34 °C with an increment of 1 °C.
Download figure:
Standard image High-resolution imageAll the GCMs show gradual shifts of their respective distributions towards higher temperatures in +1.5 °C and +2 °C worlds (figure 3). Zooming into the warm tails of the distribution for each model show a shift towards higher temperatures for CAM4, ECHAM6 and MIROC5. NorESM1, however, exhibits an unexpected behavior with respect to modelling the tail of the distribution with little difference between the distributions. Although it is possible to have a stationary signal in extreme value of a variable under climate change while the mean of a distribution shifts, we do not have any previous reference of such a behaviour with other climate models used in the similar studies over Makkah (Pal and Eltahir 2016, Kang et al 2019), including the other three GCMs used in our analysis. We have no explanation of why this might be the case, but taken together with the bias of NorESM1 in simulating high number of days with extreme TW (figure 2(b)), we decided to not consider this GCM further in the main analysis. The results inlcuding NorESM1 are however presented in the supplementary material section and referred in the text when necessary.
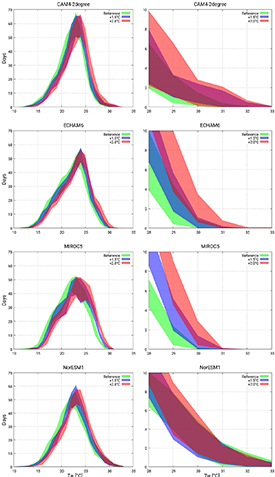
Figure 3. Histogram distribution of annually averaged number of days averaged over Makkah for each GCM for Reference, +1.5 °C and 2 °C (left panels); same but zoomed over the extreme right tail of the distribution (right panels). Colour band show the spread of the 19 member ensemble for each time period.
Download figure:
Standard image High-resolution image3.2. Exceedance probability assessment
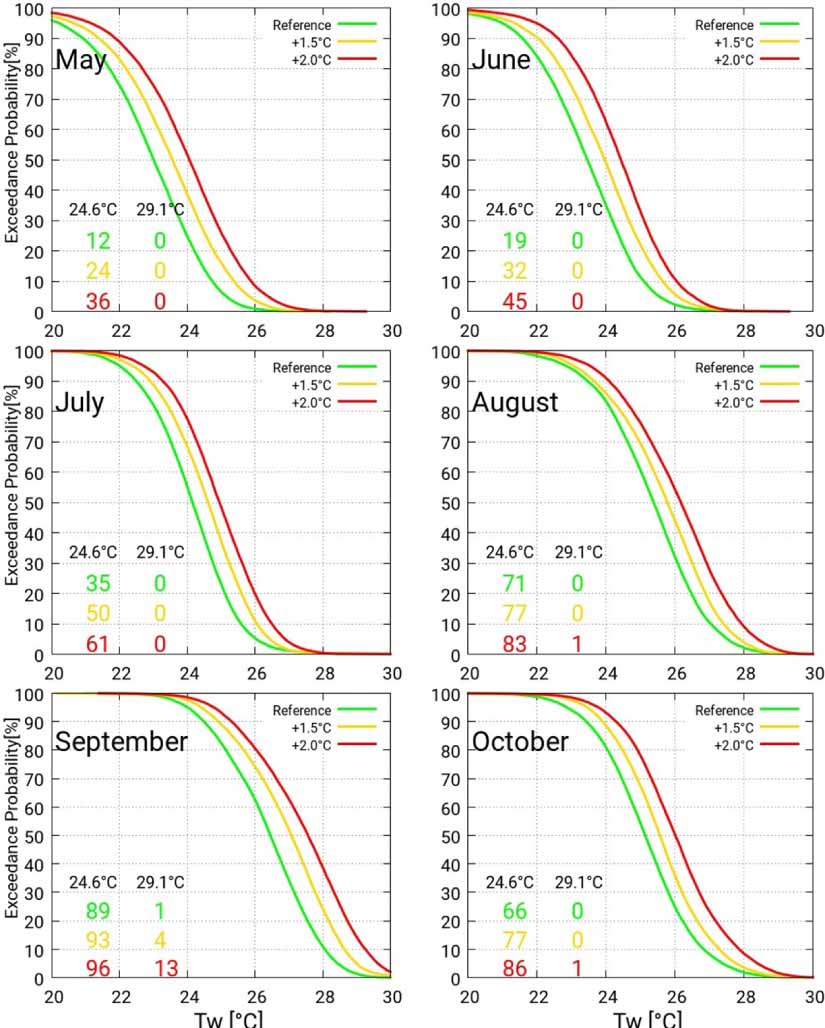
Since the Hajj consists of 5 consecutive days, therefore in this section we derive wet-bulb tempearture estimates using 5 d running average values of maximum temperature and relative humidity in order to carry out the assessment over the full Hajj period. Figure 4 presents the results for the ensemble exceedance probability curves for the peak summer months. This figure is plotted with approximately 17 000 values for every individual month, using output of three HAPPI GCMs each having 19 ensemble members of 10 years.
For each month, the probability values at lower TW remain close to 100% for all warming levels, which gradually decrease towards higher TW along with an increase in differences among the warming levels (figure 4). May has the lowest probability of crossing the dangerous threshold of 24.6 °C in the reference climate which gradually increases as we move towards the later summer months of the year. In future worlds, May indicates highest increase in the probability of crossing the dangerous threshold as compared to other summer months with two and three times increase in 1.5 °C and 2 °C warmer worlds respectively, relative to the historical period. In comparison, August and September already have high probabilities of the dangerous threshold which remain almost equally high in the warming worlds.
September is the only month showing a mere 1% probability of crossing the extremely dangerous threshold of 29.1 °C in reference period. However a substantial increase of 4 and 13 times is projected at 1.5 °C and 2 °C warming levels respectively. A distinctive difference in the exceedance probabilities at different levels of global warming is also obvious at temperatures between dangerous and extremely dangerous thresholds in August and September. Similar plots for each individual model are also computed and are presented in figure S1. These results clearly indicate an increased likelihood of high TW in both the warming worlds. This in turn will increase the risk of the pilgrims to become victims of the heat related illnesses, which we attempt to quantify in the following sub-section. In figure S2, we present the same results as figure 3, but also including NorESM1 in our ensemble. Inclusion of NorESM1 renders the values of dangerous threhold (24.6 °C) largely unchanged, however it affects the exceedance probabilitities of crossing extremely dangerous thresholds (29.1 °C) by a great deal especially in the reference and 1.5 °C warmer world. This is a predicted behaviour considering NorESM1 showed almost similar extremes for all the warmer worlds in figure 3.
3.3. Heat stroke risks
Heat stroke is a life threatening illness characterized by an elevated core body temperature and dysfunction of the central nervous system (Yan et al 2006). To carry out probabilistic risk analysis of heat stroke in historical and warmer worlds, we follow the IPCC's definition of risk as a product of the probability of occurrence of an event and the adverse consequences (impact) of that event (IPCC 2012);

In our case, the Probability refers to that of the hazard i.e. TW at different levels, for which we take the values from figure 4 for reference as well as the warmer worlds. 'Consequence' captures the elements of exposure and vulnerability. For the reference period, the value for exposure is considered as the average number of pilgrims who performed Hajj in the recent past, approximated as two million (Yezli et al 2017). According to the Saudi Arabia's vision 2030, the Kingdom plans to increase the number of pilgrims to 4.5 million by 2030 (Memish 2018). Therefore, we take 4.5 million as the number of exposed people for the two warmer worlds.
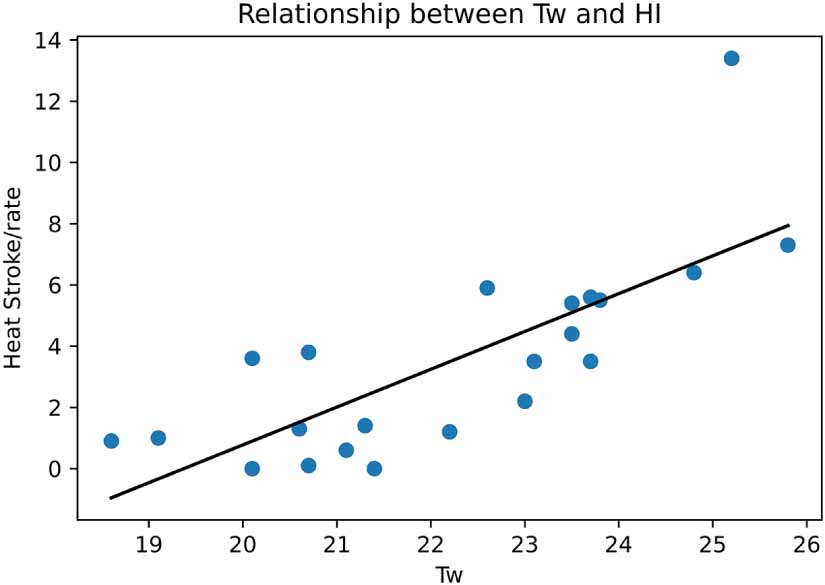
Last time when the Hajj occurred during the summer months of April–September was during the years 1983–1998 (table S1), when thousands of heat-affected pilgrims and even heat-related deaths were recorded (Noweir et al 2008a). Heat stroke incidence rate (HI) and averaged TW during 5 Hajj days for each year during the aforementioned period are presented in figure 5 and table S2. Here we assume that HI captures the elements of vulnerability such as old age, lack of access to cooling facilities, non-acclimatization to hot climate etc. From the values presented in table S2, a simple linear regression based on ordinary least square method is developed to predict HI from TW. A comprehensive check on the data is performed to verify the assumptions of linear regression which is presented in supplementary material. A following significant regression equation is found (F(1,20) = 28.28, p < 0.000), with an R2 of 0.59;


Figure 4. Exceedance probability (vertical axis) versus wet-bulb temperature (horizontal axis) curves based on 3 GCMs (CAM4, ECHAM6, MIROC5) at daily temporal resolution with 19 members of 10 year simulations each. The values inside each panel represent the exceedance probabilities at dangerous (24.6 °C) and extremely dangerous (29.1 °C) thresholds for Reference (green), +1.5 °C (gold) and +2.0 °C (red) periods.
Download figure:
Standard image High-resolution image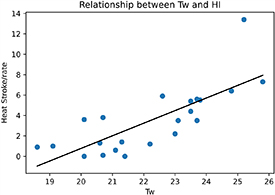
Figure 5. Scatter plot between between heat stroke incidence rate (HI) and wet-bulb temperature (TW) for the period 1983–1988 based on the data obtained from (Noweir et al 2008).
Download figure:
Standard image High-resolution image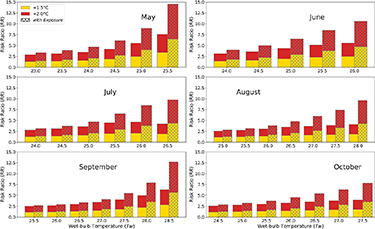
Figure 6. RRs represent the ratios of heat stroke risks between each warmer climate and reference period. Hatched and unhatched bars represent RR_P2030 and RR_Pcurrent respectively.
Download figure:
Standard image High-resolution image
Based on this relationship, we build probability density functions (pdfs) for HI by calculating the ensemble average of CAM4, ECHAM6 and MIROC5 for each of the 19 ensemble member (figure S3). The results show an obvious shift in the means of the distribution towards higher values of HI with global warming in almost all the summer months. However, variance shows inconsistent pattern across the summer months among three warming thresholds. For example, September indicates an increase in mean and the variance of the pdfs as we gradually move towards warmer worlds, while the least warm summer month of May shows a much high variance at 1.5 °C as compared to the reference and 2 °C worlds.
We further calculate the HI at different TW values using model data that are then multiplied by 2 million and 4.5 million to give total heat stroke incidences representing present number of pilgrims (HI_Pcurrent ) and projected number of pilgrims by 2030 (HI_P2030 ) respectively. Finally, heat stroke risk is calculated by multiplying HI_Pcurrent and HI_P2030 with exceedance probabilities at different TW levels, and presented in figure 6 as RRs between the reference and the two warmer climates. We note that health risks tend to increase non-linearly with warming, which render our results conservative (Watts et al 2018).
Figure 6 indicates low RRs as well as minor differences between both the warmer worlds at the respective smaller TW values for each month. These differences and RRs, however, start to grow bigger as we move towards higher TW which is attributed to higher differences in exceedance probabilities as well as vulnerabilities among the three periods. RR_Pcurrent in 1.5 °C and 2 °C warmer worlds gets approximately doubled and quadrupled respectively as compared to the reference climate towards the higher values of TW, and even more in some cases. This implies that at 1.5 °C global warming level, there will be twice the risk of heat stroke compared to the reference climate but it will be half of the 2 °C warmer world.
Similarly, the RR_P2030 for the highest TW for each month is in the range of approximately 10 for 2 °C, which is reduced to 5 in 1.5 °C warmer world. In the least warm month of May, the value of RR_P2030 goes as high as 14 at the TW value of 25.5 °C for the global warming of 2 °C. It is important to note that in order to have sufficient representation of exceedance probabilities for each TW limit, we applied a cutoff at the 98th percentile on the historical period for each month. Therefore, the extremely dangerous threshold does not appear in figure 6, however for August and September, TW values approach this threshold with twice as high risks at global warming level of 2 °C compared to 1.5 °C.
4. Discussion and conclusions
The present analysis is based on the large ensemble of the multiple GCM simulations tailored to provide the information on the Paris Agreement's relevant targets. The results presented indicate much higher likelihood of exceedance of dangerous and extremely dangerous heat stress levels as well as risks associated with them in the future warmer climates for religious mass gatherings like Hajj. We have noticed a substantial increase in the exceedance probability of dangerous temperature limit (24.6 °C TW) in May, June, July and October, while August, September and October are likely to have much higher probabilities of wet bulb temperatures approaching extremely dangerous thresholds (29.1 °C TW). Furthermore, risk of life threatening heat stroke is projected to increase significantlly especially towards higher temperatures in each summer month. However stringent climate action to limit the global mean temperatures to 1.5 °C is projected to reduce these risks to half as compared to the 2 °C warmer world. Since there is a difference in the levels of threat among the four summer months, provision of such information at monthly scale is crucial to preempt a heat stroke disaster accordingly.
There are certain limitations to our approach. The resolution of GCMs is rather coarse and there is a potential to get further insights to the finding of present study by employing a high-resolution regional climate model. Moreover, the empirical function for the calculation of wet-bulb is employed at a relatively coarser temporal resolution (daily) which should be applied at the model time step (300–500 s) in the follow up studies. Another limitation of our analysis relates to the nature of the model simulations used. As shown in (Fischer et al 2018), prescribed SST experiments like the HAPPI experiment used here underestimate natural variability and thereby overestimate increases in probability ratios particularly in tropical regions. Using a fixed threshold of TW 24.6 °C and 29.1 °C instead of a percentile based one partly addresses the concern, but our representation of natural variability is most likely still too low. This implies that our estimates for exceedance probability of dangerous heat thresholds both for present and future warming periods should be considered conservative. Moreover, Our GCM-based analysis does not take local effects such as the Urban Heat Island (UHI) effect into consideration, which can raise temperature by several degrees as compared to non-urban areas. The expected temporary UHI effects during Hajj cannot easily be derived from long-term observational records, as the presence of millions of pilgrims strongly affects the local climate including both temperature and relative humidity, and hence once again render our results conservative.
Besides Hajj, our findings are also relevant for Umrah which is a much less laborious ritual than Hajj but draws millions of people for many months of the year. During the holy month of Ramadan, >7.5 million pilgrims visited Makkah in the recent years. The planned increase of Umrah pilgrims to 30 million per year by 2030 as compared to the present estimate of 19 million (Yezli et al 2017, Memish 2018) would substantially increase the heat load, especially during summer months, thus increasing the vulnerability of old and non-acclimatized pilgrims.
In this study, we intended to further the findings of the previous studies in order to highlight the adaptation implications of heat stress for Muslims pilgrimage at Paris Agreement's targets, and therefore a TW based analysis is carried out to keep the consistency with those studies (Pal and Eltahir 2016, Kang et al 2019). A TW is a direct thermal index which is exclusively based on meteorological data, however there are other available indices which falls under the category of empirical (e.g. physiological strain index (Moran et al 1998)) or rational (e.g. universal thermal climate index (Blazejczyk et al 2012)) thermal indices. Rational thermal index, which account for the interrrelation between metabolic activities, clothing and environmental parameters, is especially relevant for the rituals of Hajj and Umrah because all the pilgrims have to wear special dress called Ihram (Burgstall et al 2019). Ihram garment for men is composed of a sheet of cloth over shoulders and a sheet of cloth wrapped around the waist, both of white colour. Women's Ihram dress is normally a robe of any colour covering the whole body except hands and face (Noweir et al 2008). Therefore, the analysis of heat stress based on 'rational thermal indices' could be an important topic for follow up studies.
Our findings about climate impacts on the Hajj have important implications in the context of non-economic loss and damage (Serdeczny et al 2017). Even if the most severe heat stress related risks for pilgrims can be addressed by adaptation measures, those measures will most likely still alter the nature of the multi-century old religious rites performed there on annual basis leading to non-economic loss and damage. Religious and cultural heritage related to one of the important pillars for one of the world's biggest religious groupings would thus be affected by that loss.
The results of our study call for urgent actions to be taken in adopting strategies to counter impacts of heat stress during Hajj periods and other similar mass gatherings. Heat stress related risk will already be considerably elevated over the next decade. The differences in heat stroke risks between 1.5 °C and 2 °C warming will manifest for the next summer Hajj which span from 2047 onwards (compare table S1). With current national climate targets under the UNFCCC, the world is on track for an about 3 °C warming by the end of this century 5 , which would imply even bigger heat related risks for the third 20 year span of summer period Hajj starting in 2080. Therefore, Muslim countries may want to play a proactive role towards the implementation of Paris Agreement's target of keeping the global mean temperature to 1.5 °C above pre-industrial level in order to avoid profound risks for one of the central elements of their faith.
Acknowledgments
The authors thank the HAPPI initiative and all participating modeling groups that have provided data. This research used science gateway resources of the National Energy Research Scientific Computing Center, a DOE Office of Science User Facility supported by the Office of Science of the US Department of Energy under Contract No. DE-AC02-05CH11231. C.F.S. acknowledges support by the German Federal Ministry of Education and Research (01LN1711A). F.S. acknowledges supported by the German Federal Ministry of Education and Research (BMBF, Grant No. 01LS1711E). M.A acknowledges support by the Deanship of Scientific Research (DSR) at King Abdulaziz University, Jeddah, Saudi Arabia under grant no. (FP-199-42)
The data is accessible from the repository through the following link https://redmine.dkrz.de/projects/happi-de/wiki/How_to_get_data_from_HAPPI_data_portal.
Data availability statement
The data that support the findings of this study are openly available at the following URL/DOI: https://redmine.dkrz.de/projects/happi-de/wiki/How_to_get_data_from_HAPPI_data_portal.
Footnotes
- 5
https://climateactiontracker.org/global/temperatures/ (Accessed on 30.04.2020).