

Abstract
Global biophysical data are increasingly accessible due to improvements in remote sensing and open datasets. These datasets can be of particular value in remote and data-poor environments to enable estimates of water quality impacts from catchment land clearing. Given the resources required to collect field observations and calibrate detailed process-based models, global datasets are often the only sources available to parameterise simple models however the comparative use of these data sources in process-based models is relatively unexplored. This study compares the widely applied models of Integrated Valuation of Ecosystem Services and Trade-offs and Soil and Water Assessment Tool (SWAT) to a tropical catchment in the Solomon Islands using globally available data. These uncalibrated models are contrasted with a SWAT model calibrated with measured streamflow and turbidity in the catchment and meteorologically forced by data from a nearby weather station. These catchment models were coupled with models of sedimentation to examine deposition rates in the coastal lagoon adjacent to the catchment. Model validation using measured coastal sedimentation rates demonstrated that simpler modelling approaches (one-dimensional basin sedimentation and two-dimensional sediment extent modelling) were marginally better than more complex approaches (three-dimensional Delft3D) in data-poor conditions. However, investment in local catchment observations significantly improved the accuracy of simulation outputs. This insight can guide decisions about model complexity, data-richness and investment in local environmental monitoring in these challenging environments.
Export citation and abstract BibTeX RIS

Original content from this work may be used under the terms of the Creative Commons Attribution 4.0 license. Any further distribution of this work must maintain attribution to the author(s) and the title of the work, journal citation and DOI.
1. Introduction
Environmental and ecological questions of a large-scale nature are infamously challenging to answer, even in locally data-rich environments due to the scale and complexity of environmental systems [1]. The challenges in collecting accurate observations across these complex environments to draw system scale conclusions are well known. A common difficulty faced is the trade-off between higher-fidelity datasets collected at small temporal and spatial scales, which often cost a lot to acquire, and broader datasets covering large areas and timescales which are increasingly freely available [2, 3]. Models are often used to make sense of available data by filling the unknown gaps in observed data and estimate past, present, and potential future states through various forms of scenario analysis. For most environmental problems, there are an array of available models of varying complexity based on the range of different processes they attempt to simulate and the approaches taken for this simulation [4]. This range of possible modelling approaches requires an assessment of trade-offs to decide the best approach to use given the available input data and parameterisation requirements. It is often observed that in data-rich environments more complex models are often applied, however this complexity is not always necessary [5]. Policy and management decisions for environments across the world are formed from the pivotal results of investigations that began from a range of possible approaches of differing investments [6, 7].
Catchment hydrology is a prime example of a large-scale environmental system that is both challenging to monitor and to model with a high degree of certainty [8–12]. Data collection and modelling approaches used in catchment hydrology are deeply entwined with the management actions of local water authorities and governments for both short- and long-term planning [13]. Furthermore, the quality of water resources is just as important as its quantity, and much of the pathogen, heavy metal, nutrient, and organic loading transport is associated with the export of sediments from these hydrological systems [14, 15].
Whilst the social, ecological, and economic significance of the quality of water within catchments is important in itself, the downstream receiving water environments of these catchments are often highly sensitive to sediment, and are subject to additional complexity of nearshore sediment dynamics [16–19]. Given the interconnectivity of these various processes from the terrestrial catchments to the coastal environments, attempts to model coastal receiving environments are particularly susceptible to cascading errors. To constrain the uncertainty associated with this error propagation, field data across the land-sea continuum is critical [20, 21].
In recent times, there has been a surge in sources of data that provide an alternative to local monitoring from global climatology analysis [22–24] and remote-sensing [25–30], to global-scale models of the oceans and atmosphere [31–34]. The ability to collect high-quality local-scale field data has also improved in this time. However, the technology required to make this information widely available within reasonable timeframes and in a cost-effective way for hydrological analysis is still in a developmental phase, particularly in remote areas [35]. Moreover, there exist data-poor and/or remote regions of the world where local data is sparse at best and difficult to collect. Hydrological assessments in these remote or data-poor environments typically rely on globally available datasets and literature from other systems in order to make predictions and inform policy or management decisions [36, 37]. Hence, data-poor developing nations undergoing rapid transition of catchment land use often rely on uncalibrated models using global data to guide catchment management that could have substantial social, economic, and ecological ramifications [38].
Despite the challenges with modelling complex hydrological processes in data-poor regions there has been limited reporting of investigations into the value of increasing model complexity and data-richness in these systems. This study addresses this research gap by comparing commonly applied models to assess sediment export from an undisturbed tropical catchment in a remote and data-poor region that faces pressures for natural resource extraction [39–42].
The model development approaches considered in this study explore the two dimensions of process-based model complexity and input data-richness. We used a regionally unique in-stream water quality dataset and measured coastal sedimentation rates to assess the performance of different modelling approaches across the land–sea continuum.
2. Methods
2.1. Overview of methods
This study applied two catchment sediment export models, using input sources of varying data-richness, to explore seven sediment export scenarios. Catchment sediment export estimations and the frequency of total suspended solids (TSS) exceedance were compared using in situ stream observations and water quality guideline thresholds. Simulation results from the catchment models were used as inputs to three coastal sedimentation models. Outputs from the sedimentation models were evaluated using coastal sedimentation measurements under both data-poor and data-rich catchment sediment export scenarios.
2.2. Study characterisation
The study site is the approximately 75 km2 Jejevo catchment (−8.1° S, 159.12° E) located on the windward side of Isabel Island in Isabel Province, Solomon Islands (figure 1). Solomon Islands is a country formed by over 900 islands, where six of the largest islands form the majority of the approximately 650 000 population [43]. Annual rainfall total averages measured in coastal areas of Solomon Islands have mostly been in the range between 3 000 mm and 5 000 mm. Although no long-term rainfall stations exist at higher elevations relative to the coast, it is thought that local topographies may increase the average annual rainfall total to the order of 9 000 mm in some places [44]. While nearby catchments have been disturbed by logging operations, the study area remains a predominantly undisturbed from human interference (a small gardening settlement exists near the mouth of the river) with prevailing steep tropical rainforest (where erosion processes are not well-known). A rare high-quality dataset was collected in the study area, providing a unique opportunity to investigate the value of increased investment in data-richness over a range of model complexities. Hourly in situ stream monitoring and flood event sampling (rising stage samplers and ISCO automated samplers) collected over the duration of 2013, and coastal sedimentation observations over this same period were used from the downstream monitoring site (due to continuous data availability and quality considerations). There were also hourly recorded local weather (rainfall, wind, relative humidity, air temperature, solar radiation, and barometric pressure) observations (Nuha Camp Weather Station) available during this time (figure S1 (available online at stacks.iop.org/ERL/15/124044/mmedia)).
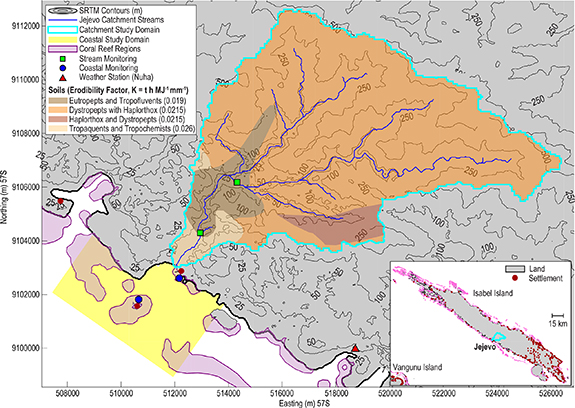
Figure 1. Isabel Island study location, the Jejevo catchment study domain and streams with surveyed soils, coastal study domain, shuttle radar topography mission (SRTM) digital elevation model (DEM) displayed as contours and local field monitoring sites presented alongside identified reef regions and human settlements.
Download figure:
Standard image High-resolution imageEvent sampling and analysis were combined with in situ turbidity from data loggers (YSI 6820 V2) deployed in the Jejevo stream to determine the approximate relationship with the TSS measured in the corresponding samples (figure S2). The best fit was found at approximately one NTU for every 2 mg l−1 of suspended sediment in the stream (R2 of 0.77 with events measured up to 227 NTU and 420 mg l−1 using 40 samples; figure S3 and S4).
TSS frequency of exceedance was calculated for the observations and higher complexity catchment model development scenarios, drawing comparison to turbidity guidelines for thresholds in drinking and environmental water quality [45, 46]. Further evaluation was also able to be undertaken in the receiving waters by using a combination of settling tube deployments and sediment core dating. A sediment core taken from the nearshore site was found to show a sedimentation rate of 1.07 cm yr−1 over the previous 40 year period [47]. This is equivalent to a sedimentation rate of 7.77 mg cm−2 d−1 adjacent to the Jejevo river mouth (assuming a sediment density of 2 650 kg m−3).
2.3. Catchment model development scenarios
Two commonly used catchment models for sediment export estimations were selected to represent the lower and upper ranges of model complexity. The Integrated Valuation of Ecosystem Services Sediment Delivery Ratio Model (InVEST SDR version 3.2) [48] was selected as a low complexity model. InVEST is often applied where local data availability has been considered poor or non-existent [49, 50]. This modelling approach uses a digital elevation model (DEM) to estimate the yield of sediment from the revised universal soil loss equation with a ratio determining the proportion of soil loss exported from a respective stream [48]. Beyond the 30 m resolution DEM provided by the shuttle radar topography mission (SRTM) [51], spatial data is required to delineate the catchment (figure S5) and represent the distribution of soil types (from surveying [52]) and land use (derived from satellite analysis of tree coverage [53] with a 10% tree canopy cover threshold for deforestation [54] determining 99.98% of the catchment to be covered by rainforest). Furthermore, two rainfall erosivity (MJ mm ha−1 hr−1) equations using rainfall in mm were compared as a current constraint is that most studies in soil erosion have been done in agricultural landscapes of the United States of America [55, 56]. The Roose equation

is recommended for InVEST with a multiplier of 0.2–0.6 expected for mountainous tropical areas near the ocean [57]. As with a previous study in the region [49], 0.5 was selected as the multiplier as a compromise for most cases. The second equation compared in this study is the Bols equation [58]
which has also been used in previous work [59, 60].
The Soil and Water Assessment Tool (SWAT) [61] was selected as a similar spatially distributed catchment model that has been widely applied [13, 61, 62], and with a sufficiently higher complexity for comparison in this study. The data inputs for the different model development scenarios are detailed in table 1. Scenario 7, representing the most data-rich model, is the only gauged catchment scenario and involved calibration to in situ data and event samples. Under this condition, calibration to streamflow (Redback current meter, INW pressure transducer, Sontek Argonaut SL1500, Sontek FlowTracker, and Sontek RiverSurveyor) was first performed, followed by calibration to TSS using the best fit observed TSS to turbidity ratio on the logged turbidity measurements (table S1). Calibration was carried out using sequential uncertainty fitting [63]. A normalised root mean squared logarithmic error (NRMSLE) was calculated for the sediment export estimated by each scenario relative to the logarithmic median observed in the catchment,
Table 1. Catchment model development scenarios explored in this study.
| Catchment sediment export model development | Data inputs |
|---|---|
| Scenario 1 Model: InVEST [48] (Roose) | Rainfall data: WorldClimv2 Monthly [23] Catchment: Ungauged |
| Scenario 2 Model: InVEST [48] (Bols) | Rainfall data: WorldClimv2 Monthly [23] Catchment: Ungauged |
| Scenario 3 Model: SWAT [61] | Rainfall data: WorldClimv2 Monthly [23] Catchment: Ungauged |
| Scenario 4 Model: SWAT [61] | Rainfall data: CFSv2 Daily [32] Catchment: Ungauged |
| Scenario 5 Model: SWAT [61] | Rainfall data: TRMM Daily [30] Catchment: Ungauged |
| Scenario 6 Model: SWAT [61] | Rainfall data: Local Daily Catchment: Ungauged |
| Scenario 7 Model: SWAT [61] | Rainfall data: Local Daily Catchment: Gauged |
2.4. Coastal model development scenarios
Three modelling approaches of varying complexity were used to quantify coastal receiving water sedimentation estimations. The sediment export values from scenario 3 (data-poor) and scenario 7 (data-rich) were both used as inputs for each sedimentation model (table 2). The simplest of the approaches considered was a one-dimensional basin sedimentation model (BSM) [64] that was derived as the centerline of the plume exiting the river mouth at a specified width, depth, velocity, and concentration. Beyond these inputs to this model, only one parameter is required to represent the expected 'removal rate' from the plume as it settles out of suspension selected at 0.0001 s−1. Sensitivity analysis showed no significant change in the overall magnitude of the results with changes in removal rate. The BSM estimations for the sedimentation along the plume centerline were calculated on a 50 m grid using the distance from the mouth of the river.
Table 2. Coastal model development scenarios explored in this study.
| Coastal sedimentation model development | Scenario 3 sediment export | Scenario 7 sediment export |
|---|---|---|
| Basin sedimentation model | Data-poor BSM | Data-rich BSM |
| Sediment extent model | Data-poor SEM | Data-rich SEM |
| Delft3D model | Data-poor D3D | Data-rich D3D |
Another approach applied in this study is sediment extent modelling (SEM) [36]. The SEM approach uses globally available surface current modelling [33] and a particle settling rate which is modified to be reduced in shallower depths than 10 m

The settling rate is a key parameter representative of the particle class size of sediment to be modelled, and was selected at 0.00005 m s−1 based on coastal environment fine sediments in the concentration range observed [65]. This revised settling rate compensates for near-shore processes such as wave turbulence which may hinder or reduce the effective settling rate of a particle in suspension. Thereafter, a path distance algorithm is applied using a horizontal relative moving angle and the pre-defined 'forward' horizontal factors using a cost dataset comprised of the calculated seconds needed to traverse a single element of the grid using the surface velocities [36]. Sediment extent areas were calculated for each month's mean surface currents [33] using a surveyed bathymetry dataset (figure S6) and uniformly loaded from the source catchment, with aggregation of these monthly plume areas over the year. The bathymetry survey dataset applied to the SEM in this study was of higher resolution (sampled to 50 m from a higher resolution survey) to those applied in previous studies using global-scale coarse resolution sources on the order of 1 km with simulations carried out at 90 m resolution [36].
A Delft3D model [66] with a 50 m horizontal grid resolution of the receiving waters was developed as the highest model complexity scenario considered in this study. This scenario represents the development of a resource-intensive three-dimensional hydrodynamic, cohesive sediment transport [67], and ocean heat flux model [68] typical of the highest degree of complexity employed to model a coastal receiving water environment [69]. Eleven sigma-coordinate vertical layers were used in the model with higher resolution at the top of the water column reaching 0.17% of the total depth and down to one-third of the total depth at the bottom of the water column. Sedimentation was simulated over the full 2013 study period using the catchment sediment export loading from scenario 3 and 7. The tidal forcing signal was developed using astronomical constituents [70], while Mannings bed roughness was specified at 0.025 in the receiving waters, enhanced to 0.1 in reef regions [71], and 0.05 used in the lower Jejevo stream to the river mouth [72]. The bathymetry of the model was smoothed towards the open ocean boundary for numerical stability in the regions where steep bed slopes were present.
An averaged NRMSLE was calculated between the measured sedimentation rates during the 2013 study period, and the simulated sedimentation rates estimated by each of the coastal models. This performance measure was selected to fairly represent the relative error in the model domain over the larger scales of variation across the study domain and simulation results.
3. Results
3.1. Catchment sediment export
In all metrics (R2, NSE, and PBIAS) the SWAT model calibration in scenario 7 demonstrated a 'very good' performance for streamflow and 'not satisfactory' performance for TSS [73], highlighting a much larger challenge in calibrating sediment export processes at a daily timescale (table S2). The observed mean TSS for the 2013 study period was 110 mg l−1 (20 mg l−1 geometric mean) with a standard deviation of 370 mg l−1, whilst the calibrated SWAT model in scenario 7 achieved a mean TSS of 98 mg l−1 (0.5 mg l−1 geometric mean) with a standard deviation of 312 mg l−1 over the same period. Minimums between the observed and simulated datasets were more similar with 0 mg l−1 for scenario 7 and 2 mg l−1 for the field measurements. In the maximum observations recorded during the 2013 study period, the peak range of the turbidity logger was reached for between 1 day and 1 week. The corresponding potential magnitude of sediment loading to events larger than the measurement range of the turbidity sensor were subsequently unavailable, and hence the maximum observed TSS was 2593 mg l−1, whilst scenario 7 produced an estimated unrestricted maximum of 3305 mg l−1 based on the available measurements.
The total estimated sediment export for the 2013 study period out of the Jejevo estuary was summed for each catchment model scenario and compared with the sediment export distribution observed from field monitoring in the lower Jejevo river (figure 2(A)). Between the two simpler InVEST modelling scenarios, the Roose rainfall erosivity equation was found to be an order of magnitude closer to the observed range compared to the Bols rainfall erosivity variant. In contrast, the SWAT model scenario using global data (scenario 3) was on the same order of magnitude as the Roose rainfall erosivity approach (scenario 1) with an error between the two InVEST scenarios. This result suggests that increasing model complexity without any investment in increased data-richness was of no increased value for predicting sediment export from this catchment in the study period.

Figure 2. (A) sediment export estimated from catchment model scenarios using InVEST and SWAT with the observed sediment export distribution (blue frequencies—hourly observed moving annual averages). (B) cumulative rainfall over the 2013 period from the applied data sources in catchment scenarios one through to seven with WorldClimv2, CFSv2, TRMM, and local observations.
Download figure:
Standard image High-resolution imageIncreasing the rainfall data-richness from a global coarse resolution monthly source to global coarse resolution daily sources both improved the estimation of total sediment export to within one order of magnitude at 87.2% NRMSLE (scenario 4) and slightly worsened the estimation of total sediment export at 99.7% NRMSLE (scenario 5). Noting that both the CFSv2 global forecast model rainfall predictions and TRMM satellite remotely sensed rainfall estimations resulted in under predictions. Figure 2(B) presents the cumulative rainfall for each of the rainfall datasets used across the seven catchment scenarios. Whilst the rainfall total for the global monthly WorldClimv2 is higher than those for both the CFSv2 forecast model and remote TRMM satellite-based rainfall estimations, the sediment export predictions from the catchment under the CFSv2 rainfall dataset is increased and approaches the observed range. Results highlight the significance of capturing local rainfall events on a daily scale compared to monthly timescales when estimating sediment export from this catchment. Scenario 6 using local rainfall measurements with a much higher cumulative rainfall total, was the only scenario to overpredict the observed range with a 72.1% NRMSLE, however it was very close to the observed range. Again, this reinforces the importance of capturing the local rainfall events. As expected, the results of scenario 7 provided the only estimate in this study that matched the observed range, however the calibration of the more complex model comes with the introduction of parameter identifiability challenges [74]. This is especially concerning where differences in rainfall data have been found to have a significant impact on the resulting sediment export. In an environment where local measurement location bias can be very large within the spatial heterogeneity characteristic of local rainfall patterns at the catchment scale, significant recalibration effort is required [9].
3.2. Catchment TSS exceedance frequency
The TSS exceedance time-frequency distribution revealed strong differences in the data-richness dimension across the SWAT model development scenarios 3–7 (figure 3). The ungauged scenarios (3–6) performed particularly poorly in the estimation of TSS exceedance for both drinking [45] and tropical estuarine environmental turbidity guidelines [46]. Whilst the data-poor scenario (scenario 3) predicted guidelines would not be exceeded at all in the study period, investing further in data-richness was able to predict that the guidelines would be exceeded. However, this revealed that exceedances were not predicted to occur with the same frequency as was observed in the catchment. Specifically, observed exceedance of environmental and drinking water guidelines occurring 23% and 60% of the time, respectively. Scenario 4 revealed a 7% frequency of drinking water guideline exceedance, whilst the environmental guideline was rarely exceeded at <1% frequency. The environmental guideline was not exceeded at all in scenario 5, with the drinking water guideline exceeded at a frequency of just 2%. The addition of local rainfall data in scenario 6 improved this estimate to 20% frequency for exceeding the drinking water guideline (40% underestimated), and 9% for the environmental guideline (14% underestimated). Scenario 7 provided a much-improved estimate of the TSS exceedance frequency for the environmental guideline threshold virtually matching the observed frequency of exceedance. However, there still remained more than a 20% underestimation in frequency of exceeding the drinking water guideline. In particular, the results from scenario 7 suggest there are still substantial challenges in simulating low-flow, low-turbidity patterns.

Figure 3. TSS exceedance frequency for the 2013 case study period across the varying SWAT catchment model development cases compared to the observed exceedance frequency and turbidity guidelines [45, 46] in the lower Jejevo river.
Download figure:
Standard image High-resolution image3.3. Coastal receiving waters sedimentation rate
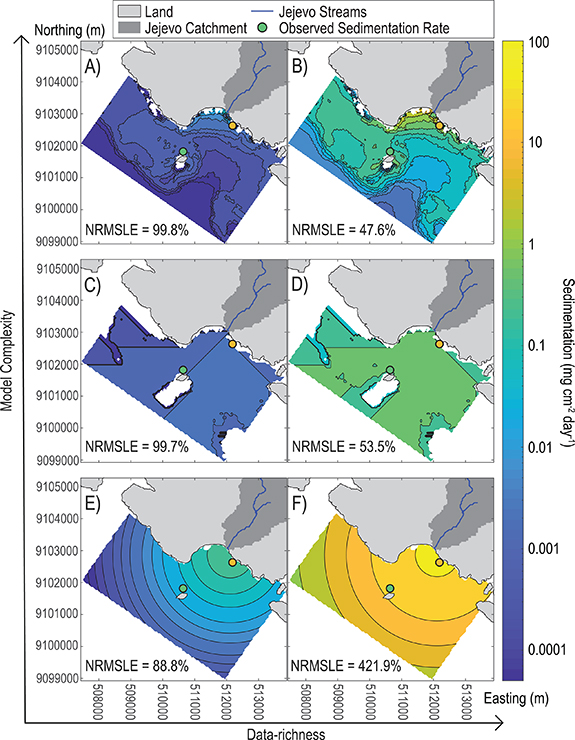
Simulated estimates of coastal sedimentation rates were highly variable depending on data-richness and model complexity. Plume centerline sedimentation rate estimations from the BSM were plotted over the distance from the mouth of the Jejevo river (figures 4(E) and (F)). The nature of the method predicts a radial pattern of potential sedimentation impact, underpredicting the observed rates by a mean NRMSLE of 88.8% in the data-poor catchment export (scenario 3) and overpredicting with a mean NRMSLE of 421.9% in the data-rich catchment export (scenario 7). It is important to note that whilst the data-poor scenario has resulted in a lower error, correct interpretation of the results of the BSM would likely find the data-rich scenario to be the preferable result representing the maximum expected sedimentation from the plume centerline. Although when compared to the highest investment model development scenario (figure 4(B)), the sedimentation patterns and radial rates of the data-rich BSM depict a very different representation of sedimentation in the receiving waters.
Figure 4. Sedimentation rates for the 2013 case study period compared against observations using mean normalised root mean square logarithmic error for (A) data-poor catchment loading scenario 3 with D3D model, (B) data-rich catchment loading scenario 7 with D3D model, (C) data-poor catchment loading scenario 3 with SEM, (D) data-rich catchment loading scenario 7 with SEM, (E) data-poor catchment loading scenario 3 with BSM, and (F) data-rich catchment loading scenario 7 with BSM.
Download figure:
Standard image High-resolution image
Increasing model complexity to the SEM saw an increase in error compared to the BSM whilst using the scenario 3 catchment sediment export (figure 4(C)). However, when the catchment sediment export from scenario 7 was used the mean NRMSLE was reduced by 46.2% (figure 4(D)). Sedimentation patterns from the SEM over the study domain allow the influence of the local geometry of the receiving waters environment to be examined, however results show no resemblance to the patterns predicted by the more detailed scenario (figure 4(B)).
Increasing the model complexity further (D3D model) without any added investment in data-richness (figure 4(A)) was found to further increase the NRMSLE of the resulting sedimentation rate predictions. This result indicated a negative return on investment of model complexity resourcing without any investment to improve data-richness. The D3D scenario representing the most investment in model complexity and data-richness in this study (figure 4(B)) has the lowest error of all the scenarios considered. Estimation of the potential impact from sediment loading into the nearshore was therefore found to highly benefit from the collection of in situ data.
4. Discussion
The results reported here have indicated the possible magnitudes of error involved in the estimation of sediment loading in remote data-poor regions, and the significant benefits of investment in local measurements.
Sediment export results from this study compare favourably with the same scales of magnitude and variation found across similar tropical volcanic catchment environments, such as the Hawaiian Islands ranging from 0.11 t ha−1 yr−1 to 2.97 t ha−1 yr−1 [60]. Estimations of sediment export in Indonesia have been found to range from 0 t ha−1 yr−1 to 100 t ha−1 yr−1 [36], and similarly for estimates elsewhere assessing the InVEST modelling approach [75]. Furthermore, the observed sediment export found at the study site over the period of measurement was found to be well within the range of sediment export observed globally in previous studies [76]. A previous study in the Solomon Islands region has explored concentration–frequency distributions of TSS using an InVEST and SWAT hybrid approach under locally data-poor conditions (with distant weather observations 50 km away) finding similar TSS ranges for the baseline management scenario [49]. Similarly, the range of sedimentation rates from this study are in line with sedimentation rates observed and estimated in other studies with nearshore coral reef environments [36, 77].
Here, the SEM was limited to the extent of the lagoon study domain, where normally the model plume extents could extend to larger areas than available in this study. SEM has been previously applied in much larger study areas at a regional scale, noting that it is expected to be limited in relevance towards nearshore environments [36]. However, these nearshore environments, which are not covered sufficiently by global datasets, have been shown to be some of the most important areas to understand [78]. The consequence of this is the SEM scenarios distributing the catchment sediment loading over a smaller area than would ordinarily occur for this approach, resulting in artificially higher sedimentation than would otherwise be expected.
Estimation of loading rates into these remote or data-poor environments is expected to be increasingly crucial for catchment and coastal environmental management into the future. This is especially pertinent with continuing pressures for natural resource extraction from these tropical islands and a need to predict, assess, and plan for the impact of climate change in these environments [53, 79–81].
This study demonstrated the importance of collecting in situ data for estimating catchment sediment loading for water quality and sedimentation in the receiving waters. Estimation of the frequency of water quality threshold exceedance is critical for prediction of potential impacts for ecological resources [82], however this study demonstrated significant deviations in estimated frequencies of exceedance of TSS with different, readily available choices of rainfall input data-richness and catchment gauging for calibration datasets.
It is recognised that field measurements relating to sediment transport and loading are highly uncertain on the scale of at least an order of magnitude [83]. However, this study has demonstrated that this range of uncertainty is dwarfed by the range produced by different combinations of modelling approach and input datasets. Therefore, investment in field monitoring is a highly valuable contribution to making predictions or furthering understanding of sediment movement in these environments. At the very least, recording local rainfall measurements improved annual loading estimations. However, to obtain a reasonable estimation of water quality exceedance frequencies of higher relevance to the health of these ecosystems [84], you need to gauge the catchment with streamflow and turbidity monitoring. The local data used in this study cost on the order of US$ 250 000 in human resources and equipment for this remote region of the world, and novel lower cost monitoring techniques such as camera-based particle image velocimetry/space-time image velocimetry (PIV/STIV) [85–89] would be recommended for further development in deploying to these environments in addition to lower cost sediment monitoring equipment [83] which should be developed to minimise maintenance requirements.
The calibration of these field datasets to models of increasing complexity is not without significant challenges in itself [90]. However, it is clear in this study that increasing model complexity investment in either catchment or coastal receiving water prediction has not returned any positive value to the estimations in the absence of in situ data collection. This study saw increasing model complexity without additional investment in local data resulted in a further divergence in results away from the observations, potentially resulting in a poorer set of information from which environmental management decisions are made.
Acknowledgments
The authors would like to acknowledge the Jejevo people for their support during the field campaign. Sumitomo Metal Mining Co., Ltd. And Golder Associates Pty. Ltd. provided funding and technical field support in this remote and challenging location. This research was supported by an Australian Government Research Training Program (RTP) Scholarship.
Data availability statement
The data that support the findings of this study are available upon reasonable request from the authors.