

Abstract
High Mountain Asia (HMA), which includes the Tibetan Plateau, Tienshan Mountains and surrounding region, has abundant snowfall and a long period of snow cover annually. The headwaters of many prominent Asian rivers depend in part on HMA meltwater. In this study, we evaluate projected changes in mean snowfall (Smean), snowfall days (Sd), and snowfall fraction (Sf) for the years 2070–2099 relative to 1976–2005, under the Representative Concentration Pathway 4.5 (RCP4.5) and 8.5 (RCP8.5) emission scenarios. An evaluation of the results shows that while NASA's NEX-GDDP (National Aeronautics and Space Administration Earth Exchange Global Daily Downscaled Projections) high-resolution daily downscaled dataset can successfully capture the distribution of mean snowfall climatology, it has a strong bias for extreme snowfall indices. In general, the projected increase of temperature under RCP4.5 and RCP8.5—especially in winter—will result in a decrease in snowfall amount (−18.9%, −32.8%), fewer snowfall days (−29.6%, −47.3%), and less precipitation falling as snow (−26.7%, −42.3%). Furthermore, under high emission scenarios, rain-dominated regions are projected to expand 53.9%, while snow-dominated areas will only account for 17.9% of the entire HMA. Spatially, snowfall shows a more robust decline in eastern HMA (e.g. East Tienshan, East Kun Lun, Qilian, South and Eastern Tibet, and Hengduan) than in western HMA (e.g. Hissar Alay, Pamir, and Karakoram). This difference can be attributed to various environmental factors, such as climatology, elevation influences, and the unique seasonal recycle between the two regions.
Export citation and abstract BibTeX RIS

Original content from this work may be used under the terms of the Creative Commons Attribution 4.0 license. Any further distribution of this work must maintain attribution to the author(s) and the title of the work, journal citation and DOI.
1. Introduction
Snow is a critical component of the world's hydrological system. It plays an important role in Earth's energy flow, surface runoff, and material cycle and thus affects regional and global weather and climate (Barnett et al 2005, Screen and Simmonds 2012, Deng et al 2017). Snowfall and snowpack are also important sources for irrigation and drinking water in many parts of the world. Globally, more than one-third of irrigation water comes from melting snow and more than one-sixth of the entire population relies on melting ice and snow for water (Barnett et al 2005). In High Mountain Asia (HMA), which comprises the Tibetan Plateau and surrounding mountainous regions, most of the precipitation falls as snow because of the high terrain. This vast area boasts the world's largest reservoir of perennial glaciers and snow outside of the polar ice sheets, with more than one billion people depending directly or indirectly on water sourced from its melting snow (Smith et al 2017).
However, recent decades have seen reductions in snow cover and snowfall amounts in HMA. A study conducted by Tang et al (2019) showed that snowline altitude at the end of the region's melting season generally exhibited a rising trend from 2001 to 2016, with 75.3% of the study area displaying an increase and 24.2% a significant one. The increase in the snowline can be attributed to a decrease in snowfall caused by higher temperatures. Despite rising precipitation levels in HMA from 1961 to 2013, snowfall amounts and snowfall fractions exhibited significant decreasing trends of −0.6 mm a−1 and −0.5% a−1, respectively (Wang et al 2016).
In general, global mean surface temperatures are predicted to continue to increase primarily due to human activity-induced greenhouse gas emissions. If there are no changes in the amount of precipitation, the warming may produce less snowfall by reducing the fraction of total precipitation that falls as snow. Relative to changes in temperature, changes in precipitation are not only highly uncertain but also highly dependent on region and season.
Furthermore, while all climate scenarios indicate that both temperature and precipitation will increase in HMA (Zhu et al 2013), projected snowfall rates are yet unclear. Viste and Sorteberg (2015), using the Coupled Model Inter-comparison Project 5 (CMIP5) climate model, pointed out that compared with 1971–2000, annual snowfall under a strong anthropogenic forcing scenario in the Himalayas would likely decrease by 30%–50% in the Indus River Basin, 50%–60% in the Ganges River Basin, and 50%–70% in the Brahmaputra Basin by 2071–2100. Krasting et al (2013), using a multi-model ensemble of CMIP5 simulations of projected future climate under the moderate emissions scenario, studied trends in annual, seasonal, and monthly snowfall in the Northern Hemisphere. They found that the transitional zone between the positive and negative snowfall trends was roughly equivalent to the −10 °C isotherm of the mean winter surface temperature at the end of the 21st century, with positive trends prevailing over large regions of Tibet in winter.
A review of the published literature indicates that future snowfall projections mostly rely on global climate models (GCMs) that focus on evaluating Earth's climate change in the future. However, due to their coarse spatial resolution, GCM projections are not able to properly resolve snowfall events over areas with complex topography, such as HMA. Some studies used a dynamical downscaling method to solve this problem. For instance, Zhou et al (2018) examined future changes of snowfall in China based on an ensemble of simulations using RegCM4. Although the dynamical downscaling method can provide a physical-based approximation for finer scales, it suffers from huge computing costs, inaccurate lateral boundary transition handling, inflexibility, and intrinsic bias.
In comparison, statistical downscaling is much more computationally straightforward for obtaining high-resolution climate projections. Recently, a new high-resolution (25 km) daily statistically downscaled climate dataset called National Aeronautics and Space Administration (NASA) Earth Exchange Global Daily Downscaled Projections (NEX-GDDP) is being generated by utilizing the Bias-Correction Spatial Disaggregation method. The Bias-Correction approach is a regression strategy for solving problems of coarse resolution coverage as well as the issue of global accuracy vs local bias.
NEX-GDDP data have been widely used in many studies to assess temperature and precipitation changes on a regional scale (e.g. Bao and Wen 2017, Chen et al 2017, Daksiya et al 2017; Raghavan et al 2018). For example, Chen et al (2017) indicated that NEX-GDDP can successfully reproduce spatial patterns of precipitation extremes over China, and that these results are closer to the observed values than GCMs, with increased Pearson correlation coefficients and decreased model relative error for most models. Raghavan et al (2018) also applied the NEX-GDDP dataset to Southeast Asia, with their results showing that monthly-scale data are in good agreement with historical observations. Because NEX-GDDP is considered a promising source for climate prediction and also has been widely used both regionally and locally (Thrasher et al 2013), it gives researchers the opportunity to gain a preliminary understanding of possible climate changes in areas that are highly vulnerable, such as HMA, and apply this information to impact studies.
To systematically and comprehensively assess snowfall patterns in and around the HMA region, this study used the NEX-GDDP dataset to: (1) evaluate the performance of the NEX-GDDP dataset in reproducing historical snowfall by comparing it with observational data, and (2) identify spatiotemporal snowfall changes in potential future climates under Representative Concentration Pathway 4.5 (RCP4.5) and 8.5 (RCP8.5).
2. Study area
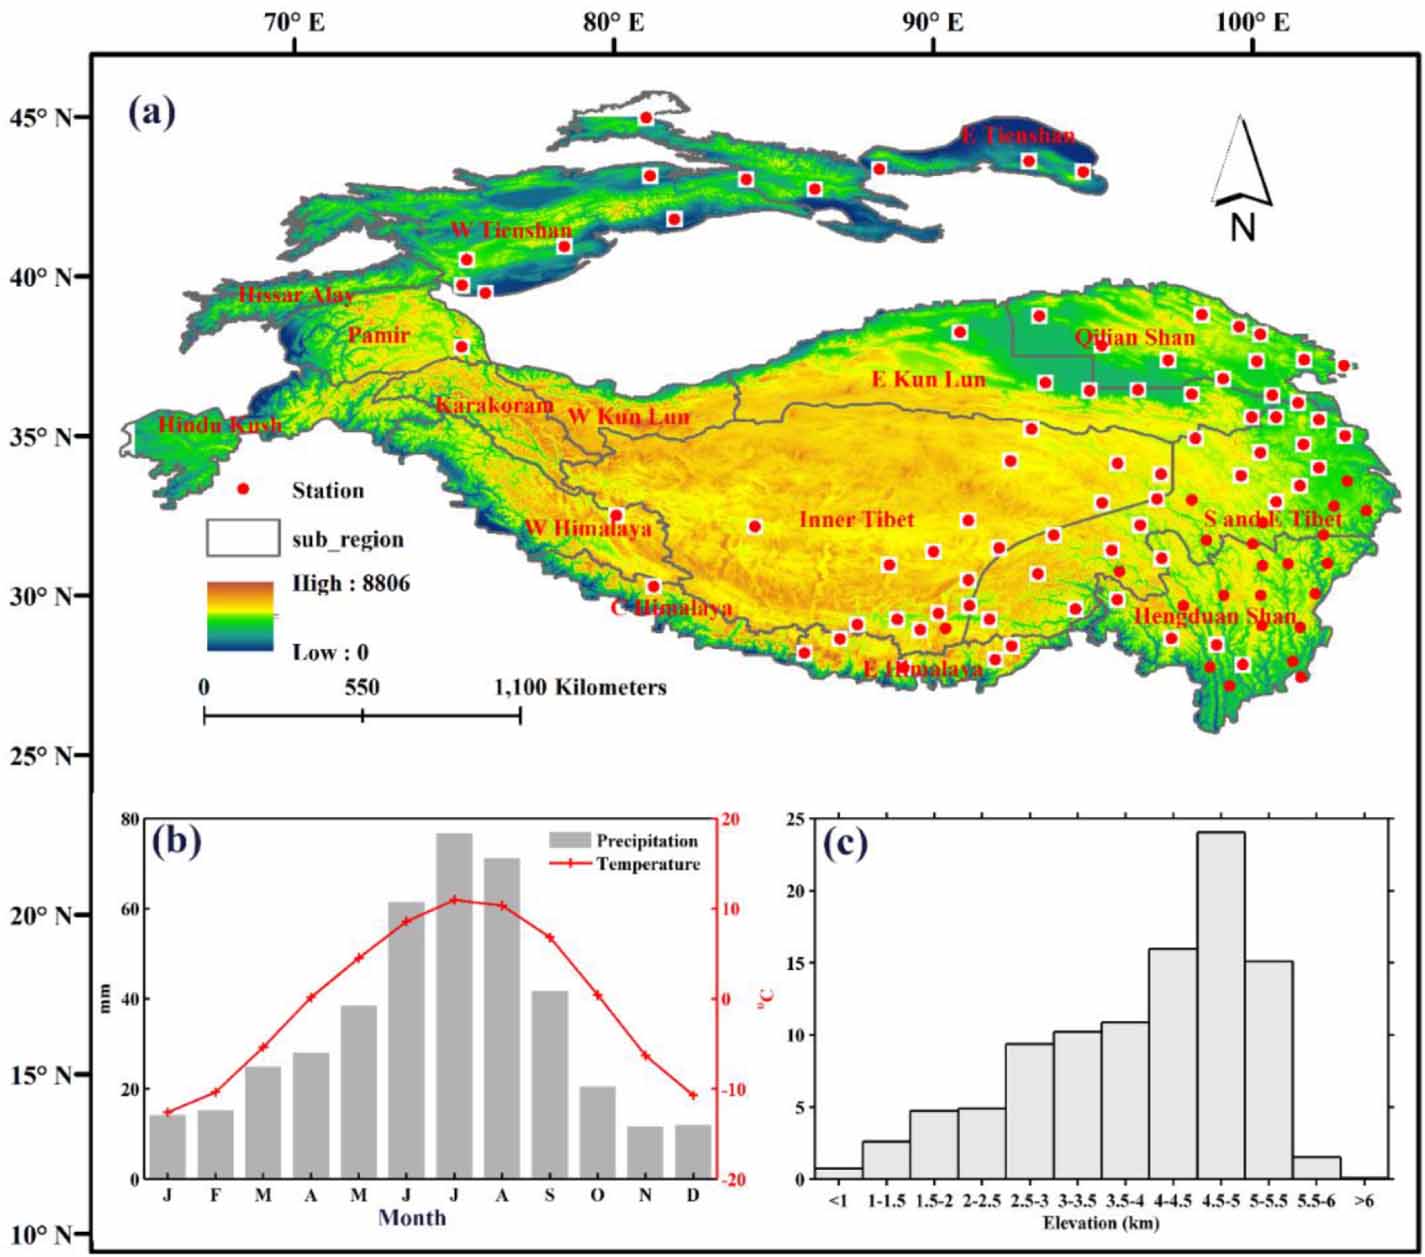
High Mountain Asia is located between Central and East Asia. In general, it consists of a large number of the world's highest mountains (e.g. the Tienshan, Himalayan, Hindu Kush, Karakoram, Pamir, Qilian, and Hengduan mountains) (figure 1). The geographical range stretches from about 25°N to 46°N and 64°E to 106°E and the terrain is highly complex, with over 50% of the area being\, ≥4000 m a.s.l. These characteristics make HMA the world's largest extensive area of high elevation habitat. In general, the region's main moisture sources originate from the westerlies in winter and the Indian and Asian monsoons in summer (Yao et al 2012, Song et al 2016, Deng et al 2017).
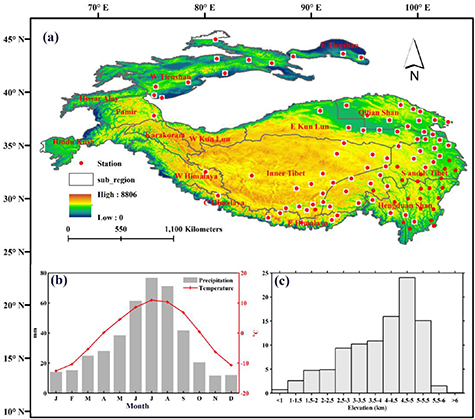
Figure 1. Location and extent of study area and sub-regions. Red dots denote meteorological stations, with the letters 'W', 'C', 'E' and 'S' indicating west, central, east and south, respectively. (b) Mean monthly temperature and precipitation based on data from all stations in HMA. (c) Hypsometry of the HMA at 500 m elevation bins.
Download figure:
Standard image High-resolution image3. Data
The NEX-GDDP dataset is used to examine future snowfall changes in HMA. The NEX-GDDP compiles 42 climate projections from 21 CMIP5 GCMs (Table S1) and two RCP scenarios (RCP4.5, RCP8.5) for the years 2006–2100 (note that 2 of the 21 models only provide data through to 2099). As well, historical experiments for each model are given for the period 1950–2005. NEX-GDDP can be downloaded from its official website (https://nex.nasa.gov/nex/projects/1356/). For this study, three key climatic variables (daily precipitation, daily maximum temperatures, and daily minimum temperatures) for 1950–2005 and 2006–2100 were employed to calculate historical and future snowfall in HMA.
To determine the relationship between snowfall fraction (SF) and surface air temperature (Ts), we obtained the relevant daily observed temperature and precipitation datasets for 77 meteorological stations from the National Meteorological Information Center, China Meteorological Administration (http://data.cma.gov.cn). The stations are indicated by red dots in figure 1.
To evaluate the consistency between the results of the NEX-GDDP model and the observed climate in the historical period, gridded temperature and precipitation data from a land surface hydrological model simulation driven by observation-based meteorological forcing are used to estimate the gridded snowfall dataset (Sheffield et al 2006).
4. Methodology
Based on the empirical relationship between surface temperature and snowfall frequency, future gridded snowfall data were obtained from the gridded temperature and precipitation of NEX-GDDP. On this basis, using RCP4.5 and RCP8.5, the projected changes for the three indicators of snowfall amount, snowfall days and snowfall fraction were evaluated for HMA. According to the characteristics of these indicators, we also investigated the contribution of temperature and precipitation to snowfall, the projected changes of different snowfall events, and the future changes of snow-dominated areas. Detailed calculations are presented in the following sections.
4.1. Snowfall estimation
Of the landscape and surface atmospheric conditions used to estimate the precipitation phase, surface temperature is the one most commonly utilized. Due to the lack of a gridded observational snowfall dataset and the fact that NEX-GDDP does not provide raw snowfall as an output variable, we first need to establish the relationship between surface temperature and snowfall fraction, and then to calculate future snowfall. The empirical formula of surface temperature and snowfall fraction can be obtained from the observation station data of surface temperature, precipitation and precipitation type, based on the method proposed by Dai (2008). This approach is widely used for estimating the precipitation phase, as it requires fewer parameters and has acceptable accuracy (Jennings et al 2018). Further, this method determines precipitation types through a sigmoidal hyperbolic tangent curve to fit the observations of snow conditional frequency and surface temperature (equation (1)).
As a first step, we collected 120 602 daily temperature, precipitation, and type of precipitation samples from 77 stations in HMA from 1961–1979 (note that since 1980, the weather stations have not recorded precipitation type). Through these sample data, we calculated the snowfall frequency every 0.5 °C Ts bin from −10 °C to 10 °C, and then used the sigmoidal hyperbolic tangent curve to fit it. Finally, we applied the empirical formula to the temperature and precipitation data of NEX-GDDP to calculate the historical and future snowfall, as follows:

where SF and Ts are snow condition frequency (%) and surface temperature (°C), respectively, and a, b, c and d are dimensionless parameters obtained by using the Levenberg-Marquardt method for nonlinear least squares fitting, based on larger sample size observation stations in HMA. In this study, a = −49.02, b = 0.4321, c = 2.47, and d = 1. Figure S1 (available online at https://stacks.iop.org/ERL/15/104040/mmedia) shows that the SF–Ts relationship for snow and rain can be well-fitted with a hyperbolic tangent function in HMA, giving the coefficient of determination R2 as 0.9994 (p < 0.01, figure S1(a)). In order to further verify the reliability of this empirical formula, we also compared the annual snowfall of 77 stations from 1961–1979, based on observation and formula calculations. Generally speaking, the annual snowfall calculated based on the formula has a certain underestimation error, but the determinant coefficient R2 also reaches 0.96 (p < 0.01) (figure S1(b)).
4.2. Snowfall indices
Four snowfall indices are evaluated in the present work: (a) mean snowfall amount (Smean), (b) snowfall days (Sd), (c) snowfall fraction (Sf), and (d) maximum 1-day snowfall (Smax). These indices, along with their units and abbreviations, are listed in table S2. Prior to performing residual analysis, daily snowfall ≤1 mm is set to zero for both observations and simulations. This is because climate models often suffer from a high incidence of drizzle, so it is difficult to measure small amounts of precipitation (Frei et al 2018).
To quantitatively assess the effects of temperature and precipitation and their interactions with snowfall variations, a more theoretical framework proposed by Krasting et al (2013) is adopted in this study. Snowfall ( ) is expressed as the product of snowfall fraction (
  ) and precipitation (
 ):
):

Changes in precipitation  , snowfall
  and snow fraction
  can be written as:


Through some algebraic manipulation,  change may be rewritten as:

Where  ,
,  , and
, and  represent annual precipitation, snowfall, and snowfall fraction during 2070–2099, respectively, and
  ,
,  , and
, and  are the average values during 1976–2005, respectively.
  can be regarded as the contribution of temperature and precipitation changes and their interaction with the overall change of annual snowfall.
We also investigated changes in the number of days of different snowfall events. According to the classification standard of China Meteorological Administration, 1–2.5 mm day−1 is light snowfall, 2.5–5 mm day−1 is moderate snowfall, 5–10 mm day−1 is large snowfall, and more than 10 mm day−1 is heavy snowfall (Zhou et al 2018).
Consistent with Elsner et al's (2010) and Littell et al's (2018) classification criteria, and to determine the future changes of snow-dominated areas, we further defined areas with Sf ≤ 0.1 as rain-dominated, 0.1 < Sf < 0.4 as rain-snow transitional, and Sf ≥ 0.4 as snow-dominated.
4.3. Model evaluations and projection changes in snowfall
To assess the ability of models to project snowfall, the pattern correlation (PCOR) and model anomaly bias (BIAS) are employed. BIAS measures the average tendency of the simulated data with observations, while PCOR describes the temporal and spatial correlation between the simulated data and observations.
For the projection, we focus on the ensemble results at the end of the 21st century. The ensemble mean is simply taken as an arithmetic average of the 21 simulations. To provide a range of future snow scenarios for HMA, we calculated absolute and relative changes in snowfall for the years 2070–2099, relative to a baseline period of 1976–2005 under RCP4.5 and RCP8.5 emissions scenarios.
5. Results
5.1. Evaluations of snowfall results from NEX-GDDP data over baseline climate
To assess the ability of models to project snowfall and spatial patterns, a comparison of snowfall indices from the NEX-GDDP dataset for the period 1976–2005 is performed against gridded observations for HMA (figures 2 and S2). Various atmospheric circulation system (East Asian monsoons, Southwest monsoon and westerly circulation), together with huge terrain and horizontal gradient effects, exert a complex control effect on the spatial pattern of snowfall in HMA (Deng et al 2017; Yao, 2012). High values for observed amounts and days of snowfall in HMA were mainly distributed in western Tienshan Mountains and southwest and southeast of the Tibetan Plateau. This spatial pattern is successfully captured by the multi-model mean ensemble (MME) results from NEX-GDDP, with spatial correlation coefficients of 0.98 (p < 0.01) for Smean and 0.94 (p < 0.01) for Sd in HMA. Similarly, the southeast-northwest gradient of snowfall fraction is also well-captured by the MME, with high spatial correlations of 0.96 (p < 0.01).
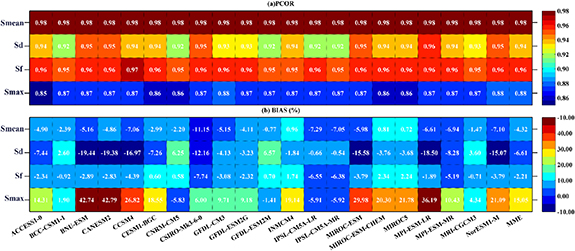
Figure 2. Comparison of model performances in simulating spatial patterns of Smean, Sd, Sf, and Smax in HMA between grid observations and NEX-GDDP. The metric analysis includes estimations of pattern correlation coefficient (a) and model relative error (b). The climatology is derived for the period 1976–2005.
Download figure:
Standard image High-resolution imageAlthough NEX-GDDP can accurately simulate spatial patterns for three of the four snowfall indices adopted in this study, the underestimated snowfall bias is quite obvious between NEX-GDDP and observations for some individual models. The MME results could, however, reduce this bias and provide a better performance than the individual model, where the mean bias for Smean, Sd, and Sf is −4.32%, −6.61% and −2.21%, respectively. On the one hand, this underestimation error is due to the underestimation of simulated snowfall by the method proposed by Dai (2008). On the other hand, previous studies have confirmed that the precipitation data of NEX-GDDP has a negative deviation from the observed data (Bao and Wen 2017). In terms of Smax, NEX-GDDP shows a low performance in simulating the spatial distribution of extreme snowfall, especially in Pamir, Hindu Kush, and the Himalayas, where the maximum snowfall is substantially overestimated. The mean bias for Smax across the entire HMA region is 15.05%. Based on the above analysis, only three snowfall indices (excluding Smax) are used to project future variability of rainfall events in HMA.
5.2. Projected change in mean snowfall
Snowfall is sensitive to climate change and is controlled by both temperature and precipitation. Relative to 1976–2005, the annual mean temperature for the end of the 21st century is simulated to increase by about 3.1 °C and 5.4 °C under RCP4.5 and RCP8.5, respectively (figure S3). Overall, the temperature shows a larger increase in eastern HMA than in western HMA. An increase in total precipitation is also simulated (53.9 mm for RCP4.5 and 131.4 mm for RCP8.5; figure S3). Precipitation changes are spatially heterogeneous and show a decreasing gradient from southeast to northwest.
Against this background, figure 3 shows ensemble-projected percentage changes in the amount of total snowfall in 2070–2099 relative to 1976–2005 for both emissions scenarios. Despite the increase in total precipitation, snowfall diminishes in most parts of HMA for both. The MME decreases in mean annual snowfall by the end of the century amount to −18.9% and −32.8% for RCP4.5 and RCP8.5, respectively (table S3). Losses >50% projected by the models are mainly concentrated in East Tienshan, East Kun Lun, Qilian, South and Eastern Tibet, and Hengduan. The largest reduction in snowfall is projected for Qilian due to its low topography, with values of −85.3% under RCP4.5 and −93.1% under RCP8.5. In contrast, increases in snowfall are projected to occur under RCP4.5 in some high-elevation regions such as Hissar Alay (2.5%), Pamir (17.1%), and Karakoram (6.0%) (Table S3).
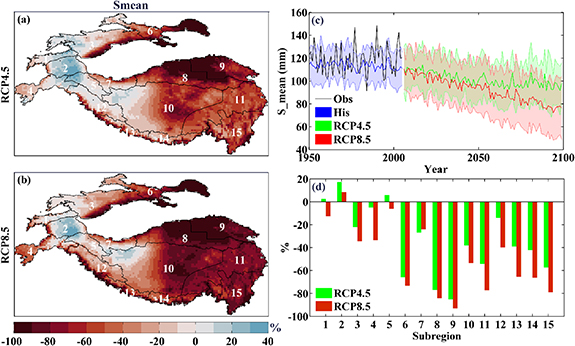
Figure 3. Relative to 1976–2005, projected changes in mean snowfall (S_mean) at spatial (a, b), temporal (c), and regional (d) scales for 2070–2099 under RCP4.5 and RCP8.5 scenarios. The shading in (b) represent the multi-model standard deviations and indicate model uncertainty.
Download figure:
Standard image High-resolution imageIn general, higher temperatures usually result in less snowfall. However, if there is no temperature change, greater amounts of precipitation will result in more snowfall. To further test this hypothesis and quantitatively evaluate the role of precipitation and temperature in snowfall change, the change in snowfall is decomposed into three terms ( ) following equations (2)–(6) in section 4.2. Figure S4 confirms that the projected changes in snow fraction contribute to less snowfall by the end of this century in almost all areas. Specifically, our results indicate that warmer temperatures result in snowfall decreases of 29.1% and 51.4% under RCP4.5 and RCP8.5, respectively.
On the other hand, the effect of precipitation is opposite to that of temperature. Increased precipitation causes higher snowfall amounts without any changes in temperature. The models show that the average projected increases in precipitation by the end of the 21st century can result in an increase in snowfall of about 8.6% and 27.2% under RCP4.5 and RCP8.5, respectively. Moreover, the interaction term between temperature and precipitation, which typically plays a negative role in snowfall, is small and does not have a first-order effect in determining the overall sign of snowfall. In HMA, most sub-regions are dominated by  , which explains the decrease in snowfall. However, in regions like Pamir and Hissar Alay, the effects of
 on snowfall trends are offset by the effects of
  , indicating an increase in snow.
5.3. Projected changes in snowfall days
Decreases in snowfall frequency are very similar to changes in mean snowfall. By the end of the current century, the frequency of snowfall is projected to drop by 29.6% under the RCP4.5 scenarios and 47.3% under the RCP8.5 scenarios (figure S5). Furthermore, there is an obvious difference in the decreasing range of snowfall frequency between eastern HMA and western HMA. In most of eastern HMA, snowfall frequency experiences a 76.8% to 94.4% reduction. Qilian experiences the greatest change, with a decrease of 86.7% under RCP4.5 and 94.4% under RCP8.5. Most regions in eastern HMA show at least moderate change and some regions like Pamir and Karakoram even exhibit an overall increase in the snowfall frequency under RCP4.5.
To examine the regional differences of changes in snowfall days, the projected changes in light snowfall, moderate snowfall, large snowfall, and heavy snowfall events across two emissions scenarios were investigated (figure S6). In HMA, the frequency of light and moderate snowfall accounts for 73.2% of the total snowfall days. Thus, the changes in these two types of snowfall events can well explain the changes in snowfall frequency across the whole HMA. This is confirmed by the coincidence of the spatial structure of the changes in light snow and moderate snowfall with the spatial structure of total snowfall days. In other words, the projected increase in light and moderate events leads to an increase in snowfall days in western HMA, while declines in frequency in light snowfall and moderate events yield a negative contribution to the total snowfall days in eastern HMA. Interestingly, an increase in both large and heavy snowfall events was observed in eastern HMA but an overall decrease was observed in western HMA, except for Hissar Alay and Pamir. It should be pointed out that although the number of days for large and heavy snowfall accounts for only a small proportion of total snowfall days, it nonetheless has a significant impact on the economy and human life (Changnon and Changnon 2006).
5.4. Projected changes in snowfall fraction
A warming climate will cause more precipitation to fall as rain, resulting in a decline in the snowfall fraction. In HMA, relative to 1976–2005, MME decreases in the mean snowfall fraction for 2070–2099 are predicted to be −26.7% and −42.3% under RCP4.5 and RCP8.5 scenarios, respectively. Corresponding to the decrease in snowfall in East Tienshan, East Kun Lun, Qilian, Inner Tibet, South and Eastern Tibet and Hengduan, there is also a robust decline in snowfall fraction in those areas. Taking Qilian as an example, the snowfall fraction dropped by 83.0% and 91.8% under RCP4.5 and RCP8.5, respectively. Benefiting from the increase in snowfall, the snowfall fraction showed a slight decrease in Hissar Alay, Pamir, West Tienshan, Hindu kush, Karakoram, and West Kun Lun, ranging from −22.0% to 3.0% under RCP4.5 (figure S7).
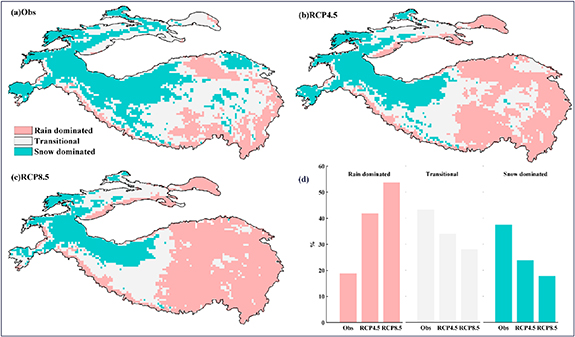
To better understand the impact of future warming on snowfall rates, we further defined areas as rain-dominated, transitional, and snow-dominated (figure 4), based on classification criteria in Littell et al (2018). Under historical records, regions characterized as either rain-dominated, transitional or snow-dominated account for about 19.0%, 43.4% and 37.6% of the entire HMA, respectively. Snow-dominated areas occupied most of northwest HMA, while rain-dominated areas are mainly located in the southeastern margin of HMA and the Qaidam Basin.
Figure 4. Distribution of rain-, transitional, and snow-dominated areas in HMA under historical (a) (1970–2005) and RCP4.5 (b) and RCP8.5 (c) (2070–2099) scenarios and their proportions (d) in each period.
Download figure:
Standard image High-resolution image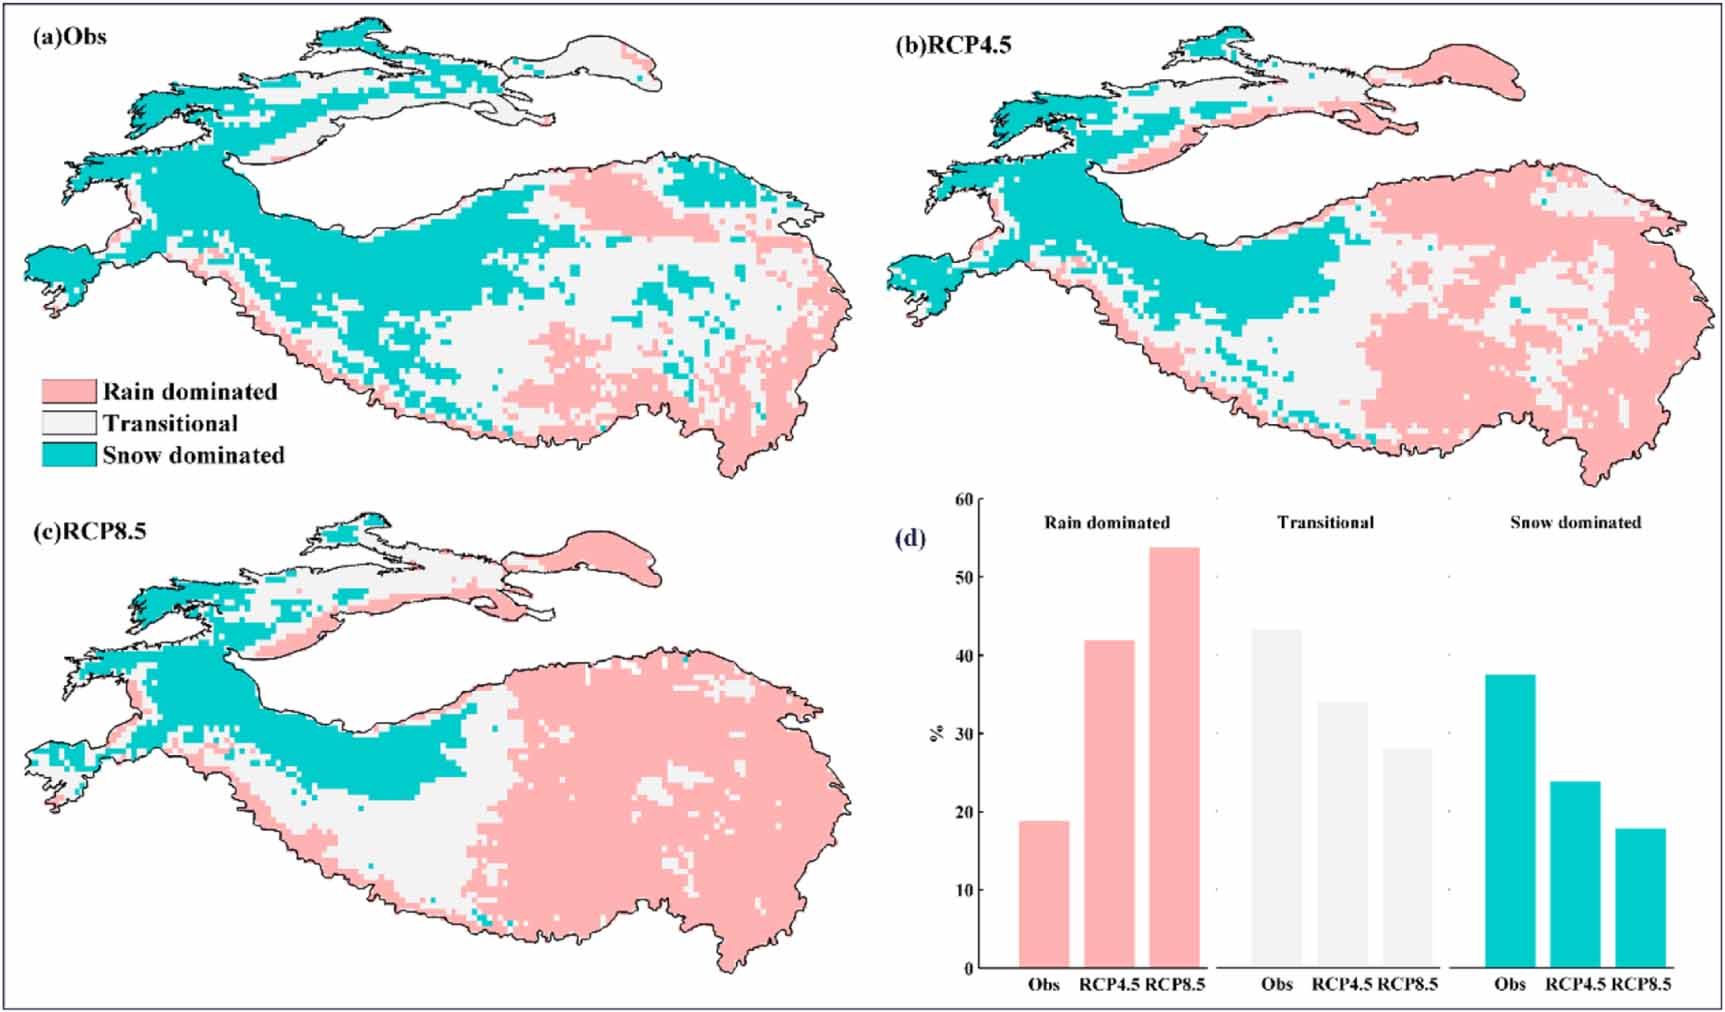
By the end of the century, snow-dominated areas are projected to drop to about 23.9% and 17.9%, whereas rain-dominated regions are expected expand to 42.0% and 53.9% under RCP4.5 and RCP8.5, respectively. Meanwhile, the transitional zones between rain and snow are shrinking and disappearing, indicating that large areas which are currently snow-dominated will become rain-dominated. In the future, the distribution of snow-dominated and precipitation-dominated areas will have distinct spatial distribution characteristics. Snow-dominant areas can only be observed in Pamir, Western Kunlun Mountains and the Karakoram, while rain-dominant areas occupy nearly all of eastern HMA.
6. Discussion
6.1. Comparisons with previous research
By the end of the present century, warmer temperatures in HMA resulting from anthropogenic climate change will reduce the fraction of precipitation that falls as snow, shorten snowfall duration, and decrease snowfall amounts. These projected changes are consistent with observed and simulated changes in snowfall in most parts of the world, including the western United States of America (USA), the Alps, Switzerland, and the Arctic (Feng and Hu 2007, Serquet et al 2011, Krasting et al 2013, Bintanja and Andry 2017, Frei et al 2018). For example, using daily outputs of temperature and precipitation downscaled for 20 CMIP5 models, Klos et al (2014) further pointed out that by mid-21st century, western USA is projected to see a 30% reduction in wintertime snow-dominated area. Within a similar time period, the snow-rain transitional zone in central and eastern USA will shift to the north at magnitudes of 2 °C–6 °C under future warming (Ning and Bradley 2015). Driven by the projected warming, snowfall in most parts of the Alps will also decrease by the end of the present century. Furthermore, with the expansion of areas dominated by rain, those dominated by snow are shrinking in HMA, as has also been reported in the Arctic. Bintanja and Andry (2017) found that precipitation will be predominantly rainfall by 2091–2100, and that only Greenland will at that time experience snowfall fractions over 80%.
Our results are comparable to those in the same region. For example, Zhou et al (2018) forecasted snow cover change in the Tibetan plateau, based on a regional climate model. Zhou et al (2018) indicated that, by the end of the 21st century, snow days will decrease and mean intensity will increase by 17.7% and 3.3%, respectively, in the Eastern Tibetan plateau. Further, the ensemble-projected decrease in light snowfall amount is 117.9%, while the decrease in the number of snowfall days is 18.4%. The authors also pointed out that the main reason for the decrease in snowfall days is the decrease in light snowfall events, and that the decline in snow days and snow water equivalent in the Tibetan Plateau is more pronounced than in other regions in China (Zhou et al 2018). Regional research on HMA also indicates that snowfall under a strong anthropogenic forcing scenario in the Himalayas would likely decrease by 30%–50% in the Indus River Basin, 50%–60% in the Ganges River Basin, and 50%–70% in the Brahmaputra Basin by 2071–2100 (Viste and Sorteberg 2015). However, it should be pointed out that snowfall is less sensitive to warming in the Karakoram than in the Himalayas, due to a unique seasonal cycle (Kapnick et al 2014), and that this phenomenon was also found in our study.
At the same time, some regional studies in HMA have begun to pay attention to the impact of these changes on snow metrics, which show a reduction in snow water equivalent, springtime snow cover, and snow depth (Chen et al 2016, Smith and Bookhagen 2018, Li et al 2019, Tang et al 2019). As the temperature continues to rise, the number of days <0 °C is expected to decrease, leading to an increase in rain frequency. Subsequently, total snowfall is expected to decrease as a result of a lower probability for precipitation to fall as snowfall. Moreover, simulated HMA warming exhibits a large seasonal cycle, with warming peaking in late autumn and winter, which is typically the snowfall season. Unlike monthly increases in rainfall, snow decreases in most months, especially in spring and early autumn, which causes the snowfall fraction to substantially diminish in the April, May, November and December (figure S8).
6.2. Attribution analysis
The projected snowfall showed a more robust decline in eastern HMA than in western HMA. This difference can be explained by climatology, orographic influence, and unique seasonal recycling.
Climatology. The annual mean temperature for our baseline period (1976–2005) in HMA indicated that annual mean temperature was much higher in eastern HMA compared to western HMA. For example, in eastern HMA (e.g. Qilian, Hengduan, and South and East Tibet), baseline annual mean temperatures exceeded 6 °C, while in Kun Lun, which is located in western HMA, the reported baseline annual mean temperatures were below −6 °C. A detailed analysis comparing baseline annual mean temperature and snowfall indicated that the projected declines in annual snowfall were most acute in climatologically warmer regions (figure S9). So, for example, from −6 °C to 6 °C, there was a snowfall decline of −41.2% to −54.9% for RCP4.5 and −55.0% to −74.1% for RCP8.5. Another unfavorable factor restraining snowfall increases in eastern HMA is that the projected temperature rise in this area is much faster than the rise in western HMA, which can be clearly seen in the temperature projection changes in figure S3. For example, under RCP4.5, the temperature in western Tienshan increased by 2.2 °C, while that in the Qilian Mountains rose by 3.4 °C. This means that in the future, the annual average temperature in most eastern HMA regions will be higher than the freezing point, preventing the increased precipitation from falling as snow.
Elevation Influence. Changes in snowfall are also projected to be strongly elevation-dependent. Overall, the altitude of western HMA is higher than that of eastern HMA. Numerous studies have shown that large decreases have been projected at lower elevations, with relatively little change or even increases at the highest elevations (Brown and Mote 2009, Wi et al 2012, Lute et al 2015, Deng et al 2017, Frei et al 2018). The sensitivity analysis of snowfall to altitude shows that although snowfall in low-lying areas in HMA could be reduced by more than −80% for RCP8.5, high-elevation regions could experience slight increases (figure S9). The main reason for the increased snowfall in high altitude areas is that the temperature is still below freezing point in the future, and also higher temperatures suggest greater atmospheric moisture entrainment.
Unique seasonal recycle. The unique seasonal circulation system results in a difference in snowfall change between eastern and western HMA. Eastern HMA is mainly affected by a monsoon climate, while western HMA is mainly affected by westerly circulation. We can take the Karakoram Mountains in western HMA as an example. Under the effect of low temperatures in winter, the westerly circulation provides ample water vapor for this region, which protects the Karakoram range from snowfall losses. However, this situation differs significantly from that in eastern HMA, where precipitation is affected by a monsoon climate that is mainly concentrated in the warm season and thus not conducive to snowfall increase. Previous studies confirm that glaciers in the Karakorum region have shown mass stability and even expansion (Bolch et al 2012), while the nearby Himalayas and Tibetan Plateau have observed glacial mass loss (Kang et al 2010). Simultaneously, a recent study conducted by Kapnick et al (2014) also found a much weaker sensitivity of snowfall to warming in the Karakoram than in the Himalayas due to a unique seasonal cycle (dominated by non-monsoonal winter precipitation).
6.3. Possible impacts
The hydrological impacts of these changes on snowfall indicators have so far been decreased spring snow and snowpack, flooding, and early snowmelt (Barnett et al 2005, Berghuijs et al 2014, Chen et al 2018, Li et al 2019). In HMA, more than one billion people depend directly or indirectly on water sourced from melting snow (Smith et al 2017). As a buffer, snow releases meltwater constantly over a longer period of time. Therefore, if there is more rainfall than snowfall in winter and early snowmelt in spring, the risks of winter and spring flooding and summer drought are elevated, thus further aggravating the contradiction between supply and demand of water in these areas.
In addition, if the current water availability level is to be maintained, any reduction in the natural storage of snow will increase the demand for reservoir capacity (Barnett et al 2005). Unless there is additional storage infrastructure, many parts of the region will face difficult choices between conflicting objectives such as hydropower, irrigation, navigation, and ecosystem support. This situation may amplify as snowfall continues to decrease, snowmelt occurs earlier in the year, and water demand increases.
Moreover, decreasing snowfall and snow cover in HMA could also influence the Asian summer monsoon and rainfall. Wu and Qian (2003) pointed out that, in Eastern and Southeastern Tibet, heavy snow years lead to a weakened Asian summer monsoon, with summer precipitation in South and Southeast Asia being less than normal. Therefore, understanding the changes in snowfall in HMA has important implications for water resources management far beyond the HMA region.
7. Conclusions
Based on the high-resolution downscaling NEX-GDDP dataset, this study evaluated and predicted changes in snowfall amount, snowfall days, and snowfall fraction in High Mountain Asia under RCP4.5 and RCP8.5 scenarios. The main conclusions are listed below.
- (a)Compared with observational data, NEX-GDDP accurately captured the spatial distribution of snowfall amount, snowfall days and snowfall fraction, showing the spatial correlation coefficient to be greater than 0.9. However, this approach gave a poor performance in describing extreme snowfall events.
- (b)Within the context of RCP4.5 and RCP8.5, snowfall in HMA will be reduced by 18.9% and 32.8%, respectively, snowfall days will be reduced by 29.6% and 47.3%, respectively, and snowfall fraction will be reduced by 26.7% and 42.3%, respectively. The areas with the most serious decrease are mainly in East Tienshan, Middle Tienshan and the northeast of the Tibetan Plateau, whereas in West Tienshan and the Karakorum Mountains, there will be either little decrease or even an increase in snowfall.
- (c)Decomposing the influence of temperature and precipitation on snowfall shows that temperature is the main driver in snowfall reduction. If precipitation remains unchanged in the future, the warming will lead to a 29.1% (RCP4.5) and 51.4% (RCP8.5) reduction in snowfall in HMA, respectively.
- (d)In HMA, light and moderate snowfall frequency accounts for 73.2% of total snowfall days. The increase in light and moderate snowfall in western HMA and the decrease in light and moderate snowfall in eastern HMA are the main reasons for the spatial differences in snowfall days between western and eastern HMA. However, in eastern HMA, there was an increase in large and heavy snowfall, while in western HMA, there was a decrease in same.
- (e)Currently, 19.0%, 43.4% and 37.6% of the the entire HMA region is dominated by rain, transitional precipitation, and snow. By the end of this century, however, under RCP4.5 and RCP8.5, snow-dominated areas are expected to decline to about 23.9% and 17.9%, respectively, while rain-dominated areas are predicted to expand to 42.0% and 53.9%, respectively. The snow-dominated areas are mainly distributed in western HMA such as the Pamirs, the West Kunlun Mountains and the Karakoram Mountains, while the entire eastern HMA is mostly rain-dominated. Spatially, the decrease in snowfall in eastern HMA is significantly greater than that in western HMA. This phenomenon can be attributed to climatology, elevation influences, and the unique seasonal recycle between the two regions.
Acknowledgments
This research was supported by the National Natural Science Foundation of China (41971141, U1903208, 41630859). The authors gratefully acknowledge the Youth Innovation Promotion Association of the Chinese Academy of Sciences (No. 2018480). Data from the observation stations were obtained from the China Meteorological Data Sharing Service (http://www.cma.gov.cn/). NEX-GDDP can be downloaded from its official website (https://dataserver.nccs.nasa.gov/thredds/catalog/bypass/NEX-GDDP/bcsd/catalog.html). The gridded temperature and precipitation data came from a land surface hydrological model simulation (http://hydrology.princeton.edu/data/pgf/v1/0.25deg/daily/).
Data availability statement
The data that support the findings of this study are available upon reasonable request from the authors.