

Abstract
Long-lived capital-stocks (LLCS) such as infrastructure and buildings have significant and long-lasting implications for greenhouse gas emissions. They contribute to carbon lock-in and may hinder a rapid decarbonization of energy systems. Here we provide a systematic map of the literature on carbon lock-in induced by LLCS. Based on a structured search of the Web of Science and Scopus, we identified 226 publications from 38 095 search results using a supervised machine learning approach. We show biases toward power generation and toward developed countries. We also identify 11 indicators used to quantify carbon lock-in. Quantifications of committed emissions (cumulative emissions that would occur over the remaining operational lifetime of an asset) or stranded assets (premature retirement/retrofitting or under-utilization of assets along a given pathway) are the most commonly used metrics, whereas institutional indicators are scarcely represented. The synthesis of quantifications shows that (i) global committed emissions have slightly increased over time, (ii) coal power plants are a major source of committed emissions and are exposed to risk of becoming stranded, (iii) delayed mitigation action increases stranded assets and (iv) sectoral distribution and amount of stranded assets differ between countries. A thematic analysis of policy implications highlights the need to assure stability and legitimacy of climate policies and to enable coordination between stakeholders. Carbon pricing is one of the most cited policy instrument, but the literature emphasizes that it should not be the only instrument used and should instead be complemented with other policy instruments, such as technical regulations and financial support for low carbon capital deployment. Further research is warranted on urban-scale, in developing countries and outside the electricity generation sector, notably on buildings, where stranded assets could be high.
Export citation and abstract BibTeX RIS

Original content from this work may be used under the terms of the Creative Commons Attribution 3.0 license. Any further distribution of this work must maintain attribution to the author(s) and the title of the work, journal citation and DOI.
Corrections were made to this article on 22 July 2021. The references were corrected.
1. Introduction
The objective of the Paris Agreement on climate change to 'hold the increase in the global average temperature to well below 2°C above pre-industrial levels' requires reaching net zero emissions globally during the second half of the 21st century. This implies a fast reduction of global emissions in the next decades (Rogelj et al 2018) and one pillar of this transition is a rapid replacement of polluting capital by clean capital (Rozenberg et al 2020). Polluting capital is that whose use directly emits CO2, such as fossil fuel power plants and internal combustion engine vehicles, but also capital that indirectly induces emissions, such as building shells, roads and urban forms because of their influence on energy demand and mitigation possibilities (Guivarch and Hallegatte 2011).
Most of the capital concerned by this transition can be qualified as 'long-lived capital stock' (LLCS), which has specific characteristics that may hinder rapid transitions (Lecocq and Shalizi 2014). First, by definition LLCS has long life spans, from around 15 years for personal vehicles to more than 50 years for buildings (Reyna and Chester 2015, Erickson et al 2015), and to centuries if not millennia in the case of road networks (De Benedictis et al 2018). A second key characteristic of LLCS is the lumpiness of capacity installation (Lecocq and Shalizi 2014). While lock-in builds on the long life spans of infrastructure and capital stocks, lumpiness refers to the concentration in a short period of time of investments in specific capital stocks or infrastructure. Examples are railroads in the 19th century, nuclear power plants between 1960 and 1990, and (Chinese) high-speed railways since 2008. This lumpiness leaves a short window of opportunity to influence the capital stock characteristics and whether it locks in high carbon patterns or not.
Moreover, the dynamics of LLCS are driven by path-dependent evolution induced by four intertwined and mutually reinforcing mechanisms: scale economies, learning effects, network economies and adaptive expectations (Arthur 1994, Unruh 2000). Scale economies refer to reduced unit production costs over time due to the spread of fixed costs over increasing production volume (Kalkuhl et al 2012, Klitkou et al 2015). Learning effects describe how knowledge accumulation from a technology results in decreasing costs over time. This has been observed for power generation plants in the past (McDonald and Schrattenholzer, 2001), with higher learning rates for more granular technologies, such as photovoltaics (Creutzig et al 2017, Nemet 2019, Wilson et al 2020), and lower if not zero (or even negative) learning rates for large-scale technologies, such as nuclear (Grubler 2010). Network economies result from the advantages of using a technology with wider adoption because of coordination effects between industries or through regulations and norms. For example, a road portion increases in value as the network expands because of new possible destinations (Unruh 2000). Adaptive expectations are due to the adoption of a technology reducing uncertainty, and hence increasing confidence in using this technology. This mechanism shapes preferences and cultural norms such as habits for travel behaviors (Lanzini and Khan 2017).
LLCS therefore induces inertia that prevents or delays transitions towards low-carbon systems, a phenomenon called carbon lock-in (Unruh 2000). The capital built today will influence the paths of future emissions for several decades. The transition to low-carbon capital can therefore only be made by taking into account the existing stock and its economic and technological characteristics. LLCS is also embedded in broader institutional context that can keep promoting the high-carbon capital in place or create the conditions for the emergence of an alternative low-carbon technology (Seto et al 2016).
It is therefore essential to understand to what extent this existing stock of long-lived capital and its expected evolution is compatible, or not, with long-term climate objectives, and to identify levers available to make this stock 'climate compatible'. A certain level of lock-in associated with existing carbon-intensive capital is inevitable but its depth can be problematic and hinder a low carbon transition (Bjornaavold and Van Passel, 2017). This raises the questions of how to quantify carbon lock-in and how its 'strength' differs between sectors or geographical areas. Answering these questions is a crucial condition for policies and decisions which avoid creating or exacerbating carbon lock-in. This article contributes to this by reviewing the literature about carbon lock-in related to long-lived capital stock. Our goal is to describe the current state of knowledge, and to show what evidence there is of the (in)compatibility of the existing LLCS and its expected evolution with the long term climate objectives. Specifically, we aim to (i) highlight what sectors and geographic areas have been studied, and where there are research gaps, (ii) identify how carbon lock-in has been quantified in the literature and what findings emerge from it, and (iii) analyze the policy implications of carbon lock-in avoidance or escape.
In a previous traditional literature review, Seto et al (2016) synthesized the causes and types of carbon lock-in. Authors conceptualized three major types: '(a) lock-in associated with the technologies and infrastructure that indirectly or directly emit CO2 and shape the energy supply; (b) lock-in associated with governance, institutions, and decision making that affect energy-related production and consumption, thereby shaping energy supply and demand; and (c) lock-in related to behaviors, habits, and norms associated with the demand for energy-related goods and services'. This review also identified conditions which reinforce carbon lock-in and some strategies for escaping it. However, to our knowledge, no study to date has comprehensively synthesized case studies and associated results on carbon lock-in. The rapid expansion of the scientific literature on the topic (Cui et al 2019) calls for scalable methods to deal with large numbers of articles (Tsafnat et al 2014, Minx et al 2017, Beller et al 2018, Westgate et al 2018, Nakagawa et al 2019, Callaghan et al 2020).
Our article hence complements the review by Seto et al (2016) by providing a systematic map of the literature about carbon lock-in. We collected, described and catalogued the available literature based on a systematic review methodology (James et al 2016). The screening process was streamlined using a machine learning approach (O'Mara-Eves et al 2015, Lamb et al 2019). We map out the distribution of existing studies across sectors, geographic areas and spatial scales and identify mature areas of research as well as research gaps. We further describe the different methodologies and indicators used to quantify carbon lock-in and provide a synthesis of those estimates. In particular, we analyze how evaluations of global stranded assets depend on the temperature objective of the scenarios and on whether action in scenarios is early or delayed. We study how global committed emissions evaluations have evolved over time, and also provide a comparison of the results for our indicators between sectors and geographical areas. Finally, we offer a synthesis of existing qualitative statements in the publications about policies to escape or avoid carbon lock-in. The rest of this article is structured as follows : section 2 details our methodology, section 3 presents and discusses our results and section 4 concludes.
2. Methodology
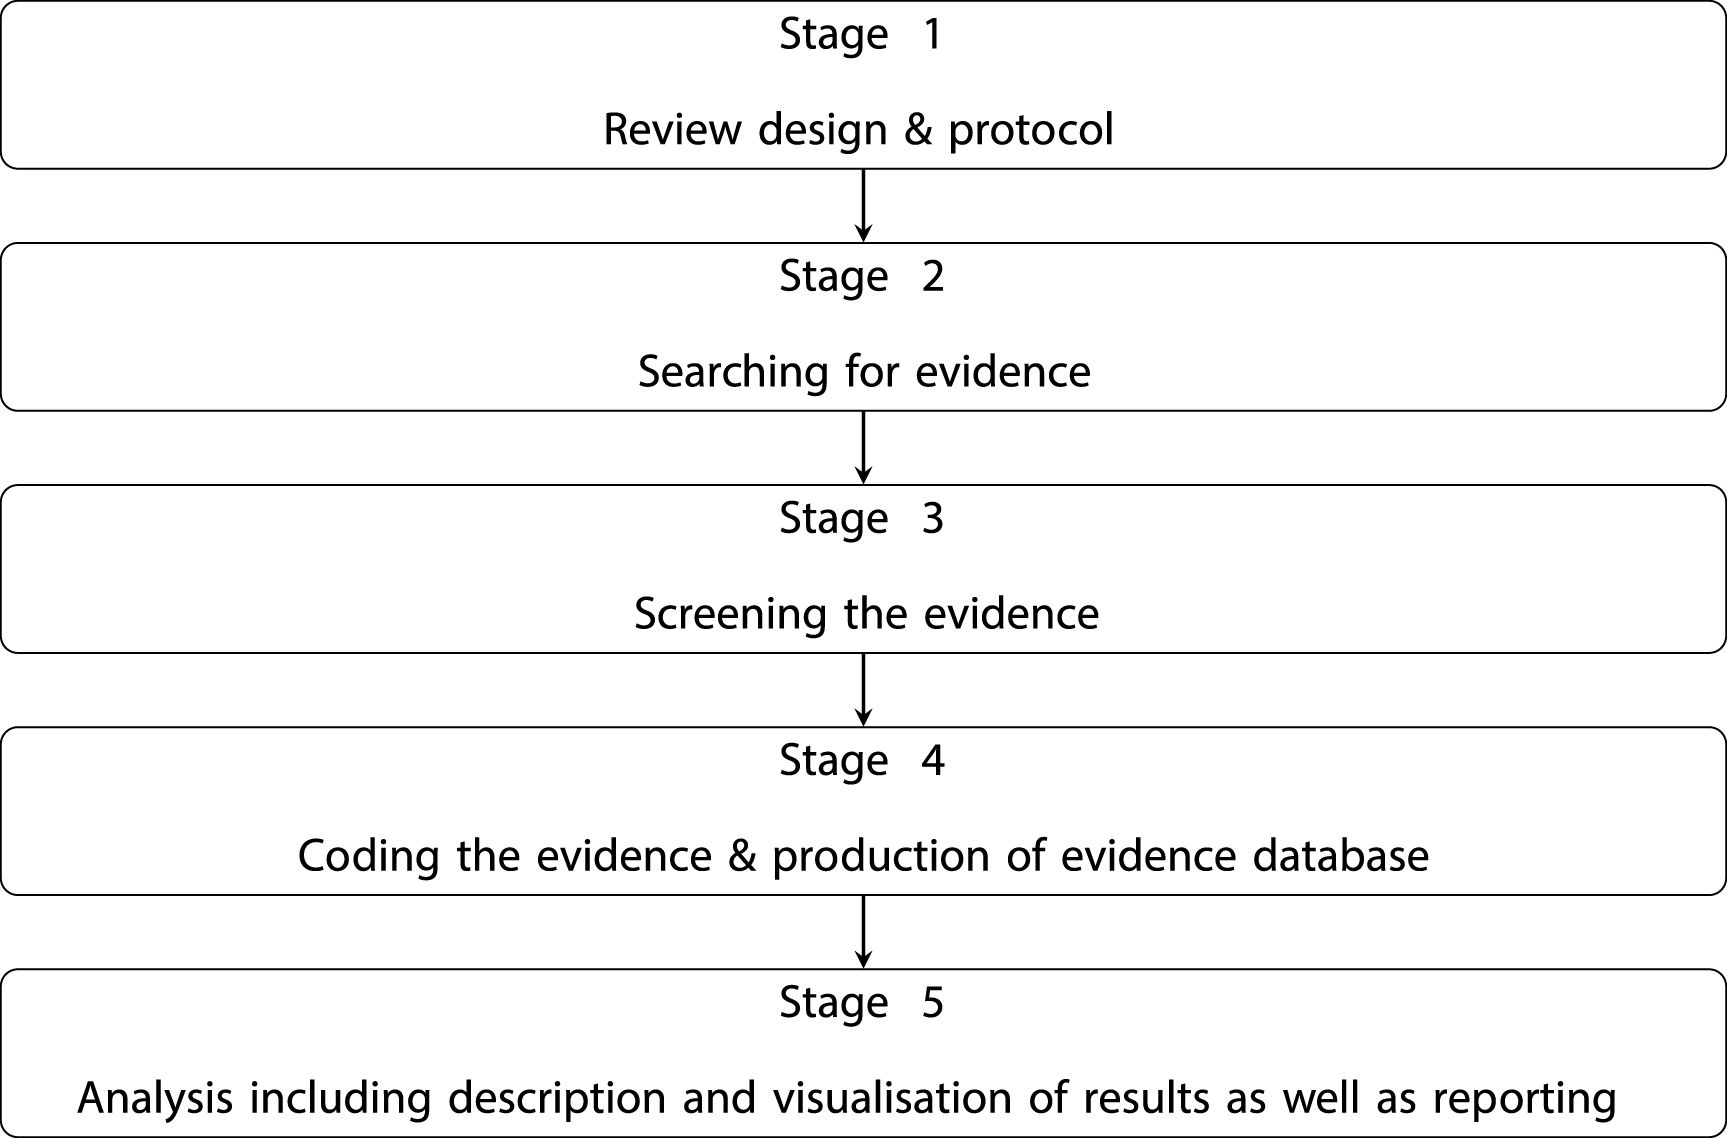
We apply systematic mapping and subsequent synthesis to understand what the evidence is of the (in)compatibility of the existing LLCS and its expected evolution with the long term climate objectives. Systematic mapping (Haddaway et al 2016, James et al 2016), and evidence gap mapping (McKinnon et al 2015, Snilstveit et al 2016), have their roots in the social sciences (Oakley et al 2005, Bates et al 2007). Systematic maps provide an open-framed inquiry related to the state-of-evidence in a particular field by systematically collating, describing and cataloging the relevant evidence (James et al 2016). Like other evidence synthesis methods, systematic mapping approaches provide formal procedures that aim to minimize different sources of bias during the review process and promote a comprehensive, rigorous, transparent and objective overview of the available evidence. We describe in detail the process of constructing and analyzing our systematic map of the literature on carbon lock-in across five discrete methodological stages (see figure 1) and subsequent synthesis below. We close this section by describing our approach to the thematic analysis of policy implications identified in the various papers.

Figure 1. Systematic mapping procedure (James et al 2016).
Download figure:
Standard image High-resolution image2.1. Steps 1 and 2 - Review design, scope and search query
To operationalise our review question, we scope our review in the following way: we consider long-lived capital across three categories identified by Seto et al (2016), namely (i) carbon-emitting infrastructure, such as power plants and vehicles, (ii) carbon emissions-supporting infrastructure, such as fossil fuel distribution network, and (iii) energy-demanding infrastructure, such as building shells, roads and urban forms. Our focus is on studies that analyse the capital built to extract, transport and transform the fossil fuel resources, but not fossil fuels themselves - even though these can contribute to lock-in as well. We also limit the scope of our inquiry to articles that explicitly study carbon lock-in, and not only lock-in of a specific technology with no consideration of the greenhouse gases emissions implication of the technology use. From the three types of carbon lock-in conceptualized by Seto et al (2016) - namely (a) technological and infrastructural, (b) institutional and (c) behavioral - we limited our analysis only on the first two. Behavioural lock-in is a much less mature scientific concept and would require a lot more groundwork before starting any synthesis that would mainly rest on highly disciplinary evidence from sociology, behavioural economics or psychology (Beretti et al 2013, Stoknes 2014). This is beyond what can be provided here. So we leave it to a dedicated future effort that would need to involve additional scientific expertise.
We constructed a transparent keyword-based query and search both the Web of Science (WOS) and Scopus. Our search string consists of synonyms related to climate change, LLCS and lock-in. The keywords were initially chosen on the basis of the authors experience. We then developed and tested a series of alternative search strings against a sample of 30 key articles available on WOS compiled a priori by the authors (see the test list in Supplementary Material 1 (stacks.iop.org/ERL/16/053004/mmedia)). We selected the search string presented in table 1, which could retrieve 29 of the 30 articles (notably the one article was only not retrieved because the associated abstract was not available on WOS). In this query we included the generic keywords 'scenario', 'pathway' and 'integrated assessment' in the LLCS and lock-in keywords category to also include articles using integrated assessment model and/or climate change mitigation scenarios. Some articles from this literature have addressed carbon lock-in induced by LLCS among other topics without necessarily mentioning related keywords explicitly in the abstract (see for instance Creutzig et al (2016) or Luderer et al (2018)). To limit the number of results obtained, we also included keywords combined with the Boolean NOT to exclude articles about forest and agriculture because they do not fit the definition of LLCS we used. Overall, our query yielded an initial total of 34 002 unique publications on WOS and Scopus in June 2019. We chose this rather extensive search string over more focused alternatives for matters of comprehensiveness and given the availability of a machine learning pipeline for streamlined evidence screening and selection (see below).
Table 1. Description of search query.
| Climate keywords | LLCS keywords | Lock-in keywords |
|---|---|---|
| ((carbon NEAR/3 (emission* OR budget)) OR (CO2 NEAR/3 (emission* OR budget)) OR decarboni*ation OR (degree* NEAR/3 ("1.5" OR "2")) OR (climat* NEAR/3 (mitig* OR policy OR policies OR goal)) OR (energy NEAR/2 (consum* OR use))) | (infrastructure* OR transport* OR fossil OR industry OR electricity OR shipping OR building* OR gas* OR coal* OR power OR "built environment" OR "building stock*" OR urban* OR cities OR city OR "integrated assessment") | (lock* OR "stranded" OR retirement OR divest* OR "inertia" OR "path dependen*" OR "pathway*" OR "scenario*" OR "earlier" OR "early" OR (commit* NEAR/3 (emission* OR CO2))) |
| Keywords for exclusion : (*forest* OR agric* OR agro*) | ||
Although the search string is extensive, we recognize several shortcomings of our search strategy. First, we focused on English publications only, but recognise the existence of relevant articles on carbon lock-in in other languages. Second, we focused on the two bibliographic databases WoS and Scopus, but these do not cover the entire academic literature and miss grey literature entirely. To partially compensate for the second and third points, additional documents were identified by 'snowballing' (Sayers 2007) - extracting references from relevant publications on carbon lock-in including grey literature. Overall, whilst not being fully exhaustive, we feel that our approach provides an extensive view of the available literature.
2.2. Step 3 - screening and selecting the evidence
A growing challenge for rigorous evidence synthesis methodologies is that many search strings return tens of thousands of results - particularly in an open-framed context like systematic mapping. Here, the selected search string returned a total of 34,002 publications in June 2019 after deleting duplicates. Available guidelines for systematic evidence mapping (Snilstveit et al 2016, Collaboration for Environmental Evidence. 2018, Saran and White 2018) require the comprehensive screening of all search results - ideally by two independent screeners. It is our observation that due to the rapid expansion of scientific literature, authors tend to artificially restrict their search queries in order to keep the number of articles for screening manageable, even though this may substantially limit the analysis.
An alternative way to approach this is to relax the stringency of screening in exchange for building a comprehensive search query that yields a number of search results greater than that which can be screened by hand. Machine learning can be used to assist the screening and selecting articles by training an algorithm with the screening decisions made by humans (O'Mara-Eves et al 2015, Westgate et al 2018, Lamb et al 2019, Nakagawa et al 2019). Only the subset of remaining articles predicted to be most likely to be relevant are then screened manually. We set out the screening process we followed in detail below, and summarise in figure 2.

Figure 2. Screening process.
Download figure:
Standard image High-resolution imageFirst, to ensure screening consistency between reviewers and a common understanding of inclusion/exclusion criteria, four authors screened the same set of 100 articles independently at the beginning of the process. The screening results were compared and reviewers jointly discussed consistency in the light of inclusion/exclusion criteria (table 2).
Table 2. Inclusion/Exclusion criteria.
| Include/Exclude | Reason |
|---|---|
| Include | Publication using scenarios in the energy demand or supply sectors must include keywords related to carbon lock-in, investments dynamic or stock renewal in the abstract |
| Exclude | Publications only focusing on lock-in but not related to climate change mitigation or GHG emissions induced by long-lived capital |
| Exclude | Publications only about carbon lock-in induced by fossil fuels themselves or natural resources |
| Exclude | Publications only analysing behavioural carbon lock-in |
After the consistency check, the reviewers screened a further 508 records independently, resulting in an initial random sample of 608 documents. We added 41 articles identified a priori as pertinent for our topic in order to provide more 'relevant' labels in our training dataset. These articles were extracted from the test list we built and from the references list of Erickson (2015) and Seto et al (2016). We justify the choice of these two articles by the fact they are highly cited and fit our topic perfectly through their analysis of different types of carbon lock-in in different sectors.
We then started an iterative process where at each iteration, we 1) trained a machine learning model to predict the relevance of a document given its title and abstract; 2) predicted the relevance of the unseen documents; and 3) assigned the next set of documents to be screened by the authors by selecting the documents predicted to be most relevant. We went through three iterations of machine learning prioritized screening and each had decreasing proportions of relevant documents in the set of screened articles. In the first iteration of 494 documents, 35% of records were relevant. In the last iteration of 300 documents, only 5% documents were relevant, suggesting that the returns to additional screening would be small.
We then added 4,093 further documents by repeating the queries in February 2020, and by searching for documents citing the article on lock-in by Unruh (2000). We screened the 97 documents predicted most likely to be relevant from these additional documents, finding a further 28 relevant documents.
We performed full text screening on the 335 documents included during the screening process. Only articles with full text available and in English were kept. 184 of these articles were kept, to which we added 6 further documents identified manually and 36 documents identified through the aforementioned snowballing procedure. A total of 226 documents were finally included for our map and review.
2.3. Step 4: coding the evidence and production of evidence database
We developed a codebook (included as Supplementary material 3 to this article) for systematic extraction of information. In our codebook we reported results for each study in rows. We define a study as an instance where geographical and/or sectoral carbon lock-in is reported (either qualitatively or quantitatively). Overall, we found a total of 431 studies across the 226 included publications. For each study we extracted the meta-data (Authors, Title, Date, DOI) of the corresponding publication. We further recorded qualitative data on the study context such as the scale of analysis, the geographic areas and the sectors studied. For each quantification of carbon lock-in, we also extracted the numerical indicators related to carbon lock-in and their corresponding values. Overall, we found 286 quantifications of carbon lock-in from 92 publications. A common table with limited choices was constructed in order to ensure consistent information extraction between the authors.
2.4. Thematic analysis of qualitative statements
We used thematic synthesis to systematically analyse policy implications and options for avoiding carbon lock-in mentioned in our final sample of studies. Widely used in psychology, thematic synthesis is a method for identifying, analysing and highlighting themes within qualitative studies (Braun and Clarke 2006). It also enables a tractable and easily updatable synthesis of extracted statements (Thomas and Harden 2008, Hilaire et al 2019). Thematic synthesis allows us to identify a list of possible policy interventions for avoiding carbon lock-in and characterize the appropriateness of these interventions and the factors influencing their implementation.
Overall, we manually extracted 136 qualitative statements (QS) on policy implications from abstract, conclusion or discussion sections of our final set of articles, assuming that most of the statements on policy implications would be in these sections. To be included, QS had to explicitly refer to policy action or instruments to escape or avoid carbon lock-in. We classified QS into broad groups of policy instruments, following Goulder and Parry (2008), namely: incentive-based instruments, regulatory instruments, technology policies and others. QS from the 'others' category were then reassessed to highlight the most frequently mentioned specific features associated with these policies to avoid or escape carbon lock-in.
3. Results
3.1. Literature mapping
We first analyzed the literature distribution across sectors, geographic areas studied, and scales of analysis. We find that carbon lock-in has been mainly analyzed in the electricity generation sector (figure 3(a)) with 98 related publications representing 43% of our sample. Publications remaining at an aggregated sectoral level or analyzing carbon lock-in in a generic way also account for a significant portion of our sample with 66 publications representing 29 % of our sample. Conversely, the industry and fossil fuel production & distribution sectors have been little studied with, respectively, 13 and 14 related articles representing a combined 11% of our sample. This focus on the power sector can be explained by its large contribution to annual global CO2 emissions, representing between 30 and 40% of total emissions from 2005 to 2018 (Crippa et al 2019). However, while in the electricity sector the observed operational lifetimes of capital vary between 30 and 60 years (Rode et al 2017), capital in other sectors such as buildings, fossil fuels extraction facilities, or urban form can remain in place longer and could present a larger potential source of long-term carbon lock-in (Reyna and Chester 2015, Bos and Gupta 2018). Moreover, the shares of global emissions in sectors other than power generation will tend to increase in the coming decades due to the faster decarbonisation of the power sector (Méjean et al 2019) and the harder-to-mitigate emissions in sectors such as aviation or industry (Davis et al 2018).

Figure 3. Literature distribution between sectors (a) and scales (b) of the analysis. A publication with multiple studies about several sectors is counted in each corresponding category. The scale corresponds to the territorial level concerned by the analysis, which may differ from the geographical unit which is the disaggregation level used for quantification. For instance an estimation of carbon lock-in at the global scale with results disaggregated by countries is considered here in the global scale category.
Download figure:
Standard image High-resolution imageCarbon lock-in has been studied at different scales, from subnational to global, but unevenly in the literature (figure 3(b)). Global/Generic and national scales represent the majority of existing publications with, respectively, 46% and 33% of our sample. There are on the other hand only 16 publications in our sample analyzing carbon lock-in on a multi-country scale, 8 of which are related to the European Union. These low numbers are partially compensated by the fact that several quantitative studies at the global level also include results for different world regions, such as Johnson et al (2015). 32 publications, or 14% of our sample, specifically analyzed the subnational scale. As for the multi-country scale, some analyses at the national scale also include specific results at lower scale, such as Jiang et al (2017) at the Chinese provinces level. Urban settlements account for nearly 70% of today's global carbon emissions (Acuto and Parnell 2016) and subnational mitigation policies are specific and differ from larger scale policies (Creutzig et al 2015). Carbon lock-in is also a 'fractal trap' in the sense that its occurrences at different scales tend to reinforce each other (Bernstein and Hoffmann, 2019). This calls for a greater emphasis on the regional and city scales for future research.
To analyse the geographical distribution of the literature, we used two different indicators: 1) the number of publications related to a country or a world region (independent of the scale of analysis; e.g. an article focusing on a particular city in a country was counted as related to that country); and 2) the number of different sectors analysed per country/world region. The chosen sectors are the same as those presented on figure 3.
The literature has investigated 45 countries, but with uneven focus (figure 4(a)). China and the United States are the most studied countries, with 29 and 27 publications, respectively, covering 5 sectors (figure 4(b)). The UK has been widely studied as well with 19 publications covering 4 different sectors. In contrast, 13 countries have been analyzed by only 1 publication each. More than 9 publications are related to Australia, Germany and India, but for only 3 sectors each. Even if publications are more numerous for those countries compared to others, future studies on the missing sectors would be relevant. 26 publications provide carbon lock-in analysis for world regions. A large part of this sub sample (17 articles) is about the European Union, which makes sense because it is the only world region studied that forms a political union with climate policies formulated at this level.

Figure 4. Geographical distribution of the literature by numbers of publications (a) and numbers of sectors analyzed (b). The maps present the results for countries analyzed, with all scales of analysis combined. For instance publications focusing on a particular city in a country are counted as related to that country. The bar plots show the geographical distribution among world regions of publications with global or multi-country scales of analysis. The codes for world regions are given in the Supplementary Material 1 table 1.
Download figure:
Standard image High-resolution imageOur results reveal a literature bias towards developed countries. That can be seen in the aggregated number of publications associated with five world-regions (IPCC categories): Developed Countries, Asia & Developing Pacific, Africa & Middle East, Latin America & Caribbean and Eastern Europe & West-Central Asia (regional definitions are presented in the Supplementary Material 2). 92 publications are associated with Developed Countries, 38 with Asia & developing Pacific, 10 with Africa & Middle East, 10 in Latin America & Caribbean and 8 in Eastern Europe and West-Central Asia. Even though developing countries (excluding China and India) are not major contributors to global CO2 emissions at the moment, they may contribute to a high proportion of future emissions growth, which calls for more research in these countries. Among the Developed Countries publications, some countries are over-represented compared to their contribution to global emissions, particularly the United Kingdom of Great Britain and Northern Ireland, but also to a lesser extent Germany, Sweden and Australia (figure 5). Russian Federation contributes significantly to global CO2 emissions but has been proportionally less studied, with only 5 publications. Although China has been the most studied country, the share of associated publications is still lower than its share of emissions in 2018 (figure 5).

Figure 5. Shares of publications against shares of 2018 CO2 emissions for each country. The black line corresponds to the points where the share of publications equals the share of CO2 emissions. Data used for CO2 emissions come from Crippa et al (2019).
Download figure:
Standard image High-resolution image3.2. Review of carbon lock-in quantifications
3.2.1. Carbon lock-in indicators
In our analysis of the literature, we find 92 publications that contain 286 quantitative estimations of carbon lock-in. We sort them according to geographical scope (subnational, national, multicountry, and global), and sector (electricity, building, spatial planning, transport vehicles, fossil fuel production, industry).
The electricity sector has received the most quantifications, with 170 estimations in 60 publications, which represents 65 % of the subsample of quantitative studies. This result is valid as well for all geographic levels, except for cities (figure 6 and Supplementary Material 1 figure 1). On the other hand, publications containing quantifications for transport vehicles and spatial planning represent each less than 10% of the quantitative studies. Few quantifications (3) for cities have been done compared to other geographical units. More city case studies would be needed to quantify the impact of different policies on CO2 emissions in the long term and give insights for local planning choices.

Figure 6. Distribution of carbon lock-in quantifications by geographical unit, sector studied and indicator used. The numbers in each color bar give the number of publications for the corresponding geographical unit, sector and indicator combination. Note that a publication can contain multiple quantifications.
Download figure:
Standard image High-resolution imageWe identified 11 indicators used in the literature (table 3). These have been applied for different time frames of analysis that can be classified as backward-looking, static for a given year, or forward-looking using scenarios. Backward-looking analyses study periods in the past over a certain time frame. Static analyses provide a snapshot at a given year, often just a few years before the date of publication of the study, corresponding to the latest year for which data is available. Forward-looking analyses construct scenarios of future evolutions and analyze those trajectories. Few articles (7) have carried out quantitative retrospective analyses on carbon lock-in compared to static (30) or prospective (63) analyses. In the next paragraph, we describe each of the different indicators used and summarize the common trends in results where publications numbers are sufficient.
Table 3. Indicators used in the literature by time frame of analysis. The number of publications is indicated in each cell.
| Indicator | Time frame | ||
|---|---|---|---|
| Backward | Static | Forward | |
| Installed capacity | 2 | 4 | |
| Age of existing stock | 4 | ||
| Committed emissions | 5 | 13 | 8 |
| Capital costs intensity | 1 | 1 | |
| Stranded assets | 5 | 31 | |
| Mitigation costs | 1 | 10 | |
| Emissions/Energy gap | 12 | ||
| Residual emissions | 2 | ||
| Elasticity related to LLCS variables | 3 | 1 | |
| Technology scale | 1 | 2 | 2 |
| Employment | 2 | ||
Studies have focused on the evolution of installed capacity, corresponding for example to the electricity output for a power plant or the traffic volume for a road. Installed capacity, as projected over time, is used as a measure of carbon lock-in in the electricity generation and fossil fuel production & distribution sectors. Articles have highlighted the risk of a rapid increase in high-carbon installed capacity by 2030 if climate policies are further delayed (Bertram et al 2015, Turhan et al 2016, Kefford et al 2018, McGlade et al 2018). However, these studies could potentially overestimate the carbon lock-in induced by LLCS evolution by not considering low carbon retrofitting such as carbon capture and storage integration for power plants. This is shown by Li et al (2011) which quantified in a static manner the share of power generation capacity existing at a given year in China that could be retrofitted with carbon capture and storage.
Other studies have quantified carbon lock-in in relation to the lifetime of the capital considered. Some authors have referred to the age of the existing infrastructure stock, analyzing either its distribution or its average value. The younger the stock, the lower the probability to replace this capital in the short term. This indicator has been used mainly in the electricity generation sector (figure 6). The global age distribution tends to be bimodal between OECD and non OECD countries. For instance, in China a large part of industrial and electricity sector capital is younger than 10 years (Lane et al 2016, Zheng et al 2018) whereas in the EU and the US an important part of electricity generation capital is more than 30 years old. (Lane et al 2016, Rode et al 2017).
The concept of committed emissions has also been used to quantify the cumulative emissions that would occur over the remaining entire operation lifetime of an asset (Davis et al 2010). This indicator has been mainly applied in static and forward-looking frameworks (table 3). Past committed emissions over a given a period have also been analysed, but to a lesser extent (Davis and Socolow 2014, Jiang et al 2017, Pfeiffer et al 2018, Tong et al 2019). In a static framework, the committed emissions calculated can be compared with carbon-budgets associated with a temperature target to quantify the potential (in)consistency of the existing stock with the temperature goal. Whereas most of the indicators have been used for one or two time frames, committed emissions have been used for backward-looking, static and forward-looking analyses.
The operational life of infrastructure does not only depend on its age. Indeed, any infrastructure project is based on an investment plan with an expected long-term profitability. A change in the regulatory and economic context (for example the implementation of a carbon tax) can thus modify the operational costs, rendering the continued use of an infrastructure uneconomical. This is why other indicators also include economic aspects to quantify carbon lock-in. Two publications have quantified the capital costs intensity as the level of capital investment required for extraction or production of given unit (Shackley and Thompson 2012, Erickson 2015). The assumption behind this is that the more capital-intensive an investment, the more it may be isolated from price fluctuations and hence the more operators will be likely to keep using this capital.
In the same manner, carbon lock-in literature has made extensive use of the stranded assets indicator. It is defined as the premature retirement/retrofitting or under-utilization of existing assets in relation to a potential reference capital (Saygin et al 2019). This indicator measures the implications - the assets lost-if the carbon lock-in is to be escaped from. Stranded assets can be either the stranded investments or the stranded profits depending on the reference lifetime chosen. Indeed, the reference lifetime considered can be the 'physical' one over which the capital can be used or the 'economic' one over which capital investment costs are recovered. Making this distinction is important because it can have significant impact on the results obtained as the difference between these two lifetimes can be of several decades (Kefford et al 2018). The majority of existing estimations are about the electricity generation and fossil fuel production & distribution sectors (figure 6). Two distinct methodologies have been used. For the first one, some authors have used the age distribution of the existing stock for a given year based on unit-level assessments to project its evolution, assuming all capital stock is used until the end of its potential lifetime. This evolution is then compared (i) either in a static manner to the capital stock targeted for a future year (Pfeiffer et al 2016, Farfan and Breyer 2017a,b) (ii) or with a forward looking approach to the capital stock evolution extracted from a low-carbon scenario (CTI 2014a,b, Lane et al 2016, Kefford et al 2018, Cui et al 2019, Saygin et al 2019). The second approach is to quantify the stranded assets using models with an endogenous evolution of capital stock (Mercure et al 2014, Iyer et al 2015, Johnson et al 2015, Luderer et al 2016, van Soest et al 2017, Coulomb et al 2019). In this case, capital can be retired early because new economic conditions make its use unprofitable. Results obtained are expressed either in terms of electricity capacity/production retired or in monetary terms to quantify the loss of expected revenue. Given the numerous quantifications for these two indicators - committed emissions and stranded assets - the synthesis of the results is presented in the section 3.2.2 below.
Mitigation costs is also an indicator which has been used to quantify the transition costs induced by the inertia of long-lived capital. It represents the potential macroeconomic costs associated with the transition to a low-carbon system for different levels of short-term climate policy ambition. Mitigation costs have been quantified as the variation of an economic indicator between a 'reference' scenario (either with no mitigation policies or with current policies only) and a mitigation scenario or a scenario considered as 'optimal' to reach a long term temperature target. It is an indicator widely used in the integrated assessment literature to compare the macroeconomic costs of different scenarios. We extracted only the studies using specifically this indicator to quantify carbon lock-in. The economic variables chosen to represent the mitigation costs have been GDP losses (Ha-Duong et al 1997, Richels et al 2009, Waisman et al 2012, Lucas et al 2013, Riahi et al 2015, Luderer et al 2016) or consumption losses (Lecocq et al 1998, Kalkuhl et al 2012, Bertram et al 2015). The literature has mainly used mitigation costs to quantify carbon lock-in at the global scale. A common result with this indicator is that when mitigation policies are non-existent or when their stringency is low in the short term, overall mitigation costs increase, reflecting short-term inertia and path-dependency. We considered as mitigation costs as well the unlocked costs calculated by Erickson et al (2015) as the carbon price needed to retire an existing investment in 2015 at half its economic lifetime and replace it with a corresponding low-carbon alternative.
Other studies have evaluated the contribution of infrastructure stock evolution to CO2 emissions by dynamically taking into account both technical and economic factors. To do so, some authors have calculated the emissions/energy gap at a given future year between different scenarios of infrastructure stock evolution. Another approach has been to compare residual emissions – the amount of CO2 emissions whose abatement remains uneconomical or technically infeasible in the long term (Kriegler et al 2015, Luderer et al 2018) – between scenarios. Models used in these publications have projected an increase of global residual emissions when the strengthening of mitigation efforts is delayed. While former indicators have been applied only for forward-looking studies, elasticities related to capital stock variables allows authors to retrospectively isolate the contribution of capital stock evolution to increases in CO2 emissions. Correlations have been estimated between CO2 emissions from coal capital & economic growth, CO2 emissions & material stock or CO2 emissions & industrial agglomeration index (Steckel et al 2015, Lin et al 2017, Zhang et al 2018). Avner et al (2014) also used this type of approach in a forward looking framework, looking at fossil fuel price elasticity of CO2 emissions for different scenarios of public transport supply.
A last group of indicators, used more marginally, relates to institutional and political factors that influence the transition rate of LLCS. This concerns first of all employment, with analyses of the distribution of jobs between low and high carbon sectors or the regional concentration of jobs in carbon-intensive sectors (Bjornaavold and Van Passel, 2017, Spencer et al 2018). The issue of employment is not just a question of social acceptability in case of rapid transition. One of the conditions for the emergence of a capital-intensive low-carbon technology in the face of a dominant technology is the rapid reduction of cost through learning effects. These learning effects depend on the production process of the technology and therefore on the skills of the workers (Bjornaavold and Van Passel, 2017). The second institutional indicator is the technology scale expressed as the market share of given technologies (Erickson et al 2015, Spencer et al 2018, Skoczkowski et al 2018). The hypothesis here is that widespread adoption of a technology induces significant carbon lock-in through confidence in the technology (adaptive expectations) and coordination between sectors (network effects).
The indicator statistics reveal that the majority of existing estimations have used committed emissions or stranded assets as metrics (figure 6 and table 3). These indicators have been used at a diversity of geographical levels compared to other indicators and in multiple sectors. However, more retrospective analysis could be carried out for stranded assets, in particular in order to analyse which policy instruments triggered these premature closures and what the associated economic impacts were. The majority of indicators used refers to technical and economic dimensions of carbon lock-in. Conversely, few analyses have been carried out to quantify institutional carbon lock-in.
3.2.2. Synthesis of results concerning committed emissions and stranded assets
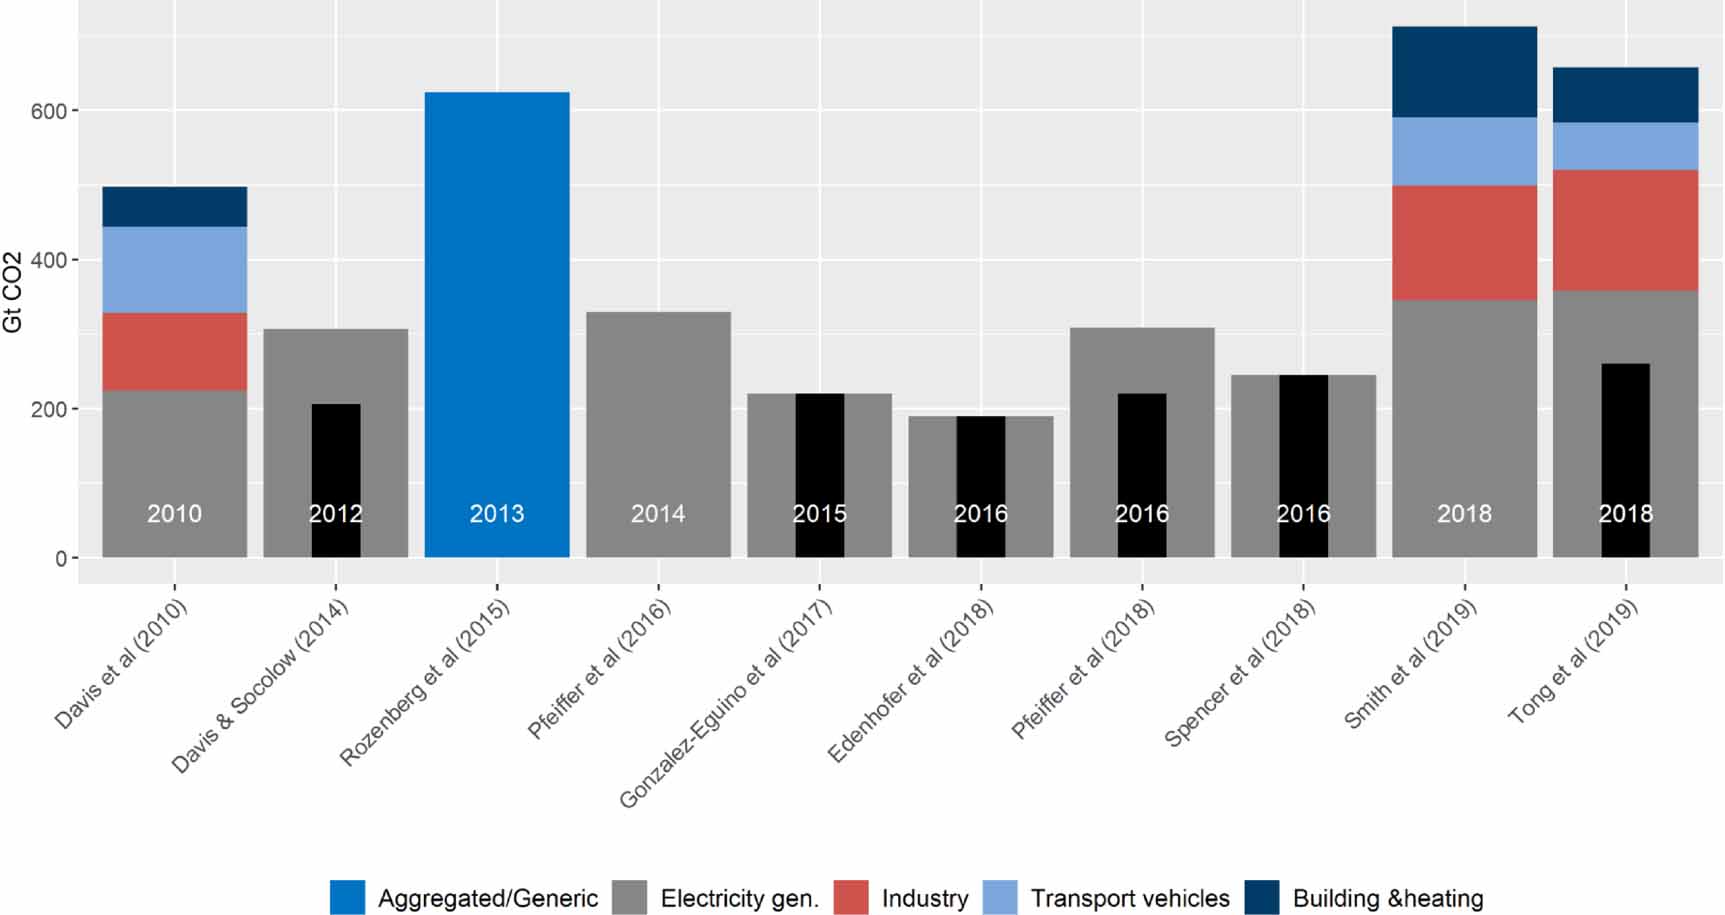
10 studies in the literature have estimated cumulative committed emissions for a given year and at the global scale (figure 7). These articles differ by the sectors included in the analysis. From the four studies that include all sectors, a slight increase over time of committed emissions seems to emerge. However, this result is to be taken with care since it comes from a very small number of studies, and part of the result may come from different methodologies, data sources or assumptions, in particular on capital lifetimes and utilization rates. No clear trend over time emerges for the electricity sector, but again this may be due to different methodologies and assumptions across studies. One study (Tong et al 2019) recently analyzed, with the same methodology, data sources and assumptions, the evolution in committed emissions over time and found an increase in total committed emissions from just above 400 GtCO2 in 1998 to 658 in 2018, with the majority of the increase in the power generation sector and in China.

Figure 7. Global committed emissions (central values) for existing stock of energy infrastructure. The black bar represents the committed emissions related to coal power plants when available. The year used to calculate committed emissions is indicated at the bottom of each bar.
Download figure:
Standard image High-resolution imageThe existing infrastructure contributing the most to global committed emissions are power plants, accounting for between 48% and 54% of the total (Smith et al 2019, Tong et al 2019). This high contribution of the electricity sector is also found at the national level for the 5 countries with the highest CO2 emissions. For all 5 countries, the share of the electricity sector in total committed emissions is above 45% (figure 9). Industry is the second largest source of committed emissions, particularly in emerging countries such as China and India with shares close to 30%.
Existing evaluations of stranded assets have also highlighted the carbon lock-in induced by the power generation sector. Coal-power plants constitute the electricity generation capital with the highest risk of stranded assets. For scenarios consistent with a 2°C target, cumulative global early retired capacities by 2060 would represent less than 50 GW for oil, a maximum of around 600 GW for gas and up to 1700 GW for coal (Iyer et al 2015, Kefford et al 2018). This large difference justifies the greater emphasis of the stranded assets literature on coal power plants. Estimations are sensitive to modelling hypothesis (figure 8). The later the climate policy is implemented, the higher the expected stranded assets are. Even if the climate policy is implemented before 2020, the short-term level of stringency is a determining parameter. Compared to the scenarios assuming a strong emissions reduction as early as 2015 and consistent with a 2°C target, global cumulative stranded coal power assets are expected to be higher by a factor 2-3 for National Determined Contributions (NDC) pathways (these NDC pathways correspond to scenarios where mitigation policies until 2030 correspond to the NDCs from Paris Agreement on Climate Change and where emissions reductions accelerate after 2030 to meet the long term temperature target). This estimation of the additional stranded assets induced by NDCs comes from a single publication (Iyer et al 2015) and therefore could be refined by further research. Results are very sensitive to the assumed operational lifetime for stranded assets calculation especially for lifetimes higher than 50 years. Only one study (Cui et al 2019) quantified stranded assets for 1.5°C scenario obtaining results significantly higher than other studies with similar coal power plants lifetime and year of climate policy implementation.

Figure 8. Global cumulative stranded capacities of coal power plants by 2060. Each marker corresponds to one quantification, either one scenario or one static analysis. The marker's shape codes the assumption on plants lifetimes, and the colors code the temperature target of the scenario. Temperature target refers to the maximum temperature increase expected in 2100 (50% chances minimum) extracted from the scenarios. The X-axis corresponds to the year when emissions reduction starts. It is the year in the mitigation scenario when emissions start to be different from emissions in the baseline scenario (i.e. the scenario with no climate policy). For static analyses based on retirement schedules of the existing stock, we considered the year of the dataset as the starting year of emissions reduction. The NDC scenario refers to a trajectory of emissions reductions consistent with the national determined contributions until 2030 and accelerated emissions reductions after 2030 to meet the long term temperature target.
Download figure:
Standard image High-resolution imageHowever, some publications have suggested that stranded long-lived assets may be even more important outside of the power sector. While stranded power sector assets by 2050 could reach up to $1.8 trillion in scenarios consistent with a 2°C target, Saygin et al (2019) found a range of $5-11 trillion in the buildings sectors. Muldoon-Smith and Greenhalgh (2019) even estimated a potential value at risk for global real estate assets up to $21 trillion. CTI (2015) also quantified $2.2 trillion of unnecessary capex in fossil fuel production and distribution from 2015 to 2025.
The sectoral distribution and amount of stranded assets differ across countries (figure 9). Capital for fossil fuel production and distribution represents a larger share of potentially stranded assets in fossil fuel producing countries such as the United States and Russian Federation. Electricity generation would be a larger share of total stranded assets in emerging countries because this capital is relatively new compared to its operational lifetime. Conversely, buildings could represent a larger part of stranded capital in more developed countries such as the United States, EU or even Russian Federation because of high market value and low turnover rate.
The contrasting results between the two indicators for the buildings sector can be explained by the methodology used to calculate committed emissions. Estimation in global studies tend to underestimate carbon lock-in outside the electricity sector as they do not take into account additional inertia induced by building shells, conditions, asset locations or transport infrastructure (Guivarch and Hallegatte 2011). More research is needed about stranded assets outside of the power sector given their potential magnitude.

Figure 9. Quantifications of committed emissions and stranded assets for the five most 2-emitting countries in 2018. Panel (a) shows committed emissions in 2018 from existing infrastructure and panel (b) stranded assets (stranded investments) by 2050 for a 2°C consistent pathway. Dots correspond to a single quantification, bars give the range when there are multiple quantifications. The order of magnitude for stranded assets in the buildings sector have been estimated by graphical reading from IRENA (2017). Values are not referenced in the codebook we used in this review. Sources : CTI (2015), IRENA (2017), Kefford et al (2018), Saygin et al (2019), Tong et al (2019).
Download figure:
Standard image High-resolution image
3.3. Synthesis of policies to break out carbon lock-in
Here we summarize identified policy implications suggested to escape or avoid carbon lock-in (table 4). The qualitative statements (QS) we found emphasize that three governance dimensions need to be integrated regardless of the instruments used: stability, coordination and legitimacy. Long-term stability of climate policy orientations is referred to in 20 QS. When the policy implementation appears certain and credible, stakeholders are confident and invest early in low-carbon LLCS (Bento 2010, Nam et al 2013, Shahnazari et al 2014, Wang et al 2014, Vogt-Schilb et al 2015) to adapt to the future regulatory context and to avoid sunk investments in high-carbon LLCS. The predictable evolution of climate policies leads to investments more consistent with the long term target, limiting carbon lock-in extension or stranded assets due to unanticipated shock in climate policy (Lazarus et al 2015, Bergen and Mu noz 2018, Kalkuhl et al 2020).
Table 4. Findings from the thematic analysis on qualitative statements about policy implications to escape carbon lock-in. The 136 qualitative statements extracted from our sample are available in the Supplementary Material 3.
| Topic | Counts | Sources |
|---|---|---|
| Supporting low-carbon technology deployment | #22 | Greene and Plotkin (2001), Sandén and Azar (2005), Delrio and Unruh (2007), Ahman and Nilsson (2008), Bento (2010), Lehmann et al (2012), Kalkuhl et al (2012), Avner et al (2014), Mercure et al (2014), Lecocq and Shalizi (2014), Aglietta et al (2015), Bertram et al (2015), Steckel et al (2015), Fouquet (2016), Wesseling et al (2016), Hansen et al (2017), Schmidt et al (2017), Bos and Gupta (2018), Leibowicz (2018), Tvinnereim and Mehling (2018), Edenhofer et al (2018), Szabo et al (2019) |
| Carbon pricing should be introduced | #21 | Greaker and Heggedal (2010), Lehmann et al (2012), Hood (2014), Lecocq and Shalizi (2014), Mercure et al (2014), Shahnazari et al (2014), Bertram et al (2015), Erickson (2015), Fay et al (2015), Hermwille et al (2015), Mattauch et al (2015), Steckel et al (2015), Aghion et al (2016), Pfeiffer et al (2016), IRENA (2017), Jiang et al (2017), Edenhofer et al (2018), Zheng et al (2018), Wilson and Staffell (2018), Rosenbloom et al (2019), Wang et al (2020) |
| Climate policies orientation needs to be stable over time | #20 | Delrio and Unruh (2007), Bento (2010), Greaker and Heggedal (2010), Nolden (2012), Chignell and Gross (2013), Nam et al (2013), Hood (2014), Shahnazari et al (2014), Wang et al (2014), Lazarus et al (2015), Pfeiffer et al (2016), Hansen et al (2017), IRENA (2017), Bergen and Mu\ noz (2018), Spencer et al (2018), La Vi\ na et al (2018), Skoczkowski et al (2018), Wilson and Staffell (2018), Kalkuhl et al (2020), Rosenbloom et al (2019) |
| Carbon pricing if introduced needs to be complemented with other instruments | #17 | Sandén and Azar (2005), Delrio and Unruh (2007), Maréchal (2007), Avner et al (2014), Lecocq and Shalizi (2014), Mercure et al (2014), Bertram et al (2015), Fay et al (2015), Jotzo and Mazouz (2015), Steckel et al (2015), Mattauch et al (2015), Pfeiffer et al (2016), Tvinnereim and Mehling (2018), Kalkuhl et al (2020), Meyer and Schwarze (2019), Rosenbloom et al (2019), Lamperti et al (2020) |
| Implementing technology mandates | #13 | Gül and Turton (2011), Shackley and Thompson (2012), Chignell and Gross (2013), Mercure et al (2014), Bertram et al (2015), Erickson (2015), Jotzo and Mazouz (2015), Steckel et al (2015), Shearer et al (2017), Pfeiffer et al (2018), Rozenberg et al (2020), Tvinnereim and Mehling (2018), Li and Strachan (2019) |
| Coordination between sectors and actors | #12 | Frantzeskaki and Loorbach (2010), Carley (2011), Gül and Turton (2011), Lehmann et al (2012), Malekpour et al (2015), Mäkinen et al (2015), Sachs et al (2016), Wesseling et al (2016), Karakaya et al (2018), Gadre and Anandarajah (2019), Gross and Hanna (2019), Tozer (2019) |
| Highlighting co-benefits and avoided costs | #11 | Delrio and Unruh (2007), Briggs et al (2015), Steckel et al (2015), Kriegler et al (2015), Clausen et al (2017), Martínez Arranz, (2017), Edenhofer et al (2018), Skoczkowski et al (2018), de Macedo and Jacobi (2019), Meyer and Schwarze (2019), Rosenbloom et al (2019) |
| Creating participation processes | #10 | Praetorius (2009), Lehmann et al (2012), Briggs et al (2015), Vandevyvere and Nevens (2015), Sachs et al (2016), Schmid et al (2016), Wesseling et al (2016), Schmidt et al (2017), Spencer et al (2018), Skoczkowski et al (2018) |
| Implementing performance standards | #10 | Bento (2010), Li et al (2010), Shackley and Thompson (2012), Verbruggen (2012), Zaid et al (2014), Fay et al (2015), Pfeiffer et al (2016), Edenhofer et al (2018), Pfeiffer et al (2018), Rozenberg et al (2020) |
| Setting a compensation scheme | #5 | Odenberger and Johnsson (2007), Kefford et al (2018), Edenhofer et al (2018), Jotzo and Mazouz (2015), Rentier et al (2019) |
| Supporting low-carbon R&D | #4 | Gül and Turton (2011), Mattauch et al (2015), Aghion et al (2016), Tvinnereim and Mehling (2018) |
| Not picking any technology as 'winners' | #4 | Marechal and Lazaric, (2010), Shackley and Thompson (2012), Bjornaavold and Van Passel, (2017), Hansen et al (2017) |
| Implementing tax on high-emitting capital | #3 | Barrington-Leigh and Millard-Ball, (2017), Rozenberg et al (2020), Kalkuhl et al (2020) |
The transition of LLCS towards low-carbon systems cannot be done without assuring its legitimacy. This idea appears in the qualitative statements we extracted through different channels such as the transparency and emphasis on co-benefits and avoided costs (11 QS) or the creation of participatory processes (11 QS). Carbon lock-in is at the intersection of political, economic and institutional constraints among a multitude of actors. There is hence the need to ensure the largest possible consensus and support around the rapid transition of existing capital and the associated policy instruments.
Policy packages should also create the space for the coordination between actors and sectors (12 QS), counterbalancing existing coordination effects between 'dirty' sectors. These three aspects - stability, legitimacy and coordination - are not independent and influence each other: creating legitimacy between different actors of LLCS transition policies reinforce the long term stability, and policies that appear stable and credible to stakeholders lead to more coordination.
A variety of different policy instruments are mentioned in our sample (table 4). Incentive-based instruments include emissions taxes, tradable allowance systems, subsidies to emissions abatement or taxes on goods associated with emissions. 21 documents refer to the implementation of carbon price instruments through taxes or allowances with the objective to provide incentives making high-carbon LLCS less attractive. However, some qualitative statements highlight limitations of carbon pricing with regard to the constraints on the LLCS such as the difficulty to assure commitment and stability over time (Pfeiffer et al 2016, Kalkuhl et al 2020), the legitimacy of this instrument (Pfeiffer et al 2016, Rosenbloom et al 2019) or the fact that it does not prevent sunk costs and stranded assets (Tvinnereim and Mehling 2018, Meyer and Schwarze 2019). 17 QS highlight the need to integrate carbon pricing in a broader policy package. Other incentives instruments are mentioned with 3 QS related to taxes on high-emitting capital.
The second category of instruments considered is regulatory instruments with technology mandates and performance standards. Technology mandates refer to a specific requirement regarding the production process such as making the use of a given technology or equipment mandatory. Performance standards impose conditions regarding the output but do not impose any technology. We obtained 13 and 10 QS related to technology mandates and performance standards, respectively. For performance standards, the buildings and heating sector is more represented, with 50 % of the statements compared to other instruments. One explanation is the very slow turnover of building stocks. This means that some choices about energy performance attributes such as the building orientation or its compactness for instance are irrevocable. This calls for immediately choosing the highest energy performance which can be assured with performance standards (Verbruggen 2012, Fay et al 2015). Limiting further sunk costs because of long capital lifetimes also justify the usage of technology mandates especially in the electricy sector with several mentions of moratoria for new coal power plants (Mercure et al 2014, Bertram et al 2015, Steckel et al 2015, Pfeiffer et al 2018, Rozenberg et al 2020).
Technology policies include R&D support and support to technology deployment. Few QS (4) are related to support for R&D contrary to support for technology deployment with 22 QS. One approach is to decrease investment risks in new low-carbon capital (Mercure et al 2014, Aglietta et al 2015, Edenhofer et al 2018). Another approach is to subsidize low-carbon capital to create niche emergence and compensate for the lower costs of fossil fuel capital induced by past cumulative learning effects (Mercure et al 2014, Fouquet 2016, Bos and Gupta 2018, Szabo et al 2019).
4. Conclusion
Long-lived capital-stocks, such as infrastructure and buildings, induce path-dependent evolution and therefore constitute a constraint for the rapid reduction of greenhouse gas emissions. Here, we systematically map the literature about carbon lock-in. To do so, we use machine learning to identify 226 relevant publications for a set of 38 095 articles from the Web of Science and Scopus databases. We extracted qualitative and quantitative information for each publication. The synthesis of this information reveals common analytical approaches, as well as geographical or sectoral specificities.
We find that research on carbon lock-in has mainly focused on power generation. We also identify a bias toward developed countries, which represent the majority of our sample. Comparing the share of global emissions in 2018 and the share of publications for each country, we also highlight understudied countries such as Russian Federation or China (even though the latter has been the most studied country in the literature, it represents a smaller share of publications than its share in global emissions) and overstudied countries such as the United Kingdom of Great Britain and Northern Ireland, Australia, Sweden or Germany.
We also scrutinized publications that quantify carbon lock-in. We identify 11 types of indicators used : installed capacity, age of existing stock, committed emissions, stranded assets, capital costs intensity, mitigation costs, emissions/energy gap, residual emissions, elasticity related to long-lived capital stock, technology scale and employment. The majority of quantitative studies have evaluated carbon lock-in with forward-looking indicators. Committed emissions and stranded assets are the two most widely used indicators. The literature indicates that global committed emissions of existing energy infrastructure increased slightly since 2010. However, this result is to be taken with care since it comes from a very small number of studies. Stranded assets have mainly been quantified for the power generation sector. Coal-power plants are the most important and most investigated stranded assets in the electricity sector. In scenarios consistent with a 2°C target, coal-power plants represent on average about 70% of cumulative early retired capacity. Studies also demonstrate, unsurprisingly, that the later climate policies are implemented, the higher the expected stranded assets are. In scenarios consistent with a 2°C target, stranded coal power assets are evaluated to be higher by a factor 2-3 for pathways that assume relatively low-ambition policies following National Determined Contributions until 2030 compared to pathways assuming ambitious climate policies starting in 2015. However, recent literature suggests that stranded long-lived assets may be even more important outside of the power sector - notably for the buildings sector in developed countries due to its high market value and low turnover rate.
We finally synthesized qualitative statements related to policies to escape carbon lock-in. They highlight the need to assure (i) the stability of climate policy orientations, (ii) the coordination between actors and sectors and (iii) the legitimacy of targets and instruments used. Although the carbon price is one of the two most mentioned policy instrument, it is also regularly pointed out that it cannot prevent carbon lock-in if used alone. Carbon pricing therefore needs to be complemented with other instruments, such as fiscal support for low-carbon capital deployment and the provision of low-carbon infrastructure.
Our work has some limitations related to the systematic review methodology. First of all, some abstracts may use keywords or synonyms other than those used in our search query. Although we also analysed the references of each article to limit this omission, the terminology used for the same subject can vary significantly between organizations and research domains, in particular for transdisciplinary research topic such as sustainable development (Glavic and Lukman 2007). In addition, although the authors defined commonly criteria for publications inclusion/exclusion, the manual filtering of articles can be subject to a certain amount of subjectivity as to whether or not these criteria are met. One way of limiting this potential bias would have been to jointly check all the excluded articles, but this would have led to a much greater amount of work time allocated to the filtering stage. We also conclude from the results of our machine-learning assisted screening that the returns to additional screening would be low, but not zero. It is therefore unlikely that we identified 100% of relevant studies returned by our queries.
Despite these limitations, we identify different knowledge gaps. First, more analyses in non-electricity sectors are required. The two reasons are that (i) the rates of capital renewal can be slower than in the electricity sector but also that (ii) the contribution of sectors other than electricity is likely to increase in the coming decades, as the electricity sector is the 'easiest' sector to decarbonise. Secondly, studies at urban scale are lacking, although cities are called upon to play an increasing role in the implementation of mitigation policies in the future. Thirdly, although developed countries are large contributors to global emissions with the majority of the physical stock already built, future development pathways will need to be analyzed in developing countries in order to disentangle the factors contributing to carbon lock-in (Lee and Koski 2014). In addition, although some of the countries not studied may not contribute significantly to global emissions, they may have specific characteristics of interest for the analysis of carbon lock-in and mitigation policies. This is notably the case for islands, including small island developing states (SIDS), which are geographically confined, are limited in outward sprawl, and display a smaller number of power plants and gasoline stations. These characteristics make them ideal candidates for escaping carbon lock-in (Soomauroo et al 2020). Finally, carbon lock-in depends not only on techno-economic factors but also on institutional factors, and the increasing use of indicators integrating this latter dimension seems necessary to assess more precisely lock-in risks.
Multiple possible low-carbon transition pathways involving rapid transitions of capital exist. However, decisions concerning the transitions cannot avoid the question of feasibility and the underlying political and economic constraints. Identifying existing or future socio-technical and institutional barriers is crucial to informing policy makers on the realistic implementation of public policies (Lamb and Minx 2020). The measures of carbon lock-in strength induced by LLCS delineate the 'dynamic political feasibility space' (Jewell and Cherp 2020). Multidimensional monitoring can allow the iterative readjustment decarbonization targets in different sectors or regions and the implemententation of policy packages consistent with the dimensions highlighted in this review. Some of the indicators that quantify carbon lock-in could support efforts to track progress towards the Paris Agreement targets and to inform the next 'global stocktakes' (Peters et al 2017).
Acknowledgments
Vivien Fisch-Romito acknowledges funding from the Long-term modelling chair for sustainable development (Ponts Paristech-Mines Paristech). Jan Minx acknowledges funding from the German Federal Ministry of Education and Research within the PEGASOS project (Grant Reference: 01LA1826A). Céline Guivarch acknowledges funding provided by the NAVIGATE project (H2020/2019-2023, Grant Agreement Number 821124) of the European Commission.