

Abstract
The environmental benefits of plug-in hybrid electric vehicles (PHEVs) are closely related to the driving and charging behavior of vehicle owners. It is often wrongly assumed that PHEV drivers plug-in once per day. Using data from drivers of the vehicles we show this is not the case and that some drivers rarely charge their PHEV. If the vehicle is not plugged-in regularly, the vehicle will drive fewer electric miles and more gasoline miles, thereby losing out on potential emission savings. Analyzing 30-day charging behavior of 5418 PHEV owners using a logistic regression model, we explore the factors that influence driver's decisions to not charge their vehicle. Several factors play a role in drivers' decision to plug-in their PHEV or not, including vehicle characteristics and the availability and cost of charging at various locations. Higher home electricity prices, lower electric driving range, lower electric motor power to vehicle weight ratios, lower potential cost savings from charging, and living in an apartment or condo, among other factors are related to not plugging in a PHEV. The findings have important implications in terms of future policy and vehicle design including which PHEVs policymakers should incentivize and what measures can encourage PHEV owners to plug-in their vehicles to help realize the environmental benefits of the technology.
Export citation and abstract BibTeX RIS

Original content from this work may be used under the terms of the Creative Commons Attribution 4.0 license. Any further distribution of this work must maintain attribution to the author(s) and the title of the work, journal citation and DOI.
1. Introduction
Electric vehicle market entry is progressing with over 2.5 million plug-in electric vehicles (PEVs) being sold globally in 2019. In the US, the country of analysis for this study, over 325 000 vehicles were sold in 2019. Of this 74.2% were battery electric vehicles (BEVs) and 25.8% plug-in hybrid electric vehicles (PHEVs). While this seems to suggest that PHEVs are falling behind BEVs, at present Tesla is having a disproportionate impact on the market comprising 56.6% of all PEV sales in 2019. Non-Tesla BEV sales are only 17.6% of the PEV market, meaning the share of PHEVs from traditional automakers is greater than the BEV share. (Figures A1 and A2 (available online at stacks.iop.org/ERL/15/084031/mmedia) in the supplementary document gives a snapshot of the PHEV market in 2019). Overall, as the PEV market grows beyond initial early adopters, PHEVs will continue to be part of the market and will play an important role in reducing greenhouse gas (GHG) emissions and energy consumption from the transportation sector (Hardman et al 2019).
PHEVs are incentivized by policymakers based on the belief that all drivers would plug-in regularly and maximize the electric miles driven. While in the case of a BEV we can be certain that compared to a gas car for an average trip of 11 miles1 a BEV would result in tailpipe GHG emission savings of approximately 5.1 US metric tons annually,2 for PHEVs the situation is less certain. The overall tailpipe emissions for a PHEV can vary significantly based on travel patterns and vehicle charging behavior. When a PHEV driver plugs-in their car regularly, they can drive more electric miles enabling tailpipe GHG emission savings than those that do not charge at all or rarely charge their vehicle. Though the performance of PHEV technology largely depends on whether the vehicle owner plugs-in or not, an understanding of this behavior is currently not well-developed in the literature. Previous studies have highlighted the issue of PHEVs not being plugged-in and the consequence in terms of GHG emissions (Plötz et al 2017, Tal et al 2014), but have not investigated why this behavior is occurring. In this paper, we aim to fill this gap by investigating why some consumers do not plug-in their PHEVs with the goal of understanding how we can avoid this behavior.
The decision to plug-in a vehicle regularly or not may be driven by PHEV owners' attitude towards avoiding gasoline consumption, desire to lower total operating cost or both. The potential cost savings from plugging in depends primarily on the electric range of the vehicle, electricity price paid by the vehicle owner, vehicle fuel economy when using gasoline (miles per gallon), and gasoline price. If PHEV owners assess higher cost savings from driving using the electric mode, they may be more likely to plug-in. On the other hand, if the potential cost saving is low, the perceived inconvenience of plugging-in could override the cost benefits leading to non-plugin behavior. An additional consideration is a propensity for the internal combustion engine to engage while driving. Vehicles with lower power electric motors and higher vehicle weights may have a tendency for the engine to turn on even when fully charged possibly giving the PHEV owner a reduced electric driving experience. Finally charging behavior can be influenced by environmental attitudes, sociodemographic characteristics, travel behavior, and vehicle design. We investigate the impact of all these factors using logistic regression with data from 5418 PHEV owners in California.
This paper is structured as follows. In the next section, we present a review of two bodies of research that are relevant to this study. The first is studies on the performance of PHEVs measured in terms of electric vehicle miles/kilometers traveled (eVMT/eVKT) or emission benefits. The second is studies that look at the charging behavior of PEV owners, including any study that investigate non-plug in behavior. Subsequently, in section 3 we describe the survey data used for the analysis. Section 4 presents and discusses the main results. In section 5 we finally discuss the key implications of the findings and conclude the paper with policy implications.
2. Literature review
Most studies on travel behavior and PHEVs focus on understanding eVMT (or eVKT), utility factor, or vehicle efficiency which is affected by how often the vehicles are charged (and other factors such as grid electricity carbon intensity). However, most of these studies make assumptions on how PHEVs are charged, often assuming they are charged once per day (Samaras and Meisterling 2008, Thompson et al 2009, Raykin et al 2012, Onat et al 2015, Yuksel et al 2016, Björnsson and Karlsson 2017, Plötz et al 2018) or are charged every time the vehicle is parked for a certain period (Björnsson and Karlsson 2017). PHEVs in the real world are unlikely to be charged once per day overnight, meaning their real-world performance may differ. And it may not be optimal to charge the vehicles just once overnight, as more charging events away from home can increase the eVMT of the vehicles (Weiller 2011). Plötz et al (2017) used empirical data from PHEVs to investigate how the performance of PHEVs in the real world will be impacted by different charging behaviors. They found that PHEVs with 20 km (12 miles) of range electrify around 15%–35% of VMT, those with 40 km of range 40%–50%, and those with 60 km of range 75% of miles traveled. A further study by the same authors found that longer electric ranges, fewer annual miles, and more regular travel patterns were correlated with higher eVMT (Plötz et al 2018). A study in the Netherlands found that eVMT in a sample of 183 PHEVs was lower than expected at 24% (Ligterink et al 2013). This was partially due to some drivers, notably those who are company car drivers, not recharging their vehicles. Tal et al (2014) estimate eVMT using the charging and driving behavior of PHEV owners in California. They observe that for drivers of Chevrolet Volt PHEVs, eVMT with home and work charging was 67.5% though this could potentially reach 89.1% with more charging. For Toyota Prius PHEVs, real-world eVMT with home and work charging was 20.1% though this could reach 37.3%. The lower eVMT of the Toyota Prius was correlated with fewer charging events and a shorter range of these vehicles.
The focus on eVMT (or eVKT) is primarily driven by the close link between the substitution of gasoline miles with electric miles and the associated emissions reductions. However, there is evidence that driving and charging a PEV may not always have the desired environmental benefits due to the resource mix of the electricity grid (Graff Zivin et al 2014, Kontou et al 2017). This is especially true in regions with a carbon-intensive electricity grid such as the Midwest and Central region of the US. When accounting for vehicle life-cycle emissions and driving behavior, a conventional hybrid vehicle or a PHEV with a smaller battery may be less energy-intensive and can even lead to lower overall emissions than a BEV or PHEV with a larger battery in these regions (Michalek et al 2011, Onat et al 2015, Yuksel et al 2016). However, in regions covered by the electricity grid of Western Electricity Coordinating Council (WECC), Northeast Power Coordinating Council (NPCC), Reliability First Corporation (FCC), and Southwest Power Pool (SPP) driving PHEVs can lead to lower emission costs and energy use depending on the time of charging and the range of the PHEV (Kontou et al 2017). This includes California, the region of analysis in our study. Moreover, considering the emission reduction goals set for the power sector and the market dynamics one can expect the share of fossil fuels to fall in the future (Energy Information Administration 2017). This should enable PHEV drivers to contribute to overall emission reduction by maximizing the electric miles driven.
Prior research has found that the cost of charging can influence charging behavior (Bühler et al 2014, Rezvani et al 2015, Hardman et al 2016, Lane et al 2018). In general, workplace charging can increase potential cost savings by 0.8%–6% for PHEVs with a 20-mile range, 2%–10% for PHEVs with 40-mile, and 5%–17% for PHEVs with the 50-mile range depending on electricity rate at home and work, time to recharge, and gas price (Wu 2018). Free charging has been found to encourage consumers to purchase a PEV (Hardman 2019), though this may also have negative consequences like congestion at free workplace chargers, and potentially preventing those who need to charge to complete their commute (Nicholas and Tal 2013, Tal et al 2014). The study by Nicholas and Tal (2013) also found that the cost to charge at home had an impact on the PHEV owner's charging behavior, with higher electricity costs associated with less vehicle charging, with some survey takers indicating it cost them more to charge their PHEV than to refuel it with gasoline on a per-mile basis. Overall, PHEV owners may have heterogeneous preferences in terms of the cost of charging. Analyzing the charging choices of 157 PHEV owners using a latent class model Ge et al (2018) found two groups of PHEV owners. One group had a strong non-financial desire to maximize electric miles and were willing to recharge their vehicle with electricity that cost four times more than gasoline. The other group was only likely to charge their PHEV if the cost was lower than that of gasoline, indicating they were more economically rational than the other group. Some studies have identified the compatibility of electric vehicle charging stations as a barrier to refueling a PEV (Figenbaum and Kolbenstvedt 2016, Schäuble et al 2016, Lorentzen et al 2017). At present, accessibility to charging stations can be hampered due to a lack of technical compatibility with charge connectors or if the PEV owner does not have the correct charging network membership. For PHEVs, this could result in deterring owners to charge the vehicles and driving electric miles. A recent study on the daily charging behavior of commuters in California analyzed the effect of cost, access to chargers, characteristics of home and workplace infrastructure, and technology on the choice of charging location for both BEV and PHEV drivers (Chakraborty et al 2019). Using a sample of BEV drivers and a subset of PHEV owners who said that they charge more than 4 times in a month, the authors focused on the decision to charge on a given weekday and the chosen location of charging. The study focused on understanding charging behavior of drivers; it did not include those who do not charge their vehicle, since they have no charging behavior to investigate. The study therefore did not consider why some PHEV owners do not charge their vehicles at all. In this new study we aim to close this gap by exploring the factors that influence the overall charging behavior of PHEV owners and why some of them do not plug-in their vehicle. Moreover, we focus on the role of additional factors like cost-saving potential offered by a broad range vehicle models that can cause non-charging behavior.
We were only able to identify two studies that looked at non-charging behavior among PHEV owners. Tal et al (2014) looked at the charging behavior of 1400 PHEVs, including Chevrolet Volt and Toyota Prius Plug-in and found that the latter were on average plugged-in less than Chevrolet Volts. The study found that those that did not plug-in in the last 30 days are influenced to do so by shorter driving ranges of their vehicles and higher electricity prices. A more recent study by Nicholas et al (2017) investigated plug-in behavior in three PHEVs with ranges of 12, 20, and 36 miles of range. The study found that between 15% and 33% of 12-mile range PHEVs, 5%–12% of 20-mile range, and 2%–8% of 36 miles PHEVs did not report plugging-in frequently. This behavior had a substantial impact on the eVMT of shorter-range PHEVs and meant their real-world eVMT was lower than expected. These studies while insightful and perhaps the first studies to identify the issue of not recharging a PHEV, are limited in their scope as they only include a small number of PHEV models and do not conduct detailed modeling of why some PHEV owners are not plugging in, rather they provide an early explorative look at this issue.
3. Data and model description
3.1. Descriptive analysis of survey data
The data used in this study comes from a cohort survey of PEV owners in California conducted in the years 2015, 2016, 2017, and 2018 by the Plug-in Hybrid & Electric Vehicle (PH&EV) Research Center at the University of California, Davis. Participants who owned at least one PEV were recruited based on the list of Clean Vehicle Rebate Program (CVRP) recipients and the Department of Motor Vehicles (DMV) registration data using a random sampling procedure. The response rate for the completed survey was about 15%. For this study, we use a subsample of 5418 households who own or lease a PHEV. We exclude the BMW i3 with range extender from this analysis, as it is primarily a BEV and cannot be driven as a hybrid only.3
There are six categories of questions in the survey: travel behavior, commute characteristics, vehicle characteristics, attitude towards PEV related incentives and environmental concerns, sociodemographic, and charging behavior. For charging behavior, owners of PHEVs were first asked about their charging frequency in a month (30 days). The possible responses to the above question were: 'charged more than 4 times in a month', 'used the vehicle mostly as a hybrid plugging-in 1–4 times', and 'used the vehicle as a hybrid and did not plug-in'. If the respondent mentioned that they charged more than 4 days in a month, they were asked to provide 7 days of charging history related to the location of vehicle charging and the type of charger used.
PHEV owners are classified as 'chargers' and 'non-chargers' based on their response to the question on charging frequency in the past 30 days. If a PHEV owner reports that they plug-in more than four times a month (approximately once a week), we consider them 'chargers'. In case one of the other two response options is chosen, PHEV owners are considered 'non-chargers'. Based on our classification, 92% of the respondents in the sample are chargers and 8% of the PHEV drivers are non-chargers. Though the proportion of non-chargers is low, considering the sample of PHEV owners studied here is representative, the emission costs of not plugging-in will be substantial in view of the entire PHEV market of California. Furthermore, we expect this to be an underestimate as PHEV owners who do not plug-in their vehicle are less likely to participate in a survey on electric vehicles.
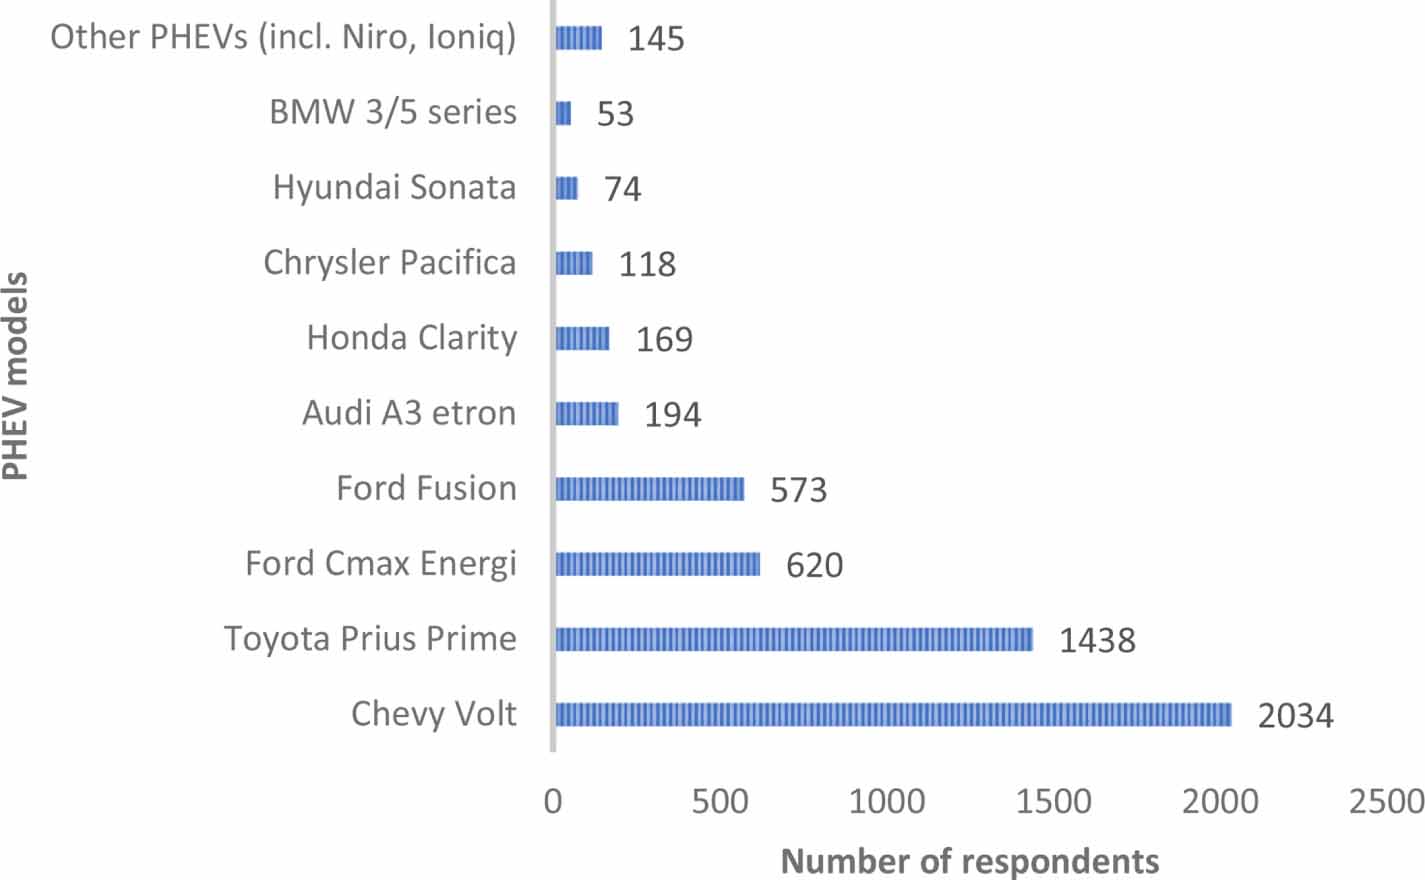
The survey data analyzed here has the whole spectrum of PHEVs that are currently on the road including both short-range (e.g. 1st generation Prius Plug-in hybrids with 11-miles of range) and long-range PHEVs (e.g. Generation 2 of Chevrolet Volt with 53 miles of range, Honda Clarity PHEV with 48 miles of range). This allows us to explore the impact of factors like potential cost-saving on charging decisions for an exhaustive set of vehicle technology possibilities. Figure 1 and table 1 shows the different PHEVs analyzed in this study, their electric range, fuel economy (MPG), potential maximum cost savings from charging, and the number of chargers and non-chargers for each vehicle model. Potential maximum cost savings from a charging event is the difference between the cost of driving a distance equal to the electric range of the PHEV (using battery mode) and the cost of driving the equivalent distance using gasoline. For the descriptive analysis, we use an average gasoline price of $3 per gallon and an average electricity rate of 18 cents per kWh. A noticeable difference of 57 cents exists between the cost- saving potential of the Chevrolet Volt (Gen 2) and Toyota Prius (Gen 2), the two most common PHEVs in the sample and the share of non-chargers among the owners of these vehicle models (appendix B in supplementary materials gives the details of the calculation of potential cost-saving).

Figure 1. Distribution of PHEV models in the sample.
Download figure:
Standard image High-resolution imageTable 1. Potential cost savings of PHEV models & share of charges vs non-chargers.
| PHEV Model | Electric Range (Miles Per Gallon) | Potential cost savings from electric miles | Chargers | Non-chargers |
|---|---|---|---|---|
| VolvoXC90 | 17 miles (27 mpg) | $0.36 | 23 | 0 (0%) |
| BMW 3 series | 14 miles (31 mpg) | $0.22 | 2 | 0 (0%) |
| BMW 5 series | 16 miles (29 mpg) | $0.33 | 50 | 1 (2%) |
| Chevrolet Volt Gen1 | 38 miles (37 mpg) | $0.57 | 213 | 7 (3%) |
| Honda Clarity | 48 miles (42 mpg) | $0.75 | 163 | 6 (4%) |
| Chrysler Pacifica | 33 miles (32 mpg) | $0.84 | 113 | 5 (4%) |
| Chevrolet Volt Gen2 | 53 miles (42 mpg) | $0.83 | 1727 | 87 (5%) |
| Hyundai Sonata | 28 miles (39 mpg) | $0.44 | 70 | 4 (5%) |
| Mitsubishi Outlander | 22 miles (25 mpg) | $0.86 | 22 | 2 (8%) |
| Audi A3 etron | 16 miles (39 mpg) | $0.23 | 177 | 17 (9%) |
| Prius Prime (Gen 2) | 25 miles (54 mpg) | $0.26 | 957 | 95 (9%) |
| Hyundai Ioniq | 29 miles (52 mpg) | $0.21 | 37 | 4 (10%) |
| Kia Optima | 29 miles (40 mpg) | $0.45 | 26 | 3 (10%) |
| Ford C-max Energi | 20 miles (38 mpg) | $0.28 | 545 | 75 (12%) |
| Ford Fusion (pre- 2019) | 20 miles (42 mpg) | $0.25 | 502 | 71 (12%) |
| Kia Niro | 26 miles (46 mpg) | $0.20 | 21 | 3 (13%) |
| Prius Plug-in Hybrid (Gen 1) | 11 miles (50 mpg) | $0.09 | 318 | 68 (17.6%) |
Since households with PHEVs are still early adopters of alternative fuel technology, their demographic and socio-economic characteristics, as well as attitude towards environmental issues, may differ from more mainstream vehicle owners, affecting their charging behavior. Table 2 gives the descriptive statistics of the 5418 PHEV owners whose charging behavior we study. Approximately 72% of the PHEV owners in the sample had a college education or more compared to only 32.6% of the population according to the 2017 American Community Survey (ACS) 5-year estimate. The share of homeowners, high-income groups, and two-or-more vehicle owners is also higher in the sample. According to the 2017 ACS, only 54.5% were homeowners, 9.7% of the population had an annual household income over $200 000, and 37.3% had two vehicles in the household in California. Compared to the age and gender distribution of the population in California (median age in California is 36.1 and the share of the male population is 49.7%), the sample analyzed here have a higher number of male respondents and people in the age group 40 and above. For the demographic characteristics like age, gender, and education attainment we considered the primary driver of the PHEV.
Table 2. Descriptive statistics of primary drivers of the PHEVs in the sample (n = 5418).
| Age Distribution | Tenure of Home | Attitude toward Incentives (avg. score) | |||
|---|---|---|---|---|---|
| 15–29 | 6.8% | Own | 79.3% | HOV lane | 1.47 |
| 30–39 | 22.6% | Dwelling type | Monetary incentives | 2.05 | |
| 40–49 | 24.1% | Single detached | 78% | Parking benefits | −0.28 |
| 50–59 | 23.1% | Condominium | 12.7% | Attitude toward environment | |
| 60 and older | 23.3% | Apartment | 9.2% | CO2 emission reduction | 1.60 |
| Local air pollution reduction | 1.59 | ||||
| Reduce Oil Dependency | 1.65 | ||||
| Education Distribution | Vehicle Holding | Commuter/Non-commuter | |||
| College graduate & above | 71.7% | 1 vehicle | 17.6% | Share of commuters | 88.3% |
| Household Income Distribution | 2 vehicles | 49.5% | Average Commute Distance | ||
| <$100 000 | 21.3% | 3 or more vehicles | 32.9% | Average distance (in miles) | 20.1 (S.D: 19.4) |
| $100 000–$149 999 | 23.8% | Rate plan Adoption | Gender | ||
| $150 000–$199 999 | 19.4% | Time of use | 21.4% | Male | 59.6% |
| >$200 000 | 35.4% | EV rate | 30.7% | Solar Cell Ownership | |
| Own PV cell | 26% | ||||
3.2. Model description
To study the importance of factors that affect a PHEV owner's charging decision we estimate a binary logistic choice model. The dependent variable (D.V.) is the decision to be a 'charger' or a 'non-charger' as defined earlier, whereby DV = 1 implies 'Charger'. The factors that we control for in the choice model are:
- Electricity rate paid at home (cents kWh−1)
- Solar cell ownership
- Workplace charging availability and cost of charging (Free vs Paid)
- Number of chargers at work
- Dwelling type: detached home, condominium, or apartment
- Age and gender of the primary driver
- Age of the PHEV (in months)
- Number of miles of commute done in ICE mode
- Importance of incentives like the High Occupancy Vehicle (HOV) lane access and parking benefits for PEVs (Likert scale of −3 to 3 ranging from 'Not important' to 'Important')
- Gasoline price paid by commuter (at the time of the survey)
- Environmental attitudes
- Vehicle technology attributes
Variables associated with the operating cost of a vehicle like electricity rate paid at home and gasoline price should be negatively correlated with the probability of plugging-in the vehicle. On the other hand, solar cell ownership that can help households reduce the cost of charging at home should have a positive impact on the probability of charging. Considering the characteristics of workplace charging infrastructure, both access to free workplace charging and a higher number of chargers are expected to positively affect plug-in behavior. In terms of the characteristics of the vehicle technology, we explore the impact of electric range and the power-to-weight ratio of the PHEV. The data on electric range and power-to-weight ratio for the different PHEV models are imputed based on values reported by www.fueleconomy.gov/ and the manufacturer. The power-to-weight ratio is the electric motor power output in kilowatts divided by the total vehicle weight in metric tons. Electric drive power-to-weight ratio is a good proxy to explain how the vehicle performs in electric-only mode or when fully charged. High power-to-weight ratios will result in quick acceleration, ease of reaching highway cruise speeds, and will reduce the likelihood of the engine activating to assist in acceleration or cruising. This may result in a superior electric driving experience encouraging PHEV drivers to charge. The two-sample Wilcoxon rank-sum test indicates that we can reject the null hypothesis that there is no difference in electric range or the power-to-weight ratio between the group of chargers and non-chargers (table 3). The last column of table 3 (Prob_order) displays an estimate of the probability that a random draw of the measure (range or power-to-weight ratio) from the population of non-chargers is larger than a random draw from the population of chargers.
Table 3. Wilcoxon rank-sum test.
| Vehicle technology | Null Hypothesis H0 | z-value | Prob > |z| | Prob.order |
|---|---|---|---|---|
| Electric range | e-range (non-charger) = e-range (charger) | −9.066 | 0.0000 | P\{e-range(non-charger) > ;e-range(charger)\} = 0.374 |
| Power-to-weight ratio | pwratio1(non-charger) = pwratio1(charger) | −6.838 | 0.0000 | P\{pwratio1(non-charger) > pwratio1(charger)\} = 0.405 |
Though electric range has a greater influence on the operating cost and power-to-weight ratio impacts the electric driving experience, we run two separate iterations of the logit model for the two technology features as they are highly correlated vehicle characteristics. We present below the results of both the models to highlight the importance of these technology features on charging behavior.
While we analyze the importance of electricity rate and vehicle electric range separately, in the real-world, driver's behavior is likely based on perceived cost savings that are simultaneously determined by the two factors along with driving experience when the vehicle is fully charged. Therefore, we estimate a separate logistic choice model considering the effect of cost savings on the decision to charge or not. Unlike the calculations for table 1, for the regression model, we calculate the maximum potential saving for each PHEV owner using imputed electricity rate, gasoline price at the time of the survey reported by the Petroleum Administration for Defense Districts (PADD) for region 5,4 and the electric range and fuel economy of the PHEV driven by the respondent as reported by www.fueleconomy.gov.
One can expect that if a PHEV owner can complete their commute using the electric mode only, they are more likely to be incentivized to charge. In other words, we can hypothesize that the variable representing the commute distance done in gasoline mode will have a negative impact on the probability of charging.
The variables representing socio-demographic characteristics and attitude towards incentives like the HOV lane access allows us to control for heterogeneity in preference among PHEV owners in the sample. Though attitude towards incentives is generally linked with probability of adoption of alternative fuel vehicles, one can hypothesize that if an individual's purchase decision is strongly motivated by an incentive like HOV lane access (mostly to avoid congestion in the commute route), they are less likely to care about emission or cost savings and thereby less likely to plug-in.
Finally, for completeness, we provide additional details on how two of the explanatory variables were constructed: home electricity rate and environmental attitude. The electricity rate paid at home is imputed based on the utility name and rate plan reported by the survey respondent. If the latter reported that they pay a flat rate, then we assume that the household is paying the tier 2 rates charged by the corresponding utility. The environmental attitude variable is created using factor analysis of three environment-related attitude questions asked in the survey (Likert scale of −3 to 3 representing attitude ranging from 'not important' to 'important'): How important were the following factors in your decision to buy a plug-in car (i) Reducing local air pollution, (ii) reducing greenhouse gas emissions, and (iii) reducing oil dependency?
4. Results of the logistic regression model
Table 4 gives the estimates of the logistic regression model for three model specifications—(1) with electric range of the vehicle, (2) with electric motor power-to-weight ratio, and (3) with maximum potential cost savings from charging. (In appendix C of the supplementary materials we give the coefficient estimates i.e. the log odds estimates (table C1), the variance-covariance matrix (table C3), and the result for the test of multicollinearity (table C2)). The D.V. is binary with Charger = 1 and Non-charger = 0. The classification of PHEV owners as 'Chargers' and 'Non-chargers' has been described earlier in the Data and Model Description section. The coefficients are presented as odds ratios with a ratio of less than 1 representing a negative impact on the probability of being a 'charger' and a positive effect is represented by a ratio greater than 1.
Table 4. Logistic regression odds ratio estimates and (standard error) (D.V: Charger = 1).
| (Model 1) | (Model 2) | (Model 3) | |
|---|---|---|---|
| VARIABLES | Charger or not | Charger or not | Charger or not |
| Rate Paid @ home (cents kWh−1) | 0.9563*** | 0.955*** | — |
| (0.00698) | (0.007) | — | |
| Cost saving ($/charge) | — | — | 1.477*** |
| — | — | (1.030) | |
| Solar @ home (Yes: 1) | 2.366*** | 2.436*** | 2.359*** |
| Work available X Paid charging | (0.459) | (0.473) | (0.455) |
| 1.314 | 1.346 | 1.357 | |
| (0.253) | (0.259) | (0.230) | |
| Work available X Free charging | 2.690*** | 2.722*** | 2.753*** |
| (0.5394) | (0.546) | (0.551) | |
| Number of chargers @ work | 1.018 | 1.018 | 1.017 |
| (0.0128) | (0.0129) | (0.013) | |
| Condominium dweller (base: detached) | 0.516*** | 0.518*** | 0.521*** |
| (0.087) | (0.087) | (0.088) | |
| Apartment dweller (base: detached) | 0.137*** | 0.137*** | 0.135*** |
| (0.0215) | (0.0215) | (0.021) | |
| Age of primary driver | 1.186*** | 1.186*** | 1.186*** |
| (0.0532) | (0.0531) | (0.053) | |
| Gender of primary driver (Male:1) | 1.607*** | 1.627*** | 1.627*** |
| (0.1996) | (0.2019) | (0.201) | |
| Age of PHEV (in months) | 0.985*** | 0.981*** | 0.980*** |
| (0.005) | (0.00466) | (0.004) | |
| Electric range of PHEV (in miles) | 1.0197*** | — | — |
| (0.0049) | — | — | |
| Power/Weight of vehicle (kW/metric ton) | — | 1.021*** | 1.020*** |
| — | (0.0058) | (0.006) | |
| Gasoline miles in commute | 0.9898** | 0.9892*** | 0.989** |
| (0.004) | (0.004) | (0.004) | |
| Importance of HOV benefit | 0.934*** | 0.932*** | 0.930*** |
| (0.0203) | (0.0202) | (0.020) | |
| Importance of parking benefit | 0.9852 | 0.9823 | 0.979 |
| (0.0795) | (0.079) | (0.079) | |
| Gas Price ($/gallon) | 0.804 | 0.981 | — |
| (0.17963) | (0.227) | — | |
| Positive Environmental attitude | 1.141** | 1.146** | 1.142** |
| (0.0663) | (0.0665) | (0.066) | |
| Constant | 25.424*** | 8.542** | 3.329*** |
| (18.239) | (7.302) | (1.172) | |
| Log-likelihood | −1010.34 | −1010.72 | −1013.91 |
Note: *** 1% level of significance, ** 5% level of significance
In models 1 and 2, holding all else constant, higher electricity rates increase the probability of not charging. On the other hand, in all the specifications we observe that solar cell ownership makes being a charger more likely. In all the model specifications we observe that compared to PHEV owners living in detached homes, apartments and condominium dwellers are more likely to be in the non-charger group. While this result may be driven by lower access to Level 1 or 2 chargers at or near residence making overnight charging difficult for these consumers, it may also be due to these buyers self-selecting to buy PHEVs primarily for incentives like HOV lane access and intend to drive them mostly as a conventional hybrid.
In terms of demographic characteristics and environmental attitudes of PHEV drivers, we observe that female drivers and those with a lower concern for environmental issues are more likely to not charge their PHEV. Older PHEV owners are more likely to be 'chargers'. We also observe that all else constant, if PHEV drivers consider HOV access as important in their decision to purchase a PHEV it reduces the odds of being a charger. There is no significant effect of attitude towards parking benefits on charging behavior.
Among those with access to workplace charging, the odds of being a charger is 2.05 times higher when charging is free compared to when it is paid.5 Though a higher number of chargers indicating greater charging opportunity is expected to have a positive effect on charging behavior, we do not observe a significant effect in any of the models. One possible explanation of this result can be that unlike BEV owners, PHEV drivers are not constrained by the battery of their vehicle. As a result, given the cost of charging at the workplace and all other factors constant, a higher number of chargers may not be enough to incentivize PHEV drivers to overcome the inconvenience of plugging-in and charging their vehicles. Higher electric range (model (1)) and higher power-to-weight ratio (model (2)) increase the odds of being a charger. Moreover, the interaction between electric range and commute distance has an influence on the charging decision with the odds of plugging-in being lower when the difference between the commute distance and electric range is high. This behavior may be primarily driven by the tradeoff between fuel cost savings and the cost of charging the PHEV. Owners of older PHEVs are more likely to not plug-in their vehicles. This can be due to low battery performance and consequently lower potential cost saving from plugging in.
In model 3 we include the estimate of maximum potential savings from a single charging event at home. Considering the intention to lower vehicle operating costs usually plays an important role in the decision to purchase PEVs, higher cost-saving potential from driving electric miles should lower the probability of non-charging. In table 1, we observe that approximately 18% of the owners of the Generation 1 Prius Plug-in Hybrid that offered a maximum saving of $0.09 per charging event are non-chargers while 9% of the owners of the Generation 2 Prius offering cost savings of $0.26 per charge are non-chargers. The odds-ratio estimates of model 3 lends support to this trend observed in table 1.
We use the estimates of the logistic regression model to calculate the marginal effects (ME) of some of the important drivers of plug-in behavior of PHEV owners (table 5). Marginal effect of a continuous predictor  in a logistic regression model is estimated as:
Table 5. Marginal effect estimates.
| Model 1 | Model 2 | Model 3 | ||||
|---|---|---|---|---|---|---|
| dy/dx | Std. Err. | dy/dx | Std. Err. | dy/dx | Std.Err. | |
| Electricity rate @ home (cents kWh−1) | −0.0028 | 0.0005 | −0.0028 | 0.0005 | — | — |
| Solar @ home | 0.0448 | 0.0083 | 0.0463 | 0.0083 | 0.0450 | 0.0084 |
| Free workplace charging | 0.0365 | 0.0114 | 0.0360 | 0.0114 | 0.0363 | 0.0115 |
| Condominium | −0.0397 | 0.0118 | −0.0395 | 0.0118 | −0.0393 | 0.0118 |
| Apartments | −0.1940 | 0.0214 | −0.1946 | 0.0214 | −0.1981 | 0.0215 |
| Age of driver | 0.0105 | 0.0028 | 0.0106 | 0.0028 | 0.0106 | 0.0028 |
| Gender of driver (1: male) | 0.0294 | 0.0078 | 0.0304 | 0.0078 | 0.0305 | 0.0078 |
| Age of PHEV (in months) | −0.0009 | 0.0003 | −0.0012 | 0.0003 | −0.0012 | 0.0003 |
| Gasoline miles in commute | −0.0006 | 0.0002 | −0.0007 | 0.0002 | −0.001 | 0.0002 |
| Importance of HOV lane access | −0.0042 | 0.0013 | −0.0044 | 0.0013 | −0.004 | 0.0013 |
| Power to weight ratio | — | — | 0.0013 | 0.0004 | 0.001 | 0.0003 |
| Electric range | 0.0012 | 0.0003 | — | — | — | — |
| Cost savings ($/charge) | — | — | — | — | 0.0242 | 0.0044 |
Note: all the marginal effect estimates are significant at 1% level of significance
Vehicle attributes like electric range and power-to-weight ratio have a small but significant positive marginal effect on the probability of being a charger. All else constant, a unit increase in the electric range or the power-to-weight ratio reduces the probability of being a non-charger on average by 0.1 percentage points. Figures 2(a) and (b) show the marginal effect of electric range and the electric power-to-weight ratio on the predicted probability of being a charger for different levels of electric range and power-to-weight ratios. We observe that the marginal effect of a unit increase in the electric range of PHEV increases as the range of the vehicle goes up. A similar result is observed in relation to the power-to-weight ratio. The increase in marginal utility and thereby the probability of charging due to more enhanced electric driving experience gets stronger with increases in power-to-weight ratio.
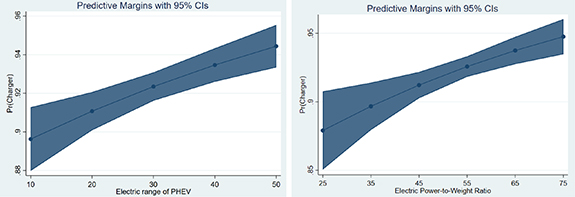
Figure 2. (a) ME of electric range (miles), (b) ME of power to weight ratio (kw/ton).
Download figure:
Standard image High-resolution imageAn increase in home electricity rate by 1 cent kWh−1 on average increases the probability of being a non-charger by 0.3 percentage points. The marginal effect of the electricity rate at home for different price-levels is shown in figure 3. However, there may be an endogeneity issue with the electricity price variable if unobserved factors that influence an individual to change to lower EV rates also affect their probability of charging. It is possible that cost-sensitive individuals are more likely to change their electricity plans to lower the cost of charging.
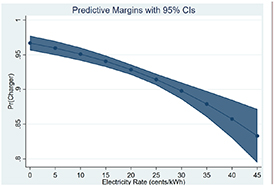
Figure 3. ME of home electricity rate (cents kWh−1).
Download figure:
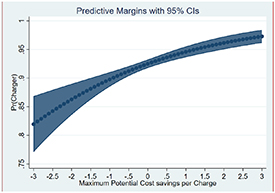
Standard image High-resolution imageOwnership of solar cells at home has a significant positive marginal effect on being a charger. As in the case of electricity price, the result should be interpreted with caution as there could be a self-selection bias whereby PHEV owners who want to maximize electric miles (perhaps due to environmental concern or the desire to save on fuel costs) are more likely to install solar cells at home due to the same environmental concern or desire to reduce electricity bills. The dwelling type also has a strong impact on the probability of being a non-charger. Compared to PHEV owners living in detached homes, condominium dwellers are on average 4 percentage more likely while apartment dwellers are 19 percentage points more likely to be non-chargers. Free workplace charging has a positive marginal effect on the probability of being a 'charger' (3.6% more likely). The sign of the marginal effect of demographic characteristics, attitude towards incentives like the HOV lane access, and vehicle age concurs with the odds ratio estimates and explanations mentioned earlier. Finally, everything else constant, a unit increase in potential cost savings raises the probability of being a charger on an average by 2.4 percentage points (table 5). Figure 4 shows the marginal effect of potential cost savings on plug-in behavior.
Figure 4. ME of potential cost savings ($).
Download figure:
Standard image High-resolution image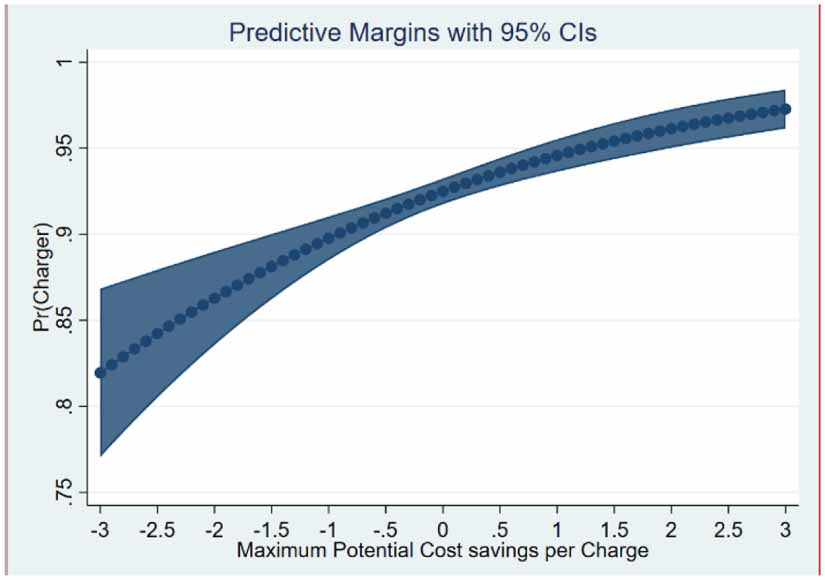
An important point that needs to be considered while interpreting the above results is that the method of invitation to the survey and the survey questions may create a bias underestimating the phenomena of not plugging-in or driving the PHEV as a hybrid only. PHEV users who are using their vehicles as a hybrid only are less likely to complete a survey on the topic of PEVs Though the large sample size still allows us to estimate the impact of different factors on charging behavior, our results may underestimate the total magnitude of the phenomena.
5. Discussion and policy recommendations
By identifying the factors associated with consumers not charging their PHEV and using it mainly as a hybrid vehicle we can suggest ways to counteract this behavior. First, lower electricity rates at home increase the likelihood of being a PHEV charger as it increases the potential cost savings from charging the vehicle. For utilities who offer lower rates for PHEV owners, increasing consumer awareness of these rates may increase utilization of them, which in turn could reduce the number of people who do not charge. Utilities without these lower-cost rates could consider introducing them for PEV owners. Second, free workplace charging can increase the likelihood of being a PHEV charger. Though it is difficult to recommend free workplace charging due to the issues of charger congestion that can occur (Nicholas and Tal 2013), nevertheless if charging is free and ubiquitous at workplaces fewer PHEV drivers would not charge. In the long-run, low-cost charging at work may be a middle ground between solving congestion issues and encouraging PHEV owners to charge. Third, high charging availability at low cost can reduce the probability of not charging. Charger availability may prove more challenging when shifting to the main market, as more buyers will be without home charging. Those living in multi-unit dwellings are less likely to charge as they may not have a charging facility at home, which points to more efforts being needed in providing home charging access for these consumers. Fourth, consumers who indicated HOV lane access was important in their decision to purchase a PHEV are less likely to charge. Though restricting HOV lane access to BEVs would prevent consumers from buying a PHEV for this benefit and not charging it, it could also impact PEV market growth and maybe unfair to PHEV owners who do charge their vehicles. Policymakers could introduce more stringent range requirements for PHEVs, with only longer-range PHEVs that are more likely to charge receiving the HOV lane access benefit.
From a vehicle design perspective, longer-range PHEVs and those with a higher electric drive power-to-weight ratio increase the likelihood of charging. The added weight of increasing PHEV battery capacity can negatively impact fuel economy as the electric motor or ICE need to propel more weight (Shiau et al 2009). However, the increased battery capacity will also mean buyers are more likely to plug-in the vehicle, which would counteract the weight penalty. Without clear policy and regulatory signals, automakers may not endeavor to design PHEVs with long driving ranges and more powerful electric motors that generally encourage drivers to maximize electric miles (as observed in our study and previous literature). Such signals do currently exist in California where Zero Emission Vehicle (ZEV) credits are based on the electric driving range and whether the vehicle is a blended hybrid or unblended hybrid (which is related to electric power-to-weight ratio). However short-range PHEVs which are more likely to not charge still receive credits. Further to this short-range PHEVs are eligible for federal and state incentives. The credits and the incentives should be available based on the real-world performance of PHEVs.
Action could also be taken to encourage PHEV owners to plug-in their vehicles. This could include increasing gasoline price through taxes, though in the US this is usually politically unfavorable. Another strategy could be to reduce the cost of charging. This could be through special electricity rates at home or offering free charging at work, though the latter does pose the risk of causing charge point congestion. Finally increasing access to charging from home for those that live in apartments or condominiums could also increase the possibility for PHEV owners to charge their vehicle. Finally, why females and younger PHEV owners are more likely to not plug-in is unclear. Only around ¼ of PHEV buyers are female at present (Lee et al 2019). As a result, perhaps the charging needs of female PHEV drivers are being overlooked in current research. In general, more research is needed to understand why fewer females purchase PEVs and why they are more likely to not charge a PHEV. Regarding age, it is not clear why younger PHEV owners are less likely to plug-in.
Though prior research shows that PHEVs can generate as many electric miles as BEVs and may encourage more consumers to purchase PEVs, the role of PHEVs in the transition to PEVs is sometimes debated, potentially due to the issues explored in this paper. Many of the reasons why consumers do not plug-in seem to be avoidable or solvable through effective policymaking.
6. Conclusion
This study aimed to understand why some PHEV drivers do not charge their vehicles and use it as hybrid only. The benefit of focusing only on this behavior allows a clearer understanding of the factors driving the non-charging behavior which we believe is an important contribution to the literature on PEVs.
Among the PHEV owners analyzed here, not plugging-in is most prevalent among the owners of Generation 1 Toyota Prius Plug-in (with 11 miles of electric range) with 17.6% of the drivers using the vehicle as a hybrid only. The issue is also prevalent with the Ford Energi vehicles (with 20 miles of electric range) with 12% using the vehicle as a conventional hybrid. The Generation 1 Plug-in Prius is no longer sold in the US and the Ford Energi vehicles are aging platforms that are set to be withdrawn from the market. However, this does not mean this behavior and its effects will cease. First, the vehicles will remain on the roads for many years, and second automakers are continually introducing new PHEVs with ranges in the region of 12–20 miles.6 Assuming the behavioral pattern of current short-range PHEVs owners will remain with future adopters of the vehicles, the loss in terms of carbon dioxide emission savings could be substantial. Non-charging behavior has the potential to increase emissions from short-range (10–20 miles) PHEVs by between 17% (Toyota Plug-in Prius Gen 1) and 30.1% (Ford Fusion Energi). The emissions increase is especially high for low fuel efficiency vehicles like the Mitsubishi Outlander (44% increase in CO2 emissions) or the Chrysler Pacifica (55% increase in CO2 emissions) but is also high for PHEVs like the Chevrolet Volt Gen 2 (76.1% increase in CO2 emissions).7 In the latter case, the increase in emissions is high due to the high electric mile range when charged, though these vehicles have a lower probability of not being plugged in (appendix D in the supplementary document gives the details of the calculation).
PHEVs are part of many plans to decarbonize transport and part of many automakers' plans to comply with fuel economy and emissions standards. In many cases PHEV can electrify households that otherwise will not by a BEV. However, if they are not plugged-in their real-world emissions can be substantially higher than what is projected. Policies need to be designed to prevent non-charging behavior from occurring among all PHEV owners. This is especially important as the purchase and use of PHEVs are being subsidized by state and federal funding, and some fuel economy regulations incentivize automakers to produce the vehicles.
Acknowledgments
Thanks to Matthew Favetti (Plug-in Hybrid and Electric Vehicle Research Center, Institute of Transportation Studies, UC Davis) for programming the questionnaire survey used to gather data for this study.
Data availability statement
The data that support the findings of this study are available from the corresponding author upon reasonable request.
Footnotes
- 1
According to the 2017 National Household Travel Survey (NHTS), the average distance traveled by a car owner on a given day is 11 miles.
- 2
Considering annual VMT of 11 485 miles according to the (2017 NHTS) and assuming the average passenger vehicle emits about 404 grams of CO2 per mile (www.epa.gov/greenvehicles/greenhouse-gas-emissions-typical-passenger-vehicle).
- 3
'Driven as a hybrid only' implies driven like a conventional hybrid. When driven as a conventional hybrid the PHEVs engine is used to provide power for propulsion. With a BMW i3 with range extender when the battery is not charged the engine cannot propel the vehicle on its own in all conditions (e.g. at high speeds or on inclines).
- 4
PADD region 5 includes the states of California, Oregon, Washington, Nevada, Arizona, Alaska, and Hawaii.
- 5
Since we introduce the two factors 'access to workplace charging' and ' paid/free workplace charging' in an interaction term, the odds ratio free workplace charging is the odds of a person with free workplace charging being a charger divided by the odds of a person with paid workplace charging being a charger, when workplace charging is available.
- 6
https://evadoption.com/future-evs/new-electric-vehicles-in-2020/.
- 7
Here, we consider average GHG emissions due to charging behavior. We consider average well-to wheel carbon-dioxide emissions from the grid (gCO2e/kWh) = 378.54 and the well to wheel carbon content for gasoline for emissions from vehicle as 11 405.85 gCO2e gallon−1.