

Abstract
Lakes play a crucial role in retaining water and altering biogeochemical processes on floodplains. Existing strategies and algorithms for estimation of water storage are insufficient for dynamic floodplain lakes due to the scarcity of available observations. Combining a time series of open water area with a fine spatial-temporal resolution by integrating Landsat and MODIS observations of Poyang Lake (China) with digital elevation models, and limited gauge data, generated water storage estimates as a function of surface hydrological connectivity. Despite possessing a relatively small portion of Poyang Lake's water volume, the floodplain lakes occupy a large part of the surface water area, especially in the low water period. Floodplain lakes, in particular, those distributed in the upper delta contribute to relieving drought conditions in Poyang Lake.
Export citation and abstract BibTeX RIS

Original content from this work may be used under the terms of the Creative Commons Attribution 4.0 license. Any further distribution of this work must maintain attribution to the author(s) and the title of the work, journal citation and DOI.
1. Introduction
Floodplain lakes are characterized by seasonal water level fluctuations and variable water storage (Alsdorf et al 2000). The interactions among river, lakes, and floodplain play an important role in flood control, nutrient and sediment transport, biodiversity protection and human welfare, and has increasingly become a focus of wetland management (Dudgeon et al 2006). The volume of floodplain lakes reflects hydrological (e.g. timing, duration, and frequency of inundation, surface water recharge, and discharge) and atmospheric (e.g. rainfall and energy balance) conditions (Crétaux et al 2016). Estimating water storage is essential for scientific and operational applications. However, in large remote and poorly gauged regions, measurements of surface water storage in floodplain lakes are lacking.
Three approaches are typically used to evaluate surface water storage changes: (1) integrating observed water level and hypsometric data, (2) hydrological and hydraulic modeling, and (3) remote sensing. The first approach requires field measurements of bathymetry and stage which are scarce in extensive floodplains (Lesack and Melack 1995). In recent years, numerical models have been applied to floodplain inundation studies (Rudorff et al 2014, Zhang et al 2017, Ji et al 2019, Yao et al 2019). These models require detailed bathymetry and hydrological inputs. In addition, the hydro-dynamic modeling must be undertaken cautiously in the large and flat delta, where small uncertainties in the water level can generate large errors in the prediction of flood extent. Remote sensing data and techniques provide an opportunity to monitor inundation pattern, water level and water volume of lakes (Alsdorf et al 2010, Crétaux et al 2016).
Satellite altimetry, such as ICESat/ICESat-2 (Duan and Bastiaanssen 2013, Li et al 2019a), CryoSat-2 (Jiang et al 2017), Jason-1/2/3 (Hwang et al 2019), Sentinel-3 SAR (Shu et al 2020), Radarsat-2 (Baup et al 2014) and a multi-mission altimeter dataset (Busker et al 2019) have proved capable of measuring water height variations. However, altimetry is a profiling, not an imaging technique, and is applicable only for water bodies greater than about two kilometers in width (Alsdorf et al 2000). Besides, there is an instrumental bias of each altimeter (Bonnefond et al 2010), and the tracks are not located over the same region of a given lake (Crétaux et al 2013). Imagery from space-borne platforms, such as passive microwave sensors, synthetic aperture radars, and Landsat thematic mapper, has been used to map the extent and timing of inundation (Verpoorter et al 2014, Hess et al 2015, Pekel et al 2016, Zeng et al 2017). These methods do not directly measure vertical water changes, yet the elevation and lake volume changes can be inferred by integrating long-term horizontal water extent changes with available digital elevation models (DEMs) (Pietroniro et al 1999, Tseng et al 2016, Yuan et al 2019). Given the trade-offs between spatial and temporal resolution, the quality of single-source satellite imagery needs further improvement before applying them to the detection of small water bodies or in cases where shallow lakes undergo frequent and rapid changes in lake volume.
Poyang Lake (China) is an expansive lake-floodplain system with ∼10 m annual water level fluctuations under the combined effects of catchment inflow and interactions with the Yangtze River. More than 102 lakes ranging from <1 km2 to 71 km2 in size and separated by levees, riverbanks and/or soil ridges during dry seasons exist on the floodplain (Hu et al 2007). These seasonally isolated lakes are important elements of the local hydrological and ecological regime due to their ability to store and retain water, and to change water quality. Previous studies have demonstrated that bathymetric variation, groundwater flow and human manipulation of floodplain lakes might limit the accuracy of numerical models in this system (Tan et al 2019a). Using Landsat, MODIS, and ENVISAT, China's HuanJing and microsatellite image data, prior studies have documented the broad inundation patterns of Poyang Lake and the surrounding floodplains (Dronova et al 2011, Feng et al 2012, Liao et al 2013). The spatial-temporal dynamics of the water level and volume of the numerous floodplain lakes remain largely unknown.
To advance understanding of the Poyang floodplain, we fused Landsat and MODIS imagery and built a surface water series of Poyang Lake with high spatial and temporal resolutions, which make it possible to detect inundation extents of the small and shallow lakes undergoing frequent and rapid changes. Based on a hydrological connectivity analysis, the water level and volume of individual floodplain lakes were calculated separately by combining remotely sensed inundation extent and a high-resolution DEM obtained from bathymetric surveys. This study is expected to provide a novel insight into understanding the complex lake-floodplain behavior, both for the Poyang system and in general.
2. Study site
There are four main hydrological phases in Poyang Lake: rising water (April–May), high water (July-September), receding water (October-November) and low water (December-March). During rising water, the level of Poyang Lake is mainly determined by the catchment inflow. The flow and sediment regime of Yangtze River plays a primary role in determining the water level during the high water and receding water periods (Hu et al 2007).
Poyang Lake has experienced a water-level decline since the 2000s due to climate change and anthropogenic activities. The Three Gorges Dam (TGD) intensified these effects (Zhang et al 2012), and bathymetric changes caused by sand mining and bed erosion increased the outflow of the lake (Yao et al 2018). The decline in inflows to the lake and middle-lower Yangtze River resulting from climate change also contributes to the lake's shrinkage (Liu et al 2013).
In this study, 77 lakes distributed across the Poyang floodplain are delineated and analyzed. These floodplain lakes are fully or partly connected to the main lake during high water levels and become isolated during low water levels. The hydrological connectivity of these lakes has been recognized as a key factor in determining ecological benefits (Xia et al 2016), water quality (Li et al 2019b), and filling/draining processes (Tan et al 2019b).
3. Data and methods
The 16 d composited MODIS13Q1 data (at a spatial resolution of 250 m) in 2000–2016 were obtained from Aqua and Terra satellites, produced every 8 d. A constrained view angle-maximum value composite (CV-MVC), a bidirectional reflectance distribution function (BRDF) algorithm and a running median, mean value, maximum operation, end point processing and hanning (RMMEH) smoothing method were adopted to filter out the effects of instrument calibration, sun angle differences, terrain, cloud shadows, and atmospheric conditions. A total of 129 cloud-free Landsat TM, ETM+ and OLI (at a spatial resolution of 30 m) images were retrieved and paired with the MODIS images to generate a new NDVI dataset with high temporal and fine spatial resolutions. In addition, the daily water levels at five gauging stations and a 5 m DEM surveyed in 2010 were acquired from the Hydrological Bureau of Jiangxi Province and applied in the lake level and volume calculations. Steps used are as follows:
Step 1: MODIS data were projected and resampled as same as Landsat images; an initial predicted fine resolution image was produced using a direct multiplier method; a hierarchical 'similar pixels' scheme was used to identify both prior and predicted dates; a weight was assigned to each similar pixel based on spectral difference and spatial Euclidean distance; the NDVI value of the central pixel was computed with the algorithm of the hierarchical spatiotemporal adaptive fusion model (HSTAFM) (Chen et al. 2017, 2018).
Step 2: The fused NDVIs were classified as wet and dry classes using the Jenks natural breaks method; based on wet/dry binary state data, the geocoding and extent of each individual water body were defined by applying a geostatistical connectivity analysis (Trigg et al. 2013).
Step 3: Within the smallest rectangular extent of each individual water body, a set of inundation extent limits were calculated using the high-resolution DEM data by applying the terrain elevation of each pixel as a potential water level.
Step 4: An appropriate elevation value for each water body was determined based on examining similarities between the RS-derived and DEM-derived inundation areas. Each estimated water level was then adjusted using the highest terrain elevation within the overlapping part of the two inundation extents.
After the water level was recorded, water depth was estimated by subtracting the terrain elevation from the surface elevation of each water body. Finally, the water volume of each pixel can be calculated when multiplying water depth by pixel area. The protocol for this water volume prediction procedure is demonstrated in figure 1.

Figure 1. Demonstration of water volume estimation procedure. Taking two randomly selected units as examples (labeled 1 and 2, respectively): 'Binary image' shows the distribution of dry and wet pixels within the smallest rectangle; 'Water level' shows the wet (painted with blue color) and dry (painted with orange color) pixels determined by different thresholds of 'Elevation'; the estimated water levels (that is, 13.5 m and 12.9 m in the examples) was adjusted by 'Step 4' when the highest match between the inundation extent derived from 'Binary image' and that derived from 'Elevation' was achieved; the 'Volume' of Poyang Lake was finally calculated by accumulating the volume of each unit.
Download figure:
Standard image High-resolution image4. Results and discussion
4.1. Water level estimation and accuracy assessment
Because the water level observations in most floodplain lakes are unavailable, the percentage of overlapping area between RS-derived and DEM-derived inundation extent (which was determined by the optimal water level) in the RS-derived water area is considered as an indicator of relative accuracy of estimated water levels and shown for four typical floodplain lakes from 2000 to 2016 (figure 2). For each lake, a single water level peak occurred in every hydrological year. During the low water period, the water level of each floodplain lake varied slowly when it was disconnected from the main lake. During the other periods, the water elevation increased and decreased as a function of the flooding in the main lake. The extreme drought years (2006 and 2011) and flood years (2010 and 2016) were captured by the estimated water levels and agreed with previous work (Feng et al 2012, Ye et al 2016). A comparison of figures 2(a)–(d) reveals that the minimum water levels of the lakes located in the upland floodplain (Shahu and Changhuchi) are higher than those of lowland lakes (Banghu and Dahuchi); the water levels of lower lakes (standard deviation = 1.29 m) varied more than higher ones (standard deviation = 1.08 m). The relative accuracy of estimated water levels is higher during the high water period than in other periods because the inundation extent derived from remote sensing and the DEM are almost the same when the whole floodplain is inundated. Water level accuracies for Dahuchi are greater than for the other three lakes because the upper lakes have higher levees and increased distance from the main lake.

Figure 2. Variations of the estimated water levels and relative accuracies for (a) Banghu, (b) Dahuchi, (c) Shahu and (d) Changhuchi for 2000–2016.
Download figure:
Standard image High-resolution imageAs shown in figure 3, the estimated water levels are highly correlated with gauge observations for Dahuchi (R2 = 0.94) and Shahu (R2 = 0.95) in 2016. The main discrepancies occurred when the water level rose above or decreased below ∼14 m, which is the level determining whether or not the sub-lake connected to the main lake (Tan and Jiang 2016). In comparison, satellite radar altimetry promises a higher elevation accuracy of about 10 cm, but it may not be applicable in lakes with rapid water level fluctuations like Poyang Lake. For example, Andreoli et al (2007) monitored the lake level in Poyang Lake using an integration of ENVISAT ASAR/MERIS images with SRTM-C and had an average error at 1.26 ± 1.83 m. Compared to some previous optical satellite-based estimates, the elevation accuracy in this study is also higher. For example, Tseng et al (2016) inferred the water level changes in Lake Mead via a thematic imagery-altimetry system, and had a root mean square error (RMSE) of 0.58 ± 0.63 m as compared with in situ stage records. Cai et al (2014) constructed an area-level relationship applying MODIS imageries in Poyang Lake and obtained a correlation between water area and water level with an R2 between 0.61 and 0.98. There are also other water level estimates with higher accuracies, but at the expense of applicability, temporal continuity or time span (Pietroniro et al 1999).

Figure 3. Relationships between estimated and observed water levels for (a) Dahuchi and (b) Shahu. Eight day averaged water levels for each time-series in 2016 are shown. 'Ens' denotes the Nash-Sutcliffe coefficient and 'RMSE' denotes the root mean square error (m).
Download figure:
Standard image High-resolution image4.2. Temporal variations of water area and volume
Minor changes in water level can cause large changes in the distribution of inundated areas because of the gradual slopes on the floodplain. A floodplain lake expands rapidly at the beginning of the rising period and slows until the lake area reaches the maximum value. Estimated water levels with relative accuracies larger than 90% were fitted against calculated lake areas using the relation  , in which
  is the elevation (water level),
  is the surface water area,
  is an asymptote,
  is response rage and
  is a rate. Meanwhile, the quadratic polynomial was employed to create an individual rating curve and used to characterize the response of lake volume to water level fluctuations. The
  coefficients in the quadratic functions are related to the slope of the curves. The elevation-area and elevation-volume curves of typical floodplain lakes have high fitting precision (adj. R2 = 1; figure 4). With these curves, the area and volume of every floodplain lake can be calculated when water levels and precise bathymetry are available. This study takes advantage of the bathymetric surveyed DEM data which can delineate the bottom topography of the lakes. While for other DEM datasets (e.g., SRTM DEM), this method may be not applicable.
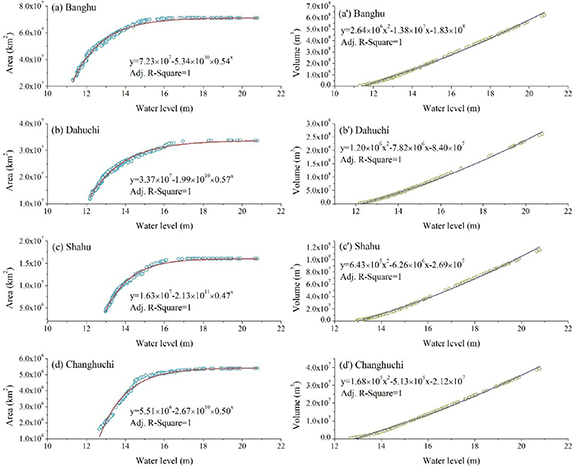
Figure 4. Elevation-area and elevation-volume relationships for (a) and (a') Banghu, (b) and (b') Dahuchi, (c) and (c') Shahu, and (d) and (d') Changhuchi.
Download figure:
Standard image High-resolution imageThe surface water area of Poyang Lake varies from 150 to 3135 km2, and an associated lake volume rages from 3.8 × 10⁸ to 218.6 × 10⁸ m3. To understand the role of floodplain lakes in the hydrological process of the lake-floodplain system, Poyang Lake was divided into main lake (water bodies connected to permanently flooded main channel) and floodplain lakes (all other water bodies disconnected from the main lake), and their respective areas and volumes were estimated (figure 5). As noted in prior studies (Li et al 2019b), the volume of floodplain lakes accounted for a small part of the whole Poyang Lake in both the high (3.5% ± 1.9%, mean ± SD) and low water period (5.6% ± 2.0%). However, the surface water area of the floodplain lakes occupied a larger part of the whole lake (14.4% ± 1.6%), especially in the low water period (18.5% ± 6.8%). These shallow water areas provide critical habitat for plant communities dominated by emergent sedges or grasses (Tan et al 2016).
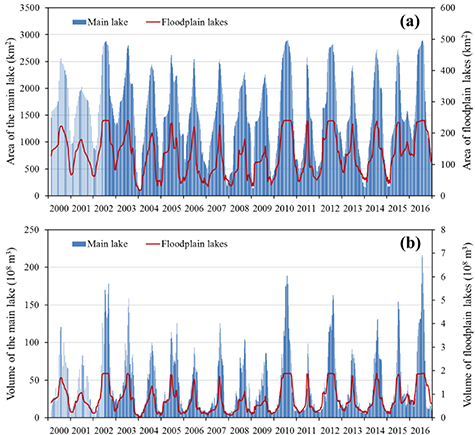
Figure 5. Variations of estimated (a) lake area and (b) volumes for the floodplain lakes and main lake, 2000–2016.
Download figure:
Standard image High-resolution imageConstruction of a dam at the outlet of the Poyang Lake is being proposed to reduce the extent and duration of low water periods. The dam's operation would increase the depth and duration of inundation over the floodplain, which might lead to a reestablishment or loss of plant communities and influence the water birds that depend on these communities. While the plant communities control the suspension of sediments and improve water quality, their loss due to prolonged submergence could shift the system to one dominated by phytoplankton and algae (Barzen et al 2009).
4.3. Spatial heterogeneity of water volume changes
The progression of floodplain lakes in the upper delta toward those in the lower delta is mainly a process related to the levee height of channels, distance from the main lake, and the type of connection between the lakes. To estimate the spatial heterogeneity of hydrological behaviors, the rate of change in water volume in the floodplain lakes from 2000 to 2016 was examined (figure 6). Given that the water volume changes in floodplain lakes reflect the hydrological behavior of the main lake when they are coupled into one single water body, the examination of changes in maximum water volume and volume changes in flood period were not included. In rising, receding or low water periods, the mean value of the upper lakes' volume increased from 2000 while the lower lakes experienced a downward trend during the past 17 years. For example, in the river system of Xiushui, the average volume of upper Changhu and Shahu has increased by 0.03 × 10⁸ m3 yr−1, while the average volume of lower Banghu has decreased by 0.03 × 10⁸ m3 yr−1. The rate of change in water volume varied from −0.06 × 10⁸ m3 yr−1 to 0.08 × 10⁸ m3 yr−1.

Figure 6. The rate of long term change in lake volume from 2000 to 2016. Figures (a)–(c) refers to the rate of change in average lake volume during rising, receding and low water period, respectively. Figures (a')–(c') refers to the rate of change in minimum lake volume during rising, receding and low water period, respectively.
Download figure:
Standard image High-resolution image
Water levels of some high-closure lakes (refer to lakes surrounded by high levees, which only in contact with other water bodies during higher-than-average floods) not far away from the suburban towns have been manipulated by control gates located on drainage canals. These gates were usually closed in the early recession period to store water for fish growth and then opened in January for harvest. The management of these lakes enables them to store more surface water during the rising and receding periods when they are disconnected from the main lake. With the background of frequent drought events in Poyang Lake, the floodplain lakes, especially those high-closure classes, can alleviate the drought effect.
5. Conclusions
This study developed a methodology of rapidly estimating water level and volume automatically using a combination of integrated satellite imagery and elevation models, taking China's largest lake-floodplain system as an example. The estimated water levels are accurate and consistent with gauge data. These observations demonstrate new insights into flood inundation processes that were poorly understood with prior studies. Three key findings are summarized as follows:
- (a)This study provides a novel perspective for the monitoring of water storage in ungauged, dynamic floodplain lakes.
- (b)Floodplain lakes of Poyang Lake possess a small part of water volume, but a large proportion in surface water area especially during the low water period.
- (c)Floodplain lakes contribute disproportionately to reducing the effects of drought in Poyang Lake.
Acknowledgments
This work was supported by the National Key Research and Development Program [2019YFC0409002], the National Natural Science Foundation of China [41801080], and the Key Program of Nanjing Institute of Geography and Limnology of the Chinese Academy of Sciences [NIGLAS2018GH06].
Data availability statement
The data that support the findings of this study are openly available online (https://doi.org/10.5281/zenodo.3608755).