

Abstract
Three Gorges Dam (TGD), the world's largest hydroelectric project in terms of installed capacity, alters the discharge and thermal regime of the Yangtze River in China, thereby threatening the aquatic biodiversity along the mid-lower Yangtze River. Thus, the influence of the TGD impoundment on the river temperature (Tw) and water cycle warrants in-depth examination. To the best of our knowledge, this study is the first to use decadal (2001–2013) Moderate Resolution Imaging Spectroradiometer temperature data to assess the impacts of TGD impoundment on the inland water cycle. We found that (1) spatially, the multiyear Tw decreased by 5 °C along the mid-lower Yangtze River, (2) temporally, Tw exhibited a warming trend after the operation of the TGD began, with most warming occurring from October to December directly after the TGD impoundment, and (3) the correlations between discharge and Tw in the pre- and post-TGD periods have changed; specifically, the closer to the TGD a location is, the greater the change in the relationship. Our analysis implies that downstream water temperature alteration is mainly attributed to the TGD management regime, and the influence is obvious along the 260 km river downstream of the TGD. It is likely that the impoundment of the TGD has increased the water residence time and slowed the water speed downstream.
Export citation and abstract BibTeX RIS
1. Introduction
Few stream and river systems have remained unaltered globally (Vörösmarty et al 2004, Lehner et al 2011), and many systems have been unavoidably modified and threatened by local- to global-scale human activities (Dudgeon et al 2006, Vörösmarty et al 2010). Among these activities, dam construction and river impoundment are direct driving forces (Webb 1996, Gu et al 1998, Hester and Doyle 2011, Fan et al 2015) that have resulted in irreversible hydrodynamic and thermal regime changes (e.g. Yang et al 2005, Lammers et al 2007, Cai et al 2018, Liu et al 2018), as well as habitat fragmentation, which alters aquatic ecosystems and threatens biodiversity (Vörösmarty et al 2010, Winemiller et al 2016). It has been reported that 47% of the world's rivers (average flows > 1000 m3 s–1) are affected by dams, and there were more than 50 000 large dams (taller than 15 m) throughout the world in 2011, with the number of dams expected to increase worldwide (Lehner et al 2011, Olden 2016). Under such conditions, stream and river temperatures and their changes due to impoundment are being examined more frequently (Xie et al 2007, Percival et al 2011, Hannah and Garner 2015, Liu et al 2018) by hydrologists, biologists, and policy makers alike.
Traditionally, river temperature is measured using instream thermometers or temperature loggers. Although these sampled temperature data may have fine temporal resolution (e.g. hourly), the discrete samples result in a low spatial resolution, and the spatially heterogeneous pattern of the fluvial temperature may not be captured (Handcock et al 2012). Remotely sensed thermal infrared (TIR) sensors can provide land surface temperature (LST) data that include inland water temperatures across wide spatiotemporal scales, and TIR sensors have been applied to map fluvial temperatures with considerable progress, as reviewed by Handcock et al (2012) and Dugdale (2016). However, river temperature data with a fine spatial resolution (∼1 m) can only be retrieved from TIR sensors on aircraft (e.g. Dugdale et al 2015, Wawrzyniak et al 2016) or unmanned aerial vehicles (e.g. Song et al 2017), and satellite TIR data with a moderate resolution (∼100 m), e.g. Landsat data, have only been applied to large rivers (Wawrzyniak et al 2012, Ding and Elmore, 2015, Lalot et al 2015, Ling et al 2017, Martí-Cardona et al 2019). In addition, the swath width of such sensors, e.g. 185 km × 185 km for Landsat, commonly restricts their application to rivers within a certain length (e.g. ~200 km), and the long revisit frequency (or limited flight replication due to expensive data collection) prevents generating temporally continuous datasets. The Moderate Resolution Imaging Spectroradiometer (MODIS) on board the Aqua and Terra satellites, which provides global temperature data at 1 km every 1–2 d, exhibits great potential for continuously mapping the longitudinal river temperature of large rivers.
The Yangtze River (Changjiang), the longest river in China, originates from the Tanggula Range in Qinghai Province in western China and flows approximately 6380 km and across eleven provinces from west to east (figure 1) before draining into the East China Sea. The Yangtze River has played an important role in the history, culture and economy of China for thousands of years and has been strongly affected by human activities (e.g. Chen et al 2001a). Three Gorges Dam (TGD), located in Sandouping, Yichang, Hubei Province, and at approximately the end of the upper Yangtze River, is currently the hydroelectric project with the largest installed capacity in the world and has multiple objectives, such as flood control, hydropower generation, and sedimentation reduction. The TGD began operating in 2003, and the operation stages can be divided into the cofferdam stage (TGD I), the initial stage (TGD II), and the normal operation stage (TGD III) according to water level (figure 1).

Figure 1. Geographic information about the study area and water level changes before and after the construction of the Three Gorges Dam (TGD). (a) Schematic of the selected section of the Yangtze River in China. (b) Yangtze River based on the MODIS land use product (MCD12Q1) with the International Geosphere-Biosphere Programme (IGBP) classification scheme in 2012. (c) Examples showing the consecutive statistical units with a width of 5 km (or regions of interest, ROIs) based on which the water temperature values were averaged and adopted for analysis in this study. (d) Landsat imageries showing the changes of water area before and after the construction of the TGD. (e) Daily water levels of the TGD from 2002 to 2012. (f) Water level of the TGD during the normal operation stage (TGD III). The gaps in the river in (b) and (c) are caused by the coarse resolution of the MODIS product and quality control.
Download figure:
Standard image High-resolution imageAs the world's largest hydroelectric project, the TGD not only changed the discharge (Guo et al 2012, Gao et al 2013), water level (Wang et al 2013), and sediment (Yang et al 2014) of the Yangtze River but also the thermal regime (Cai et al 2018). The altered hydrodynamics and thermal regime may threaten the biodiversity (Xie et al 2003, Xie et al 2007, Huang and Wang, 2018) along the mid-lower Yangtze River. Thus, the influence of TGD impoundment on the river temperature and water cycle warrants further investigation. Therefore, we hypothesize that the water cycle downstream of the TGD is buffered and present a new perspective on the relationship between TGD impoundment and the hydrological cycle of the mid-lower Yangtze River using evidence from decadal MODIS water temperature changes.
2. Data and methods
The datasets used to investigate the hypothesis were as follows: (1) satellite-based water temperature (Tw) for investigating temperature changes; (2) satellite-based land use products for identifying the Yangtze River; (3) water temperature data from hydrological stations for validating satellite-based water temperature data; and (4) river discharge data from hydrological stations (figure 1) for analyzing the relevant hydrological mechanisms. The hydrological observations were from the annual hydrological report of China.
Tw was retrieved from long-term (2001–2013) MODIS land surface temperature/emissivity datasets (MOD11A2, version 5), which provided land surface temperature (LST) data that included the inland water temperature. To cover the entire study area, seven MODIS granules covering vertical tiles 5 and 6 and horizontal tiles 25 to 28 were used (table S1 is available online at stacks.iop.org/ERL/15/014002/mmedia). The daytime temperature datasets have spatial and temporal resolutions of 1 km and 8 d, respectively, and were distributed by the NASA Land Processes Distributed Active Archive Center (https://lpdaac.usgs.gov/).
The data processing steps are summarized in figure S1 and are as follows: (1) sets of seven adjacent same-type MODIS products that were obtained at the same time from two vertical tiles were mosaicked and projected to a spatial resolution of 1 km using a universal transverse Mercator (UTM) projection (WGS84, UTM zone 48 N) with the MODIS Reprojection Tool and MODIS Conversion Toolkit; (2) the Yangtze River water pixels for each year were identified from annual MODIS land use data (MCD12Q1) at 500 m spatial resolution with the International Geosphere-Biosphere Programme (IGBP) classification scheme; (3) daily LST pixels over the river that were marked as good quality with LST errors <2 °C were retrieved with the support of the ENVI/IDL software package; and (4) the Tw matrix with a dimension of 190 × 46 × 13 (Tw values downstream of the TGD × MOD11A2 temporal resolution × number of years) was retrieved based on consecutive units (or regions of interest, ROIs) with 5 km widths along the Yangtze River (figure 1(c)) because the 5 km sampling window avoids lateral and longitudinal gaps (as shown in figure 1(c)) caused by the coarse resolution of MOD11A2 and quality control rules, thereby including sufficient pixels for analysis. The ROIs were generated in ArcGIS software by intersecting the river pixels and a fishnet with a width of 5 km.
When performing spatial analysis for a given year, the annual Tw value for ROI i (i = 1, 2, 3, ..., 190) was averaged from 46 datasets of the ROI in the year (figure S2), and the annual Tw values were then averaged using a 50 km moving window (11 ROIs) to better understand the temperature change trend. Temporally, the monthly Tw value for ROI i was averaged from four consecutive datasets of the ROI in the year except three consecutive datasets for February and December (figure S2), and the monthly Tw values were also averaged using a 32 d (four datasets) moving window. To assess the influence of TGD impoundment on the water temperature, the Tw datasets were divided into four periods with equal lengths, namely, 2001–2003, 2004–2006, 2007–2009, and 2010–2012, corresponding to pre-TGD, TGD I, TGD II, and TGD III. Before calculating the mean annual (or monthly) Tw value for each period using previously described methods, the temperature values of ROI i from each 3 year period were averaged. Additionally, regression analysis was used to study the relationship between Tw and discharge, and an analysis of variance (ANOVA) statistical test was adopted to assess significance among variables.
3. Results and discussion
3.1. Spatiotemporal changes in water temperature in different TGD periods
Spatially, the average Tw from 2001 to 2013 decreased along the mid-lower Yangtze River (figure 2(a)). The statistics show that the Tw immediately downstream of the TGD was approximately 22 °C, but it was approximately 17 °C at the mouth of the river (approximately 50 km west of Shanghai), representing a temperature decrease of 5 °C. The cooling trend was relatively obvious along the river approximately 260 km from the TGD (22 to 18.4 °C), with a slope and determination coefficient (R2) of −0.02 and 0.74, respectively, whereas the slope and R2 for the rest of the river were −0.003 and 0.47, respectively (figure 2(a)). The spatial trends in the Tw before and after TGD operation were similar to those of the multiyear average (figure 2(b)).

Figure 2. Spatiotemporal distribution of the water temperature (Tw) of the Yangtze River: (a) mean annual Tw from 2001 to 2013; and (b) trend of the mean Tw in the mid-lower Yangtze River for different Three Gorges Dam (TGD) periods. Note: the gaps in the Yangtze River in figure 2(a) are mainly caused by the coarse resolution of the MODIS product and clouds; the original temperature datasets in figure 2(b) were averaged using a 50 km moving window; in the box and whisker plot in figure 2(b), the boxes show the interquartile range (25th–75th percentiles), and the dark yellow line through a box is the median, whereas white and grey dots are mean and outlier values, respectively; the asterisks indicate that two adjacent datasets are significantly different (ANOVA, P < 0.05, n = 180).
Download figure:
Standard image High-resolution imageTemporally, the mean Tw of the mid-lower river increased from 2001 to 2009 and then decreased (figure 2(b)). Before the construction of TGD (2001–2003), the mean Tw of the mid-lower river was 18.9 °C, varying from 17.0 to 20.6 °C. In TGD I (2004–2006), the Tw increased marginally, with a mean value of 19.0 °C. However, the mean Tw for TGD II (2007–2009), with a value of 19.3 °C, was significantly different from that for TGD I based on ANOVA. Later, the mean Tw decreased to 18.6 °C in TGD III (2010–2012). The trends of the RS-based Tw were similar to those for Tw observed at two downstream hydrological stations, Hankou (HK) and Datong (DT) stations, located approximately 300 and 635 km from the TGD, respectively (figure S3). We found that Tw cooling during TGD II and TGD III led to a decreasing temperature trend from 2001 to 2012 (figure 2(b)), which may have been limited by the statistical period. A comparison from 2001 to 2013 showed that the annual Tw generally exhibited a warming trend. Alternatively, an analysis of the temperature datasets strictly based on the TGD operation stage, e.g. the cofferdam stage (TGD I: June 2003 to September 2006), and not on the three consecutive-year period, e.g. TGD I (2004–2006), showed that the Tw also exhibited a warming trend from 2001 to 2012 (figure S4).
The monthly trends further revealed detailed periods when warming and cooling occurred (figure 3). Although no significant differences between the Tw values in August were observed, ANOVA (P < 0.05) revealed significant differences among the Tw values in different TGD stages in other months. Comparing Tw in the same month between pre-TGD and TGD I, a cooling effect occurred from January to March (figures 3(a)–(c)), whereas warming mainly occurred from October to December (figures 3(j) and (l)). When comparing TGD I and TGD II, significant warming occurred from January to March, and in May and December, whereas cooling occurred in April, June, July, and November. The cooling trends were obvious in most months between TGD II and TGD III, except July, August, and November. Differences with significant changes in monthly Tw values in various TGD stages varied from 0.3 °C to 3.0 °C, with a mean value of 1.0 °C, indicating obvious water temperature alteration downstream of the TGD and along the mid-lower Yangtze River.

Figure 3. Spatiotemporal distribution of the monthly water temperature (Tw) in the mid-lower Yangtze River for different Three Gorges Dam (TGD) periods. Note: the legends of the figures are similar to that for figure 2(b).
Download figure:
Standard image High-resolution imageThe spatiotemporal change patterns in water temperature may have been caused by the hydromorphological changes upstream of the TGD associated with the increased upstream water area and volume that led to the formation of Three Gorges Reservoir (figure 1(d)), which acted as an extremely large source of thermal flux storage and greatly influenced the thermodynamic regime of the region (Zhong and Power, 1996, Preece and Jones, 2002, Casado et al 2013). Moreover, the change in water temperature appeared to be dependent on changes in the hydrodynamics, i.e. the water level and discharge regulated by the TGD (see section 3.2 for details).
3.2. Relationship between river discharge and water temperature
Figure 4(a) through (c) show that Tw was positively correlated with the discharge (Q) (R2 > 0.6; ANOVA, P < 0.001) at the monthly scale in the mid-lower Yangtze River in both the pre- (1976–1985) and post-TGD (2003–2012) periods based on observations from the Yichang (YC, approximately 25 km downstream of the TGD), Hankou (HK, 330 km), and Datong (DT, 635 km) stations. It is interesting that at the three hydrological stations, all the regression lines of the Tw–Q relationship share the same slope of −0.0005 for both the pre- and post-TGD periods, but the intercept values increase in the post-TGD period, with values of 1.5 °C for the YC station and 1.0 °C for both the HK and DT stations. The intercept changes highlight a warming trend in Tw in the two decades. In addition, considering the same intercept change value of 1.0 °C, there may be little change in the Tw–Q relationship between the HK and DT stations; however, a margin of 0.5 °C between the intercept differences at the YC and HK stations for the pre- and post-TGD periods may indicate that the TGD has a decreasing impact on Tw downstream of the dam until the HK station. Although the Tw–Q relationship may be better represented using a nonlinear regression method, changes in the Tw–Q relationship based on power regressions at the three stations (figure S5) show a similar trend to those obtained via the linear regressions mentioned above.
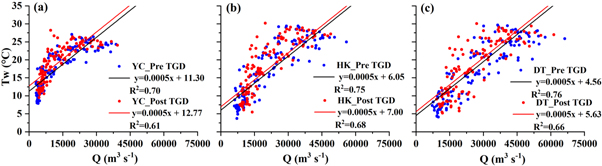
Figure 4. Relationship between monthly observed river discharge (Q) and water temperature (Tw) at the different hydrological stations located various distances from the TGD: (a) Yichang (YC) station, approximately 25 km from the TGD; (b) Hankou (HK) station, approximately 300 km from the TGD; and (c) Datong (DT) station, approximately 635 km from the TGD. Note: pre- and post-TGD represent the periods of 1976–1985 and 2003–2012, respectively; ANOVA (P < 0.001, n = 120) reveals significant regression relations between Q and Tw at the three stations.
Download figure:
Standard image High-resolution imageFurthermore, significant correlations between Q and Tw at the three stations (ANOVA, P < 0.001, figure 4) can also be explained using RS-based temperature datasets. For example, the discharge in the mid-lower Yangtze River in October was significantly reduced after TGD impoundment, whereas it significantly increased in February (Gao et al 2013). Accordingly, variations in Tw in October in the post-TGD periods in the mid-lower Yangtze River were the lowest (figure 3(j)), but the variations in Tw in February were the highest (figure 3(b)). The impoundment of the TGD normally began in mid- to late September, and impoundment generally lasted one to two months, reducing discharge downstream of the dam and leading to similar variations in Tw (as well as warming effects) along the mid-lower Yangtze River from October to December (figures 3(j)–(l)).
Moreover, the relatively smooth Tw along the 260 km river from the TGD was related to the weakened cooling effect in figure 2(a) during the impoundment months with the highest water levels (reduced discharge), with regression slopes of −0.02, −0.04, and −0.06 for October, November, and December, respectively. In contrast, the high variation in Tw along the 260 km river from the TGD enhanced the cooling trend from June to August when the TGD maintained a low water level (release more water and increase discharge) because the regression slopes were −0.09, −0.06, and −0.07 in June, July, and August, respectively. The results indicate that the Tw values of the rivers within approximately 260 km downstream of the TGD were most likely influenced by TGD operations.
3.3. Water temperature changes due to the TGD or climate
Water temperature is influenced by both the hydrodynamic characteristics of the river and the surrounding environment (Gu et al 1998, Caissie, 2006, Webb and Nobilis, 2007, Webb et al 2008). The local climatological gradient may also contribute to the variations in the water temperature in the mid-lower Yangtze River. However, meteorological measurements are sparsely distributed; notably, the nearest stations are approximately 2 km from the River. In addition, the response of the water temperature to the air temperature (Ta) can vary substantially over the course of a river. As such, distinguishing the water temperature changes due to the TGD or climate change is difficult and warrants further study. Nonetheless, we simply used ΔT, defined as the water temperature minus the air temperature, to limit the effects of climate change. Normalizing for this Ta gradient (figure S6a), we found that the ΔT exhibited a cooling trend along the mid-lower Yangtze River, especially a marked cooling trend between the TGD and area 260 km downstream (figure S6c), and the trend was the same as that for Tw as shown in figure 2(a).
In addition, ΔT and Q were negatively correlated at the YC, HK, and DT stations (ANOVA, P < 0.001, figure S7). When comparing the regression lines of ΔT–Q relationship at the three hydrological stations, the slope values were approximately the same in both the pre- and post-TGD periods at both the HK and DT stations, and only the intercept values increased in the post-TGD period, but both the slope and intercept values at the YC station were altered. Therefore, the ΔT–Q relationships in the pre- and post-TGD periods exhibit substantial differences at the YC station immediately downstream of the TGD; however, the difference has narrowed at the HK and DT stations downstream of the dam. Therefore, these results would indicate that the change in Tw is predominantly influenced by alterations in the water level and river discharge under TGD regulation.
3.4. Benefit of using MODIS-based water temperature and possible limitations
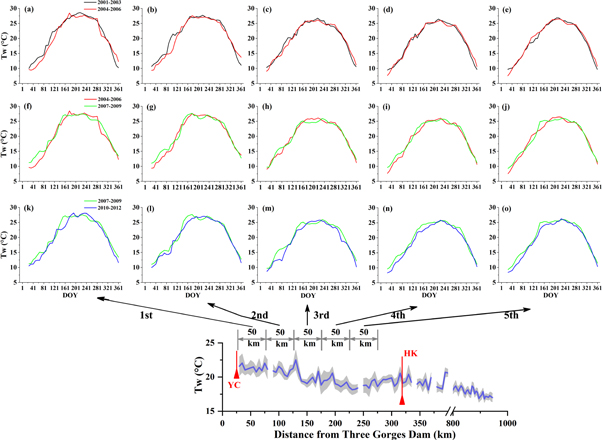
As shown in section 3.1, decadal longitudinal profiles of continuous river temperatures with negligible time differences across a wide spatiotemporal scale (here ∼1000 km) can be obtained via MODIS, and the relatively high twice-daily temporal resolution allows MODIS to provide abundant temperature data. Figures 2 and 3 provide spatiotemporally continuous Tw datasets that could not be obtained from discrete gauge stations. In addition, by using such a temperature dataset, the temporal variations for a given lateral profile can be analyzed. Figure 5 shows an example of interannual Tw change in different TGD periods downstream of the TGD within approximately 260 km, and it can be clearly seen that the temperature differences decreased moving downstream from 2001 to 2006 (figures 5(a)–(e)).
Figure 5. Comparison of interannual water temperature (Tw) for 5 consecutive sections with a length of 50 km each in different periods downstream of the TGD: the 1st to the 5th columns represent the 1st to the 5th sections, respectively, whereas the top, middle, and bottom panels represent comparisons between pre-TGD (2001–2003) and TGD I (2004–2006), TGD I and TGD II (2007–2009), and TGD II and TGD III (2010–2012), respectively. Note: the original temperature datasets were averaged using a 32 d moving window.
Download figure:
Standard image High-resolution image
To the best of our knowledge, this study is the first to use decadal MODIS data to assess inland river temperatures, although these data have been applied to assess inland lakes. However, it should be noted that MODIS data can be influenced by clouds and precipitation. Additionally, although there is only one large tributary (Hangjiang River) in the middle Yangtze River and no large tributary in the lower basin, the mainstream temperature may be affected by an entering tributary or the two large lakes (Dongting and Poyang) interconnected with the Yangtze River; however, these effects could not be assessed here using 1 km resolution MODIS data. The relatively coarse MODIS data may result in uncertainty in the information captured for inland rivers. First, the river pixels depend on the annual MCD12Q1 dataset, and as a result, the 'water' pixels were constant year round; however, land (floodplain) may appear due to low flows. If so, the floodplain would lower the purity of the water pixels (or enhance mixing) and thus might increase the uncertainty in the water temperature of the pixels. Second, the remotely sensed temperature (i.e. radiant water temperature) is an instantaneous measurement of the water surface, but it might not represent the temperature of the entire water column (kinetic water temperature). Here, the MODIS river temperature has an uncertainty of approximately 1.6 °C based on the mean absolute error (or <0.4 °C in mean difference (MF)) and 2.1 °C based on the root mean square error (RMSE) (figure S8), which are similar to the results published for inland lakes, e.g. 0.2 °C–0.9 °C (MF, Wan et al 2002), 0.41 °C ± 0.40 °C (MF ± standard deviation) (Reinart and Reinhold, 2008), 0.27 °C ± 2.26 °C (MF ± RMSE) (Sima et al 2013), 0.63 °C ± 1.34 °C to 1.53 °C ± 1.82 °C (MF ± RMSE) (Liu et al 2015). The errors may be caused by the spatiotemporal mismatch between MODIS pixels (scanning time at 1 km) and hydrological measurements (approximately 8 AM at a point). Additionally, MODIS LST datasets are reliable over relatively homogeneous areas such as waterbodies (Wang and Liang, 2009), and the mid-lower Yangtze River typically has a width of 1–3 km (Chen et al 2001b), which may reduce the uncertainty of results at a coarse resolution (Handcock et al 2006). Figure S9 shows that the change in the retrieved MODIS Tw was significantly different from the changes in nearby land areas. Therefore, combined with the analysis of long-term hydrological observations, remotely sensed water temperature data could provide a new perspective on the alterations in the hydrological cycle under regulated conditions.
4. Conclusions
In conclusion, the TGD significantly influenced the water temperature of the river within approximately 260 km downstream of the TGD. The water temperature and water cycle of the mid-lower Yangtze River were mainly affected by the combination of the water level and river discharge under the operation of the TGD, especially during the impoundment when the water level was relatively high and discharge was small.
Acknowledgments
This study was financially supported by the National Natural Science Foundation of China (41671416), the China Scholarship Council (No. 201606380186), and the National Key Research and Development Program of China (2017YFE0116500). Partial support for KTPU was from the National Science Foundation award EF1137306/MIT subaward 5710003122, the National Center of Atmospheric Research computing project UCDV0007 to the University of California Davis, and the United States Department of Agriculture National Institute of Food and Agriculture, Hatch project CA-D-LAW-4526H and Hatch/Multistate project CA-D-LAW-7214-RR. We also thank the China Meteorological Administration for providing meteorological data, the NASA Land Processes Distributed Active Archive Center (LP DAAC) for providing MODIS products, Dr Wang J D at Kansas State University for providing the TGD water level data shown in figure 1(e), and the editors and the anonymous reviewers for their insightful and constructive comments, which helped improve the quality of this work.
Data availability statements
The discharge and water temperature data observed at the gauge stations are not publicly available for legal reasons, although the data that support the findings of this study are available from the corresponding author upon reasonable request.