

Abstract
One near-term expression of climate change is increased occurrence and intensity of extreme heat events. The evolution of extreme heat risk in cities depends on the interactions of large-scale climate change with regional dynamics and urban micro-climates as well as the distribution and demographic characteristics of people who live and work within these micro-climate areas. Here we use California as a testbed where we employ a suite of high-resolution (1.5 km) future regional climate simulations coupled with a satellite-driven urban canopy model and a spatially explicit population projection to investigate the interacting effects of climate change, population growth, and urban heat mitigation measures, such as cool roofs, on exposure to extreme heat events. We find that climate change and population growth reinforce with one another to drive substantial increases in future exposure to heat extremes, which are poised to become more frequent, longer, and more intense. Exposure to events analogous to historic high-mortality extreme heat waves increases by 3.5–6 folds. Widespread implementation of cool roofs can offset a substantial fraction (51%–100%) of the increased heat exposure and associated building energy demand owing to climate change in urbanized regions.
Export citation and abstract BibTeX RIS
Climate-change projections suggest that, over the next few decades, extreme heat events will become more frequent [1, 2] and their impacts can be especially large in cities [3, 4] due to a high concentration of people and preexisting urban heat islands (UHIs) [5]. These impacts include heat-related mortality [6, 7] and morbidity [8], degraded air quality [9], mental health concerns [10], reduced worker productivity [11], and strain on energy infrastructure [12], which account for some of the most near-term impacts of climate change, raising the urgent need for cities to better understand extreme heat risk and their options for reducing it. An effective risk management paradigm is composed of three sets of indicators: climate hazards, vulnerability, and adaptive capacity [4]. Here we use California as a testbed where we apply such a paradigm by assessing the impacts of climate change on frequency, duration, and intensity of heat extremes (hazard), dynamics of population exposure to them (vulnerability), and the potential for heat mitigation measures to counter these increasing exposures (adaptive aspect).
Despite common claims that climate change will induce increased frequency, intensity, and duration of extreme heat events [13–15], only a few scientific studies have used physics-based climate modeling to examine future extremes at scales relevant to urban microclimates or population distribution within cities [16]. Moreover, while several studies point to increased future exposure to extreme heat events [17, 18], none consider how UHIs will exacerbate this exposure, nor how existing UHIs could be mitigated to reduce exposure and counteract global warming, which requires resolution of urban microclimatic processes [19, 20]. In the present study, we explore the interacting dynamics of climate change and population growth within a high-resolution (1.5 km) case study, focused on California cities, taking into account urban microclimates and population distribution at sub-city scales. We employ a customized and validated version of the Weather Research and Forecasting Model (WRF), enhanced by resolving urban canopy processes, using a urban canopy model (UCM), and satellite-based representations of land surface physical characteristics to dynamically downscale two climate change scenarios designed to bound a plausible range of mid-century warming in California (see Methods). The 'Hot' scenario is driven by a high global greenhouse gas (GHG) emissions scenario (RCP8.5) combined with a GCM known to produce greater than average levels of warming in the region. The 'Warm' scenario is driven by a more modest GHG emissions (RCP4.5) combined with a GCM known to produce less than average magnitudes of warming in the region. Our simulations use four nested domains to provide a detailed picture of heat extremes evolution with horizontal resolution of 4.5 km over the entirety of California and 1.5 km over the major metropolitan areas, including the San Francisco Bay Area, Sacramento, Los Angeles, and San Diego (supplemental figure S1 is available online at stacks.iop.org/ERL/14/084051/mmedia).
One of the most promising climate adaptation measures in urban areas is implementation of cool roofs which are designed to reflect more sunlight and absorb less heat relative to standard roofs. Extensive research has focused on the effectiveness of cool roofs in countering the effects of UHIs [21]. However, less attention has been devoted to the potential for cool roofs to roll back the impacts of climate change on the exposure to heat extremes. Here we leverage our urban canopy modeling capability, high-resolution population distribution, and county-level population projections to assess the potential for cool roofs to curb future extreme heat exposures in cities across California. For a realistic assessment of cool roofs efficacy, we use real-time domain-specific remote sensing data to accurately represent baseline urban surface albedo and use guidelines provided by the Environment Protection Agency (EPA) to define two commercially available types (i.e. commercial and residential) of cool roofs.
There is no unified definition of an extreme heat event [22]; typical definitions of extreme climate events consider either the exceedance over a universal threshold or low-probability (occurring between 1% and 10% [13]) events that diverge significantly from the typical occurrences at each location (i.e. exceedance over a local threshold). Ultimately, the definition of extreme heat events depends on their impacts in each sector. In this study, we primarily focus on 'universally' defined heat extremes. A universally defined extreme heat day is a day with maximum air temperature of 35 °C or higher, which is widely considered extreme in most locations across the United States [17, 23, 24]. Meanwhile, we are mindful that in the low-lying deserts of California such temperatures might be typical in the summer. Conversely, in the heavily populated coastal regions, such extremes are currently rare and significant health and energy impacts can be observed at lower temperature thresholds. Thus, we repeat our analysis for heat extremes that are defined relative to historical variability (locally defined heat extremes) in the supplemental information.
In our analysis, a heat wave consists of at least three consecutive extreme heat days. We further define a subcategory of heat waves—extreme heat waves—to reflect historically high-mortality heat waves, which account for a small percentage of heat waves but can have extraordinary health and mortality impacts [25]. Examples of high-mortality heat waves are the extended heat waves of 2006 and 2003 that led to 650 and 70 000 mortalities in California and Europe, respectively [26]. Our analysis and previous reports [26] show that one distinct characteristic of the 2006 California heat wave was its duration of 10 d. Thus, we define extreme heat waves as heat waves that are at least 10 d long. To further extend our impact assessment to the energy sector, we include cooling degree-days (CDD) [27, 28] in our analysis. Computed based on the cumulative daily deviations above 18 °C, this metric provides a measure of the energy required to maintain building temperatures below 18 °C.
Figure 1 presents future changes in the frequency, duration, and intensity (i.e. peak temperature) of heat waves under the 'Hot' and 'Warm' scenarios. We find that heat waves will generally become more frequent, longer, and hotter across most of the state by the mid-century, extending current heat prone regions (supplemental figure S2) from the Central Valley and deserts in the south east, closer to the Sierra Nevada mountains, coastal areas, and into major metropolitan areas. Our analysis of 29 major urban counties across the state shows a substantial increase in the heat wave frequency of 9%–996% and 8%–221% under the 'Hot' and 'Warm' scenarios, respectively (supplemental table S1). One exception is that low-lying deserts and some very hot regions in the Central Valley will experience less frequent but much longer and hotter heat waves. This shows that climate change not only increases the peak temperature of these heat waves (by 1.5 °C–3 °C), but also extends some of these heat waves to a point that they merge together, creating heat waves that are, on average, 4–9 d longer. Another abnormality is noticed over parts of the Bay Area and Los Angeles metropolitan areas that experience an increase in frequency but a decrease in duration and intensity of heat waves. These areas are not historically prone to heat waves (supplemental figure S2) and have experienced only rare but strong heat waves. Our projections indicate an increase in both moderate and strong heat waves, but a larger increase in moderate heat waves, which decreases the average heat wave duration and intensity.
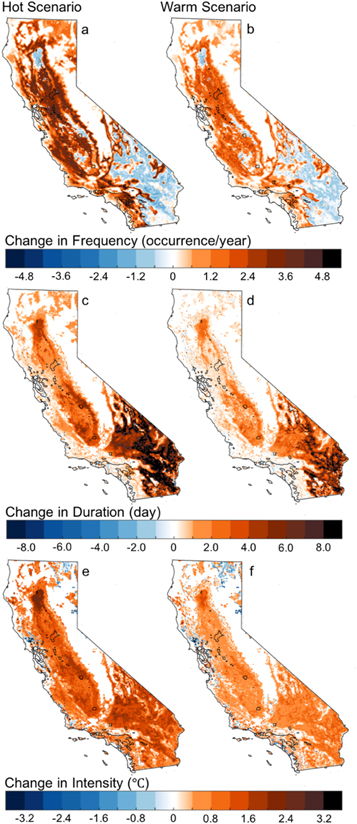
Figure 1. Spatial distribution of simulated mid-century climate-change-induced changes in frequency (a) and (b), duration (c) and (d), and intensity (e) and (f) of heat waves under the 'Hot' (a), (c), and (e) and 'Warm' (b), (d) and (f) scenarios across California. A heat wave consists of at least three consecutive days with maximum air temperature of 35 °C or higher. Values are calculated for the warmer months of June–October. Note that only changes that are statistically distinguishable from zero at 95% confidence interval are included.
Download figure:
Standard image High-resolution imageWe next use a spatially resolved current population density map of California (see Methods), to assess the impacts of climate change on population exposure to heat extremes and the potential for cool roofs to roll back these impacts (figure 2). Under the current climate, the aggregate annual state-wide urban population exposure to these heat waves is estimated around 37.3 million person-heatwaves per year, which for the most part consist of populations that do not benefit from the cooling effects of sea-breeze, such as in the Central Valley, Riverside, and San Fernando Valley. By the mid-century, heat wave exposure is projected to increase to 74.4 and 52.3 million person-heatwaves per year due to climate change under 'Hot' and 'Warm' scenarios, respectively (see supplemental table S2 for breakdowns). For both scenarios, exposure to the heat waves will intensify over areas that are prone to heat waves under the current climate. Furthermore, the populations in regions closer to the ocean that rarely experience heat waves under the current climate will start to have meaningful exposure to heat waves, particularly under the 'Hot' scenario. These areas include Santa Clara and Alameda counties, downtown Los Angeles, and Orange County. Disaggregated heat wave exposures to a range of durations and intensities (supplemental figure S3), indicate that climate change leads to the highest absolute exposure increases for moderate (i.e. shorter and less intense) heat waves as climate change exposes heavily populated regions to them. But, the highest percentage increase in exposures are for extreme heat waves. This is due to the fact that these extreme heat waves have been historically extremely rare and are becoming less rare due to the climate change. However, we note that our estimate for percent changes in these extremely rare events is less precise than for more moderate heatwaves due to the inherently smaller sample size for more rare events.
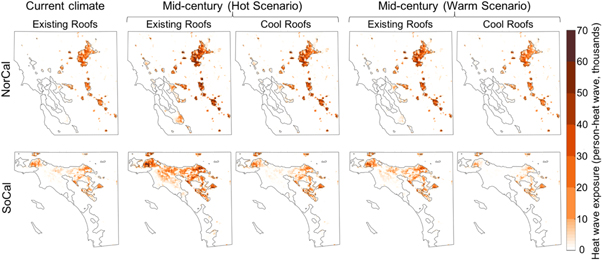
Figure 2. Spatial distribution of simulated annual population exposure to heat waves under the current climate as well as mid-century 'Hot' and 'Warm' scenarios with and without implementation of cool roofs for Northern California (NorCal) and Southern California (SoCal). A heat wave consists of at least three consecutive days with maximum air temperature of 35 °C or higher. Values are calculated for warmer months of June–October. Note that only changes that are statistically distinguishable from zero at 95% confidence interval are included.
Download figure:
Standard image High-resolution imageOur results show that cool roofs can be effective in reducing the impacts of climate change (by 63% and 115%), pushing back heat wave exposure to 50.9 and 35.0 million person-heatwaves per year for the 'Hot' and 'Warm' scenarios, respectively (figure 2 and table S2). With cool roofs, exposure under the 'Hot' scenario is reduced to a similar magnitude and spatial extent as in the 'Warm' scenario (50.9 million person-heatwaves). In the 'Warm' scenario, cool roofs push the exposure to levels less than the current exposure (35.0 million person-heatwaves).
Next, we consider the interaction of climate change with future population growth using a county-level population projection, consistent with the Special Report on Emissions Scenarios (SRES) A2 scenario [17] (see Methods), to assess the combined effects of climate change and population growth on exposure to heat extremes and the effectiveness of cool roofs in countering these effects (figure 3). We decompose the simulated exposure to evaluate the relative importance of climate change and population growth in driving future exposure. We isolate the role of each driver by recalculating exposure while holding the other factor constant. We also include an interaction component which represents the exposure of the new population to the effects of climate change.
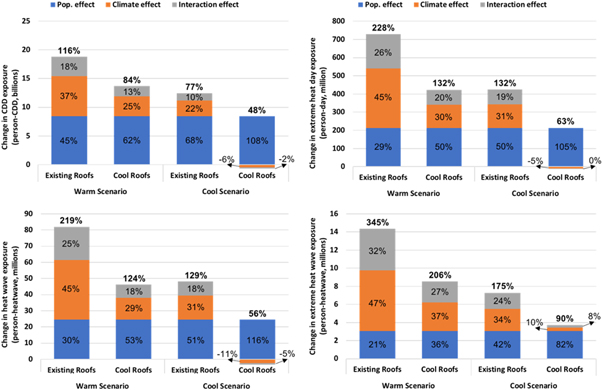
Figure 3. Simulated state-level change in annual urban population exposure to cooling degree-days (CDD) and heat extremes due to population growth, climate change, and their interaction effect. Values on top of the bars represent the total change in population exposures in percentages. And, the values inside the bars show the relative contribution of each component to the total changes. An extreme heat day is a day with maximum air temperature of 35 °C or higher. A heat wave (extreme heat wave) consists of at least three (ten) consecutive extreme heat days. Values are calculated for warmer months of June–October. Note that only changes that are statistically distinguishable from zero at 95% confidence interval are included.
Download figure:
Standard image High-resolution imageWe find that climate change, under the 'Hot' scenario, combined with population change doubles the CDD exposure (figure 3) with potentially serious consequences for energy demand and strain on energy infrastructure [12]. Exposures to extreme heat days, heat waves, and extreme heat waves are increased by 228%, 219%, and 345%, respectively. Spatial patterns of these exposures (supplemental figures S4–S11) show that the more dramatic exposures, to extreme heat days, heat waves, and extreme heat waves, are in part due to extension of heat extreme reach to areas within the major metropolitan areas (e.g. Los Angeles and the Bay Area) that are not prone to such heat extremes under the current climate.
In agreement with a previous study [17], our analysis shows that population growth and climate change play interactive roles in driving future heat exposure (figure 3). While the first order effect of population growth is constant in an absolute sense across scenarios for a given metric, its relative importance and contribution to an 'interaction effect' depends substantially on the heat metric and climate scenario. Population growth has the dominant effect on driving future exposure to CDDs, accounting for 45% and 68% of exposure increases for the 'Hot' and 'Warm' scenarios, respectively. Under the 'Warm' scenario, population growth also plays a dominant role in defining future exposure to heat extremes. Under the 'Hot' scenario, climate change is the dominant factor driving future exposure to extreme heat days, heat waves, and extreme heat waves. Interaction effects between climate change and population growth are also highest in the 'Hot' scenario across all metrics.
In all cases, cool roofs proved to be effective in offsetting the increasing effects of population and climate change on future heat exposure. We find that cool roofs reduce the effects of climate change, under the 'Hot' scenario, by 51%–64% to the 'Warm' scenario levels. And for the 'Warm' scenario, they nearly eliminate the impacts of climate change. Cool roofs are the most effective in reducing future exposure to heat waves (44%–56% reduction) and are least effective for exposure to CDDs (27%–38% reduction). In agreement with previous studies [29, 30], our results show that cool roofs are most successful in major metropolitan areas where there is more roof area available for implementation (supplemental figures S4–S11).
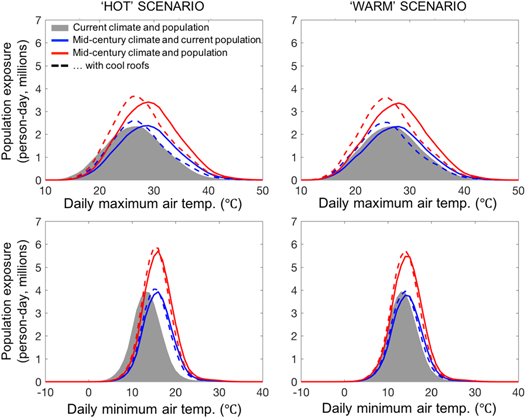
Our analysis indicates that while cool roofs can significantly offset heat wave exposures as defined by daytime maximum temperature, the effect of cool roofs on nighttime temperatures is more minimal (figure 4). Climate change results in a shift in the population exposure distribution towards higher daily maximum (minimum) temperatures, by 2.2 °C (2.5 °C) and 0.9 °C (1.0 °C) for the 'Hot' and 'Warm' scenarios, respectively. Cool roofs are able to offset much of the increased daytime heat exposure and also result in a slight decrease in the variance of the daytime exposure distribution, but have little effect on increased nighttime heat exposures. The ineffectiveness of cool roofs in reducing nighttime temperatures is an important limitation of this heat mitigation strategy, especially from a public health point of view as nocturnal temperatures play an important role in the health impact of extreme heat events. Hotter nighttime temperatures reduce the individuals' ability to recover from the daytime heat, which increases vulnerability to heat-related stress in subsequent days [31].
Figure 4. Simulated state-level annual population exposure to daily maximum and minimum temperatures under the current climate as well as mid-century 'Hot' and 'Warm' scenarios with and without implementation of cool roofs across California. Values are calculated for warmer months of June–October.
Download figure:
Standard image High-resolution image
Our analysis of locally defined heat extremes (supplemental figures S12–S22 and tables S3, S4) shows that the impacts of climate change on heat extremes and their spatial distribution depend fundamentally on the definition of the extremes, which in turn depends on the impacts of interest within different sectors (e.g. health, energy, infrastructure, etc). We find that impacts of climate change on exposure to locally defined heat waves are substantially greater than those for universally defined heat waves, and these impacts are greater over coastal regions such as Los Angeles and San Diego that showed little increase of universally defined heat waves. At the same time, cool roofs are more successful in countering effects of climate change for locally defined heat waves, compared to universally defined heat waves.
This study provides a robust, spatially resolved account of the evolution of extreme heat risks across California and the potential for cool roofs to offset them. Our results demonstrate that cities across the region will experience a pronounced increase in population exposure to extreme heat events, driven by interacting effects of greenhouse-gas forcing and population growth. By resolving urban climate processes and using dynamical downscaling of global climate forcing, our results embed the urban micro-climate dynamics, including UHI effects, and their response to the changing climate. We find that climate change will expose large populations in coastal regions to uncharacteristic heat extremes while also exacerbating exposure in regions already prone to extreme heat. We show that currently rare high-mortality heat waves, such as the 10 d 2006 heat wave, will become more frequent, impacting a substantially larger (by 3.5–6 folds) population. At the same time, we show that cool roofs offer a promising means to mitigate the effect of climate change on heat wave exposure, particularly over major metropolitan areas, having an effect of equivalent magnitude to switching from our 'hot' to 'warm' scenario, which represent the upper and lower bounds of the plausible range of mid-century warming in California, respectively. However, cool roofs' effect on nighttime temperatures is much less significant and more work is needed to understand the differential effect of climate change and heat mitigation measures like cool roofs on the specific characteristics of heatwaves and their relationship to public health outcomes.
Methods
WRF-UCM modeling system
We use WRF (version 3.6.1) [32, 33], a state-of-the-art, fully compressible, non-hydrostatic, mesoscale numerical weather prediction model. WRF is coupled with an UCM [19, 20], which accounts for three-dimensional nature of urban land surfaces and resolves surface energy balance and wind profile over built surfaces as well as shadowing, reflections, and trapping of radiation within urban canyon [34]. We configure WRF-UCM over four two-way nested domains with horizontal resolution of 13.5 km (domain 1), 4.5 km (domain 2), 1.5 km (domain 3), and 1.5 km (domain 4), and each with 30 levels in the vertical. Domains 3 and 4 cover major metropolitan areas in Northern and Southern California, respectively, including San Francisco, Sacramento, Los Angeles, and San Diego (supplemental figure S1).
The parametrizations that represent physical processes in our model include the Morrison double-moment scheme [35] for microphysics, the Dudhia scheme [36] for shortwave radiation, the Rapid Radiative Transfer Model [37] for longwave radiation, University of Washington (TKE) Boundary Layer Scheme [38] for the planetary boundary layer, Grell–Freitas scheme [39] for cumulus parameterization (domains 1 and 2 only), and the Eta Similarity scheme [40] for the model surface layer.
We use high-resolution (30 m) National Land Cover Data (NLCD) [41] for an accurate representation of urban type, which in turn defines the urban surface physical characteristics of each urban grid cell. We also use the high-resolution (30 m) NLCD impervious surface data [42] to define impervious (or urban) fraction, which divides each urban grid cell into pervious (undeveloped/vegetated) and impervious (developed) fractions. We further integrate the National Urban Database and Access Portal Tool [43] dataset in our modeling framework for an advanced domain-specific morphology of urban surface where the data is available.
Given the important role of sea-surface temperature (SST) fluctuations in shaping the climate of coastal cities, we incorporate in our modeling framework a daily SST product (RTG_SST) produced by the National Centers for Environmental Prediction/Marine Modeling and Analysis Branch (NCEP/MMAB).
Satellite-based representation of land surface in WRF-UCM
A recent study [44] reported that WRF-UCM simulations can benefit from replacing the default representation of land surface physical characteristics based on climatological information and tabulated values with satellite-based real-time information. To improve the model performance and capture the current climate with high accuracy, we incorporated MODIS-based real-time domain-specific monthly maps of green vegetation fraction (GVF), leaf area index (LAI), and albedo in our WRF-UCM modeling framework. We acquire, re-project, re-grid, and incorporate MODIS vegetation indices (MOD13A3), fraction of photosynthetically active radiation (MCD15A3) and reflectance (MCD43A3) products in WRF-UCM framework for an improved representation of GVF, LAI, and albedo, respectively, over our four domains. For details on how satellite information is interpreted for pervious versus impervious surfaces over urban areas and figures of the default and improved maps of GVF, LAI, and albedo see a recent study by the authors [29].
WRF-UCM simulations
We design five series of WRF-UCM simulations to represent the impacts of climate change on the regional and local climate in our domains. One Control scenario, two future climate scenarios, and two future climate scenarios with cool roofs. For each scenario, 15 WRF-UCM simulations are conducted from 20 May, 0700UTC to 31 October, 0700UTC over 2001–2015, covering the warmer months of the year, June–October and a spin-up of 10 d. The Control scenario represents the current climate by dynamically downscaling the North American Regional Reanalysis (NARR) dataset [45]. The 'Hot' scenario is driven by the HadGEM2-ES GCM and RCP8.5 to represent the warmest mid-century climate state for California that is realistically possible. The 'Warm' scenario, on the other hand, represents the coolest mid-century climate state, driven by the CNRM-CM5 GCM and RCP4.5. HadGEM2-ES and CNRM-CM5 are identified by California's Fourth Climate Change Assessment (www.ClimateAssessment.ca.gov) as the 'warm' and 'cool' models, respectively, that together span the temperature changes from the 10 GCMs that most closely simulate California's climate. The evaluation of GCMs in this assessment is based on analysis of statistically downscaled (LOCA) projections and a method [46] involving ranks of metrics relevant to climate concerns in California. The metric with the highest weight, in this analysis, is average summer daily maximum temperature which corresponds to the main metric used in the current study.
To downscale these GCMs for the 'Hot' and 'Warm' scenarios, we follow a well-established approach [47–51] where a climate change perturbation is introduced to the NARR reanalysis used in the Control scenario. The perturbation is the difference in the GCM monthly climatology between the mid-century (2035–2064) minus the historical (1993–2022) periods. The climate change signal is calculated for two-and-three-dimensional variables including sea surface temperature, surface temperature, air temperature, relative humidity, wind, geopotential height, and air pressure. The perturbations are applied to the initial, surface (SST), and lateral boundary conditions. This downscaling approach is beneficial in that the treatment of the surface and lateral boundary conditions reduces the potential for climate model bias to be introduced from the GCMs to WRF, relative to the 'direct downscaling' approach in which boundary conditions are taken directly from GCMs. In addition, by using perturbed reanalysis as boundary conditions for the climate change simulations, this approach allows us to consider how mean climate change could alter heat extremes separately from changes in climate variability, since the 2001–2015 period is used as the baseline for boundary conditions in both the Control and the Hot and Warm future scenarios. For the mid-century climate simulations, we further modified GHG concentrations in the WRF modeling framework to reflect radiative forcing in the corresponding RCP scenarios.
To represent widespread deployment of cool roofs, we next repeat the 'Hot' and 'Warm' scenarios with increased roof albedos used for all the building in the urban areas. Note that the baseline simulations use MODIS-based domain-specific albedos. We use two types of cool roofs that represent cool roofs commercially available for industrial/commercial and residential buildings. The cool roof albedos of 0.85 and 0.60 for commercial/industrial and residential buildings, respectively, are based on the EPA Energy Star roof product list (http://downloads.energystar.gov/bi/qplist/roofs_prod_list.pdf?8ddd-02cf). An albedo of 0.85, used for commercial/industrial, represents the highest achievable coating-based cool roof albedo. We use a less aggressive albedo increase for residential cool roofs to account for aesthetic preferences of the residents. It is noteworthy that the albedo values of cool roof coating account for three years of wear and tear.
We use the two-sided Student's t test to evaluate the statistical significance of the reported changes, relative to natural variability of the climate system and model internal variability. We consider daily variations in each grid cell for multiyear simulations and include only statistically significant signals with a 95% confidence level in our results.
WRF-UCM sensitivity to the initial conditions
A recent study [29] assessed the initial condition sensitivity of the WRF-UCM configuration used in the current study. They used three ensemble members with different starting dates for the Control scenario and concluded that climate of regions of interest in this study are dominantly controlled by large-scale atmospheric circulation patterns and are not significantly affected by initial conditions.
Model validation
We validated the model performance in predicting daily mean and maximum air temperature as well as extreme heat days (days with maximum air temperature of at least 35 °C) against ground observations from 64 stations in the National Climatic Data Center network over urban areas for June–October of 2001–2015. To account for the inevitable inconsistency between the grid cell-level (1.5 km × 1.5 km) model predictions and point measurements by the ground stations, we average the observations from all the stations and compare it with the average of model predicted values from the grid-cells corresponding to the stations. Our analysis shows as exceptional WRF-UCM performance, predicting daily mean and maximum temperatures with RMSDs of 1.1 °C and 0.4 °C, respectively (supplementary figure S23). The model also successfully reproduces the number of extreme heat days (supplementary figure S24). WRF-UCM predicts an average of 13.2 (±1.5) extreme heat days per year versus the ground measurements of 14.8 (±1.6) extreme heat days per year.
It is noteworthy that our model uses a sophisticated urban irrigation scheme [26, 52] which is evaluated against ground-based measurements of evapotranspiration and irrigation water consumption data. The irrigation scheme and its validation analysis are presented in detail in a recent study by the authors [29].
Population data
The Integrated Climate and Land-Use Scenarios project has developed population projections that are consistent with the Intergovernmental Panel on Climate Change SRES social, economic, and demographic storylines [53, 54]. These storylines are adapted to the United States and reflect US Census Bureau population and migration projections. Population projections are based on a demographic model which is composed of five components including fertility, mortality, domestic in-migration, domestic out-migration, and net international migration, which are calculated using a cohort-component model and a gravity model. From the resulting county-based population projections, we use one primary projection, the A2 scenario, which reflects medium/high aggregate population growth across the United States and a medium migration flow.
We assumed constant sub-county population distributions, based on the fourth version of the Gridded Population of the World (GPWv4) which reflects national population data from the 2010 round of Population and Housing Censuses [55].
Data availability
The source code and documentation for the WRF model source code can be found at http://www2.mmm.ucar.edu/wrf/users/. All the remote sensing data referenced in this study can be accessed from the US Geological Survey (USGS) National Center for Earth Resource Observations and Science (EROS) website at http://earthexplorer.usgs.gov. Other relevant data are available from the authors per request.
Acknowledgments
The authors would like to thank Mac and Leslie McQuown for their generous support of this research. This research was supported in part by the US Department of Energy, Office of Science, as part of research in the Multi-Sector Dynamics, Earth and Environmental System Modeling Program, as well as the Regional and Global Modeling Analysis, Earth and Environmental System Modeling Program. This work was supported in part by previous breakthroughs obtained through the Laboratory Directed Research and Development Program of Lawrence Berkeley National Laboratory under US Department of Energy Contract No. DE-AC02-05CH11231. This research used resources of the National Energy Research Scientific Computing Center, a DOE Office of Science User Facility supported by the Office of Science of the US Department of Energy under Contract No. DE-AC02-05CH11231.
Author contributions
PV led study's design and analysis as well as writing of the paper. ADJ contributed to the study design, provided guidance and mentorship, and contributed to the text. CMP contributed to the future climate simulation design and the text.
Competing interests
The authors declare no competing financial interests.