

Abstract
Changes in precipitation totals and extremes are among the most relevant consequences of climate change, but in particular regional changes remain uncertain. While aggregating over larger regions reduces the noise in time series and typically shows increases in the intensity of precipitation extremes, it has been argued that this may not be the case in water-limited regions. Here we investigate long-term changes in annual precipitation totals and extremes aggregated over the world's humid, transitional, and dry regions as defined by their climatological water availability. We use the globally most complete observational datasets suitable for the analysis of daily precipitation extremes, and data from global climate model simulations. We show that precipitation totals and extremes have increased in the humid regions since the mid-20th century. Conversely, despite showing tendencies to increase, no robust changes can be detected in the drier regions, in part due to the large variability of precipitation and sparse observational coverage particularly in the driest regions. Future climate simulations under increased radiative forcing indicate total precipitation increases in more humid regions but no clear changes in the more arid regions, while precipitation extremes are more likely to increase than to decrease on average over both the humid and arid regions of the world. These results highlight the increasing risk of heavy precipitation in most regions of the world, including water-limited regions, with implications for related impacts through flooding risk or soil erosion.
Export citation and abstract BibTeX RIS

Original content from this work may be used under the terms of the Creative Commons Attribution 3.0 licence. Any further distribution of this work must maintain attribution to the author(s) and the title of the work, journal citation and DOI.
Introduction
Precipitation provides important water resources but in excess may lead to flooding and other damaging impacts such as soil erosion. Understanding and predicting changes in precipitation is therefore of high importance for the well-being of societies. These precipitation changes can be complex and changes in precipitation extremes, for example, may differ from changes in total precipitation (Allen and Ingram 2002, Pendergrass et al 2015, Donat et al 2016b).
The global hydrological cycle is expected to intensify in a warming climate, leading to increased precipitation (Allen and Ingram 2002, Durack et al 2012). However, this expected increase may be counteracted by effects related to increasing anthropogenic aerosol concentrations (Wu et al 2013). Extreme precipitation is expected to intensify with global warming in most regions of the world as a consequence of increased water-holding capacity of the atmosphere as described by the Clausius–Clapeyron relationship (Trenberth et al 2003, Pall et al 2007), but changes in atmospheric dynamics may also lead to regional decreases in precipitation extremes (Pfahl et al 2017).
Global observations do not yet indicate robust changes in total annual precipitation at the global scale (Trenberth 2011), in contrast to these theoretical expectations. For heavy precipitation extremes, however, increasing frequency and intensity have been reported based on globally averaged observations over the past century (Westra et al 2013, Donat et al 2016a). These observed increases are consistent with model simulations under increasing greenhouse gas forcing (Min et al 2011), and further increases are simulated for future climate conditions (Kharin et al 2013, Sillmann et al 2013b). The spatial patterns of change, however, are heterogeneous across datasets, and precipitation changes at local and regional scales remain uncertain (Fischer et al 2013, Pfahl et al 2017). Increasing intensity of heavy precipitation extremes has been documented, robust across observations and global climate models, when aggregating over the wet and dry regions of the world that were defined based on the climatological distributions of total and extreme precipitation (Donat et al 2016b, Bador et al 2018, Lehtonen and Jylhä 2019). There is, however, no standard definition for 'wet' and 'dry', and in particular dryness is often considered in a water availability sense as the difference of water supply through precipitation and atmospheric water demand through evapotranspiration (Thornthwaite 1948, Budyko 1974). It has been questioned whether increases in extreme precipitation can be observed when classifying dry regions according to their water availability, taking precipitation and evapotranspiration into account (Sippel et al 2017). It thus remains unclear how precipitation totals and extremes are changing in these arid regions where limited water availability may limit local contributions to precipitation.
Here we address this question by investigating total and extreme precipitation changes aggregated over regions defined by their climatological water availability, as suggested by Sippel et al (2017). We use all available datasets that reasonably allow analyses of long-term changes in daily precipitation extremes over global land regions. These include the most globally complete observational datasets of daily gridded precipitation and gridded precipitation indices calculated from daily station time series. These observations have limited coverage, in particular over some of the driest regions of the globe. We therefore complement the analyses using an ensemble of state-of-the-art climate model simulations, to overcome limited observational coverage and to analyze precipitation changes in future projections under increased global warming.
Data and methods
We use the globally most complete observational datasets that allow analysis of daily-scale precipitation extremes over the recent 60 year period 1951 to 2010. HadEX2 (Donat et al 2013b) and GHCNDEX (Donat et al 2013a) both provide a range of gridded precipitation and temperature indices. The indices are calculated from daily station observations before they are interpolated onto global grids of 2.5° × 3.75° (HadEX2) or 2.5° × 2.5° (GHCNDEX), respectively. Here we use two indices representing different aspects of precipitation amounts and intensity. PRCPTOT is the annual sum of all wet-day precipitation totals (using days with precipitation ≥1 mm d−1), and Rx1day is the annual-maximum daily precipitation. HadEX2 and GHCNDEX are based on different underlying station networks, and therefore their spatial coverages differ. To obtain the best possible spatial coverage of observed precipitation extremes, we merged both datasets following Dittus et al (2015). GHCNDEX was first remapped to the 2.5° × 3.75° grid of HadEX2 using a first-order conservative remapping scheme (Jones 1999). Since the spatial coverage of these datasets varies with time, we applied quality control to both datasets to minimize artificial variability from changes in coverage when spatially aggregating. This was done by masking grid cells that did not have at least 80% of valid data over the entire 1951–2010 period and in the first and last 10 years. The two datasets were then merged (referred to as MERGEDEX hereafter) by replacing masked values in GHCNDEX (for each grid cell and time step) with the HadEX2 value (when available).
We also use gridded daily precipitation fields provided by the REGEN dataset (Contractor et al 2019). REGEN interpolates station observations of daily precipitation totals covering the years 1951 to 2013 on global grids with a resolution of 1° × 1°. Two versions of REGEN are available: one that uses all available station records regardless of their length or completeness, and a second that uses only long-term stations with at least 40 years of quasi-complete records after 1951 (Contractor et al 2019). This second version has the purpose to reduce possible artifacts from a variable station network, but reduces the spatial coverage of input station data. The interpolated gridded fields are then masked to exclude any ocean areas, and land areas where gridded values are deemed unreliable due to locally insufficient support of data due to lacking station coverage and the kriging uncertainty (Contractor et al 2019). For this study, the PRCPTOT and Rx1day indices were calculated from the daily grids for both REGEN versions.
We complement the analysis of observed precipitation changes by using the precipitation indices calculated from the Global Climate Model (GCM) simulations that contributed to the Coupled Model Intercomparison Project Phase 5 (CMIP5; Taylor et al 2012). The PRCPTOT and Rx1day indices were calculated from daily climate model output from the historical runs (Sillmann et al 2013a) and future projections (Sillmann et al 2013b) following the RCP4.5 and RCP8.5 emission scenarios. We use simulations from 25 CMIP5 models (ACCESS1-0, ACCESS1-3, bcc-csm1-1, BNU-ESM, CanESM2, CCSM4, CMCC-CESM, CNRM-CM5, CSIRO-Mk3-6-0, GFDL-CM3, GFDL-ESM2G, GFDL-ESM2M, HadGEM2-CC, HadGEM2-ES, inmcm4, IPSL-CM5A-LR, IPSL-CM5A-MR, IPSL-CM5B-LR, MIROC5, MIROC-ESM, MIROC-ESM-CHEM, MPI-ESM-LR, MPI-ESM-MR, MRI-CGCM3, NorESM1-M). We used the simulation r1i1p1 for all models, except CCSM4 for which we used r6i1p1. We use a single simulation from each CMIP5 climate model to ensure equal weighting of all models in the ensemble averages, but we do not consider model independence (e.g. Abramowitz and Bishop 2015, Herger et al 2018). The choice of models was determined by the availability of daily precipitation for the historical and RCP8.5 simulations to cover the period 1951–2100. Note that no data for the RCP4.5 scenario simulation were available for CMCC-CESM, therefore for this scenario we only included 24 models in our analysis. For each run, we merged the corresponding historical (1951–2005) and future scenario (2006–2100) simulations to obtain a transient time series from 1951 to 2100. We used the pre-calculated CMIP5 precipitation indices available at http://www.cccma.ec.gc.ca/data/climdex, and all model fields were remapped to the 2.5° × 3.75° grid of the merged HadEX2/GHCNDEX data using a first-order conservative remapping scheme (Jones 1999). We further restrict our analyses to global land areas (where aridity can be reasonably defined), and therefore masked out ocean grid cells and high southern (south of 60 °S) latitude land regions. For comparing the climate model simulations to observations, we used data from the merged (historical + RCP8.5 simulations) period 1951 to 2010.
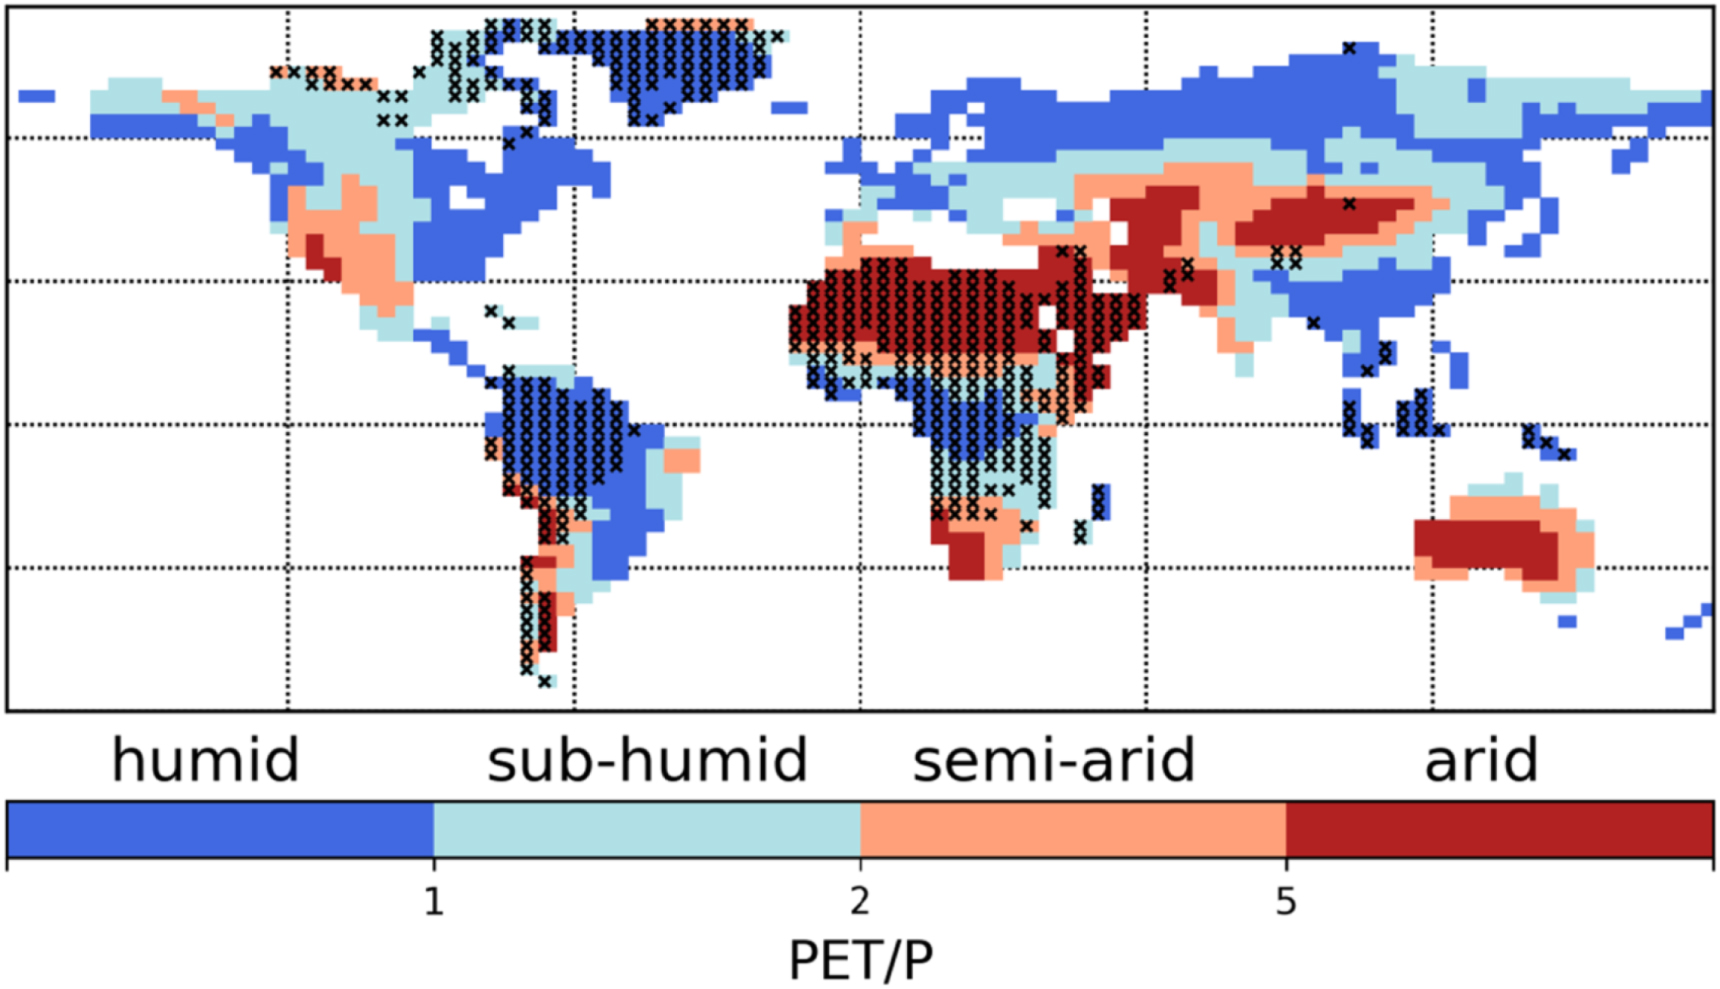
We classify wet and dry regions based on their climatological water availability using the aridity index (AI) defined as the ratio between potential evapotranspiration (PET) and precipitation (P): AI = PET/P. PET is calculated by the Priestley–Taylor method (Priestley and Taylor 1972) using the R package SPLASH (Davis et al 2017). Observed PET was calculated from monthly cloud cover and mean air temperature from the CRU TS 3.23 dataset (Harris et al 2014). For CMIP5 models, PET was calculated from monthly incoming shortwave radiation (converted to cloud cover using SPLASH) and mean air temperature for each model separately. Grid cells are the classified as humid (AI < 1), sub-humid (1 ≤ AI < 2), semi-arid (2 ≤ AI < 5), or arid (AI ≥ 5) (UNEP 1997, Ukkola et al 2016), see figure 1 and supplementary information (SI) figure S1 is available online at stacks.iop.org/ERL/14/065003/mmedia.

Figure 1. Global land regions classified by the local observations-based Aridity Index (AI). The AI calculated based on CRU was remapped to the 2.5° × 3.75° horizontal resolution of MERGEDEX. Crosses indicate grid cells where none of the observational datasets provide sufficiently complete data to investigate long-term changes in daily precipitation extremes (see Methods).
Download figure:
Standard image High-resolution imageThe observational AI was calculated from the 1951–2010 climatologies of PET and CRU TS 3.23 precipitation and subsequently remapped to the HadEX2 resolution. Similarly, we calculated AI separately for each model using the 1951–2010 PET and P climatologies (SI figure S2), to account for possible differences in the climatology between models and observations. For example, the ensemble mean of CMIP5 models was found to produce too much precipitation relative to gridded observations in dry areas and too little precipitation in wet areas (Lehtonen and Jylhä 2019). To account for possible spatial shifts in the aridity classifications with long-term warming we also calculate the aridity classifications over the years 2071–2100 in the future climate projections (SI figures S3, S4). We note that aridity in this study is treated as a relatively large-scale characteristic of climate, and it is possible that AI values may differ locally within a grid cell, in particular in regions with complex topography. Sensitivity of results to such potential small-scale variability in AI might be tested in future research, given quasi-global availability of required meteorological variables to consistently and reliably estimate PET at the station level.
To calculate area-average time series for the humid, sub-humid, semi-arid and arid regions, the local precipitation indices at each grid cell are first normalized by dividing the annual index values by the climatological mean over the 1951–2010 analysis period. This normalization prevents the area-averages being dominated by regions with higher (mean or extreme) precipitation. For analysis of future simulated changes, we normalize by the climatological mean over the longer 1951–2100 analysis period. We use long climatological periods for normalization, matching the analysis periods, to avoid possible bias from variance inflation when analyzing data outside of the reference period (Donat et al 2017, Sippel et al 2017). Area averages are weighted to account for latitudinal differences in grid cell sizes.
Temporal changes in the precipitation time series are investigated as mean differences between 30 year time slices. For past changes, the mean of 1981–2010 is compared to the mean of 1951–1980, and for future projected changes the mean of 2071–2100 is compared to the mean of 1951–1980. Statistical significance of the changes between the different 30 year periods was assessed using the Wilcoxon rank sum test. We chose these methods in order to avoid any assumptions regarding temporal linearity of changes, or normality of the distributions.
Results
The humid regions of the world are primarily located in the mid-latitudes and tropics, whereas most arid regions are in the subtropics and in continental interiors. The spatial coverage of the global observational datasets including information of daily precipitation extremes is limited (SI figure S1), but the limits in coverage vary between the different climatological zones (black crosses in figure 1 mark grid cells where none of the datasets provide sufficiently complete timeseries to investigate long-term changes in daily precipitation extremes based on the completeness criteria outlined above). While 76% of the global land areas classified as sub-humid and semi-arid are covered by the observational datasets, these datasets provide sufficiently complete time series to study long-term changes in daily precipitation extremes for only 67% of the humid and 46% of the arid land areas. For humid regions, coverage is poor in the Amazon, tropical Africa, and Greenland (black crosses in figure 1). For arid regions, the largest data gaps are over the Sahara and the Arabian Peninsula and the observations are representative for less than half of the arid areas globally.
Most CMIP5 models have their wet (humid and sub-humid) and dry (arid and semi-arid) regions at similar locations as observed, but there are also some differences (SI figure S2). For example, a number of models do not produce sufficiently humid conditions in tropical South America (including the IPSL and GFDL models, CanESM2 and CSIRO-Mk3–6–0) and tropical Africa (e.g. HadGEM2, MRI-CGCM3). On the other end of the spectrum, arid conditions are often not sufficiently simulated e.g. for Australia or the west coast of South America by a number of models (including the MIROC models, CCSM4, NorESM1-M). We take these inconsistencies between models and observations into account in our analysis of precipitation changes in the different regions, by analyzing changes in the models using both the observational (figures 2, 3) and the model-specific masks (SI figures S5, S6).

Figure 2. Time series of annual precipitation indices (left: PRCPTOT, right: Rx1day) in the different climatological regions. The coloured lines represent observational products, where REGEN (all) shows results for a dataset version using data from all stations and REGEN (long) using data only from long station records. The black line is the CMIP5 multi-model ensemble mean, and grey shading indicates the ensemble mean ±2 ensemble standard deviations.
Download figure:
Standard image High-resolution image
Figure 3. Long-term changes in (a) PRCPTOT and (b) Rx1day in the different climatological regions. For each region (humid, sub-humid, semi-arid, arid, separated by dashed vertical lines) the changes are shown relative to 1951–1980 for the second half of the historical period 1981–2010 (left of each quadrant), and future simulations for 2071–2100 following the RCP4.5 scenario (middle), and the RCP8.5 scenario (right). Top panels: changes in precipitation indices averaged over each region. Coloured markers represent the different observational datasets (only for historical changes), with solid markers indicating changes are significant (p≤0.05) based on the Wilcoxon rank sum test. Black boxes are the interquartile range of the CMIP5 ensemble, whiskers the 0.5–0.95 quantile range, and the orange lines the ensemble median. The numbers in brackets at the top indicate the count of models with significant increases (top row) and decreases (bottom row). Note we used RCP8.5 runs from 25 models and RCP4.5 runs from 24 models (see Data and Methods). Bottom panels: ratio of the number of grid cells with significant increases (p≤0.05 based on the Wilcoxon rank sum test) versus the number of significant decreases in each region. Coloured markers represent the ratios from the different observational datasets and black markers the ratios in the individual CMIP5 models. Markers for which the ratio would be infinity (i.e. that have zero grid cells with decreases) are placed on the horizontal line at ratio = 128.
Download figure:
Standard image High-resolution image
Time series of the precipitation indices over the historical period 1951–2010 show mostly consistent variability across the different observational datasets in all four regions as classified by their AI (figure 2). Both the inter-annual variability and the spread between models are smallest in the humid and sub-humid regions and largest in the arid regions (note the different y-axis scales for the different regions in figure 2).
These observational time series indicate significant increases in both PRCPTOT and Rx1day in the humid regions (figure 3, top panel). Mostly upward tendencies are also seen for both indices in the other aridity classes, however these changes are generally not significant (p>0.05) related to the larger variability in the drier classes. These observational results are consistent with results from the CMIP5 ensemble that show increases in PRCPTOT and Rx1day in the humid and sub-humid regions. This is indicated by positive ensemble mean changes and several models showing significant increases, while no model simulates significant decreases over the past 60 years (counts of models with significant changes are shown by the numbers in brackets at top of figure 3). For the semi-arid and arid regions, the observations generally indicate positive but non-significant changes. Similarly, the CMIP5 inter-model spread is larger than for the humid regions, but the majority of models and the ensemble mean indicate upward tendencies for both indices. For Rx1day, several models simulate significant increases over the semi-arid (11 models) and arid (3 models) regions over the historical period 1951–2010, while no model simulates significant decreases.
As discussed above, the analysis of observed changes is potentially hampered by the limited coverage of the global observational datasets, in particular in the arid and humid regions. We estimate the effect of the limited coverage by masking the models to the grid cells with sufficiently complete observational coverage (SI figures S7, S8; compared to figures 2, 3 which show results from complete model fields). Based on the models, the results using the limited observational coverage would lead to generally similar conclusions. For limited coverage, the model spread is smaller for Rx1day changes in all regions and the simulated changes tend to be smaller compared to full coverage. If this behavior was transferable to observations, then this would suggest that we might observe stronger increases in Rx1day aggregated over all four regions, given more complete observations.
In Summary, for both PRCPTOT and Rx1day there is a stronger tendency for increases than for decreases over the past 60 years in the wet and dry regions, but the signal-to-noise ratio is generally low over the semi-arid and arid regions, hampering robust detection of historical changes. Analysis of future climate simulations with stronger radiative forcing and accordingly stronger climate change signals indicates that the future simulated precipitation changes are mostly consistent with the past changes, but the analysed differences are larger and therefore mostly significant (figure 3).
The majority of models simulate significant PRCPTOT increases in the humid and sub-humid regions, with ensemble median increases of about 8% (RCP4.5) to 11% (RCP8.5) by the end of the 21st century relative to the mid-20th century. In the semi-arid and arid regions, there is a larger spread between model changes in PRCPTOT, with several models simulating significant decreases while others simulate significant increases. As such, the median changes are close to zero and the inter-quartile range of changes encompasses zero in these regions.
For Rx1day, all models simulate significant increases in the humid and sub-humid regions, with median increases of about 15% (RCP4.5) to 22% (RCP8.5) by the end of the 21st century. In contrast to PRCPTOT, most models also simulate Rx1day increases on average over the semi-arid and arid regions. The median increases are slightly weaker than for the more humid regions (semi-arid: 13% (RCP4.5) to 18% (RCP8.5); arid: 9% (RCP4.5) to 15% (RCP8.5) by the late 21st century). For the arid regions, the model spread is larger than for the wetter categories. Three models simulate significant decreases, while 12 (RCP4.5) and 16 (RCP8.5) models simulate significant increases, respectively. This indicates some inter-model uncertainty for Rx1day changes in the driest regions, but this uncertainty is smaller than for PRCPTOT changes.
The number of grid cells with locally significant increases or decreases (figure 3, bottom panels) indicates that the simulated local increases clearly outweigh the local decreases for both PRCPTOT and Rx1day in the humid and sub-humid regions. This ratio between local increases and decreases is more balanced for PRCPTOT in the arid regions, while most models still simulate more local increases than decreases in Rx1day also for the arid regions. For past changes, these ratios are generally consistent between observations and model simulations, but uncertainty between different observational datasets is particularly large for Rx1day in the arid regions. The two versions of REGEN show relatively balanced counts of locally significant increases and decreases, while all locally significant changes in MERGEDEX are increases.
The spatial patterns of the ensemble average future simulated changes show a mix of regional increases and decreases for PRCPTOT for all four aridity classes (SI figure S9). In contrast, for Rx1day the ensemble averages show almost exclusively increases for the humid, sub-humid and semi-arid regions. For the arid regions, the ensemble average shows regional decreases in the north and southwest of Africa, while most other arid regions also exhibit increases in Rx1day.
The precipitation and PET climatologies are biased in some models, so the aridity masks differ from observations (compare SI figures S1, S2). Accounting for these biases by using the model-specific masks for the four aridity categories leads to very similar results (compare figures S5 and 3). Also the spatial distribution of the different aridity regions may change in the future climate projections (Feng and Fu 2013). Accounting for this possible shift by restricting the analyses to grid cells that are common to both the past and future masks in each category shows that our conclusions are robust also to these possible changes (figure S6).
Discussion and conclusions
We study changes in annual precipitation totals and the annually most intense daily precipitation, aggregated over the world's humid, sub-humid, semi-arid and arid regions as classified based on the local AI as a measure of water availability. Observations indicate increases in both total and extreme precipitation in the humid regions over the past 60 years, but significant changes cannot be detected in the more arid regions where the signal-to-noise ratio is generally small. Future climate simulations show robust increases in precipitation totals and extremes in the humid and sub-humid regions. While the future simulations do not show clear changes in total precipitation in the semi-arid and arid regions, precipitation extremes are simulated to increase also in these drier regions.
The observational datasets are lacking spatial coverage over large parts of the humid and arid regions. In particular the analysis of observed changes in the arid regions represents less than half of the global arid land areas. However, comparing the climate model results masked to observational coverage and using complete (land) coverage, leads to generally similar conclusions. If anything, this comparison suggests that extreme precipitation increases may be larger if using complete coverage.
In any case, the limited observational coverage highlights the general need for more long-term high-quality observations of daily precipitation to fill data gaps in particular over Africa and South America. This is necessary to ensure that the observational analyses can be representative of all global land areas. Suitable data appear to be available from some regions (Barry et al 2018, Panthou et al 2018) and data sharing would enable these data to be included into the global datasets with relatively little effort. Dedicated data rescue activities (Brunet and Jones 2011) may further help to make observational data that have not yet been fully digitized, available for research purposes.
While this study confirms that precipitation extremes are increasing in most land regions (Ingram 2016), it also points to some sensitivity of the results when it comes to conclusions about regional changes. For example, when classifying wet and dry regions based on precipitation alone (defined based on the climatologies of annual precipitation totals and precipitation extremes), Donat et al (2016b) reported only small changes in total precipitation in the wet regions of the world—in contrast to the clear increases in both PRCPTOT and Rx1day in the humid regions presented here. On the other hand, Donat et al (2016b) presented robust increases in precipitation extremes also in their dry regions, whereas here when classifying regions by aridity, the intensification of precipitation extremes is less robust for the dry regions. This may in part be a consequence of the particularly sparse observational coverage in the arid regions, which may contribute to larger noise (and thereby a smaller signal-to-noise ratio when analyzing changes) (Fischer et al 2013) as data are aggregated over effectively smaller regions due to missing data. However, the intensification of extreme precipitation in the arid regions is also less robust in the (spatially complete) future climate projections, where 3 models simulate decreases by the end of the 21st century, opposed to 16 models simulating significant increases in the RCP8.5 scenario runs. While these numbers still indicate the probability for increases is five times larger than the probability for decreases based on the CMIP5 ensemble, no model simulated decreases in precipitation extremes averaged over the dry regions defined based on precipitation alone (Donat et al 2016b).
The spatial patterns of changes indicate that most locations in the humid, sub-humid and semi-arid regions are characterized by increases in extreme precipitation, while over arid regions there is a considerable number of grid cells showing decreases in Rx1day (supplementary figure S9). The finding of less robust changes in extreme precipitation averaged over the arid regions therefore also mirrors the compensation of some regional increases and decreases when spatially aggregating. The regional decreases are predominantly found in northern Africa, a zone of large-scale subtropical subsidence, suggesting that the regional decreases may be primarily caused by changes in atmospheric dynamics (Pfahl et al 2017), as opposed to the locally limited water availability.
The intensification of precipitation extremes in several arid regions further indicates that climatologically limited water availability does not seem to constrain the extreme precipitation changes in a warming climate. This may be because the climatological aridity classification does not necessarily reflect the water availability at the time of the event. We therefore investigated the average aridity conditions associated with the annual maximum precipitation events. The AI in the months when the precipitation extremes occur indicate generally wetter conditions than the climatological AI (SI figure S10). However, these wetter conditions may be a consequence of the extreme precipitation event, and the aridity conditions in the month preceding the precipitation extremes are generally similar to the climatological AI. If water availability prior to the precipitation extremes is limited in the arid regions, it may suggest that the increasing moisture necessary for the intensifying precipitation extremes is coming from remote moisture sources and transported to the arid regions through large-scale atmospheric flow. This suggests that changes in the annually most extreme precipitation events in the arid regions are not controlled by local water availability as described by the aridity measures.
In conclusion, this study highlights that precipitation extremes are likely to intensify in most global land regions in a warming climate. This intensification is most robust in the humid and sub-humid regions. Over the arid and semi-arid regions, the changes are more uncertain but the probability of intensification is substantially higher than the probability of a decrease. Individual locations, in particular in arid regions, may however experience changes to less intense precipitation extremes.
Acknowledgments
This study was funded by the Australian Research Council (ARC) grant DE150100456. MGD acknowledges additional funding by the Spanish Ministry for the Economy, Industry and Competitiveness Ramón y Cajal 2017 grant reference RYC-2017-22964; AMU acknowledges funding from the ARC Centre of Excellence for Climate Extremes (CE170100023). We thank the climate modeling groups contributing to CMIP5 for producing and making available their model output. CMIP5 data were obtained from the Australian node of the Earth System Grid Federation (ESGF), hosted at the National Computing Infrastructure (NCI).