

Abstract
Global warming has been shown to affect weather and climate extremes, such as droughts, floods, windstorms, cold waves, and heat waves. A number of studies have focused on the variability of different characteristics of these extremes, including their frequency, spatial extent, and severity. Recently, the study of compound extremes, defined by the co-occurrence of multiple events with extreme impacts, has attracted much attention. The compound dry and hot extreme is one type of compound extreme and may lead to detrimental impacts on the society and ecosystem. Most previous studies have focused on changes in the frequency or spatial extent of compound dry and hot extremes, while assessments of changes in the severity of compound extremes are lacking. This study evaluated changes in the severity of compound dry and hot extremes at the global scale, based on the Standardized Dry and Hot Index (SDHI). A significant increase in the severity of compound dry and hot extremes (or decrease of the SDHI value) during the warm season was found in western US, northern South America, western Europe, Africa, western Asia, southeastern Asia, southern India, northeastern China and eastern Australia. Moreover, a significant temporal increase in the average severity of the hottest month over global land areas was also observed. Results from this study highlight the increased severity of compound dry and hot extremes over global land areas and call for improved efforts on assessing the impact of compound extremes under global warming.
Export citation and abstract BibTeX RIS

Original content from this work may be used under the terms of the Creative Commons Attribution 3.0 licence. Any further distribution of this work must maintain attribution to the author(s) and the title of the work, journal citation and DOI.
1. Introduction
The increase of weather and climate extremes (e.g. drought, flood, heat wave, cold wave) has been shown to be associated with the climate change (IPCC 2012, 2013, Peterson et al 2012, Alexander 2016), which presents major risks for the ecosystem and the society. Drought and hot extremes are among the most detrimental extremes with impacts on agriculture, water availability, energy production, and human health (Mishra and Singh 2010, Deryng et al 2014, Zipper et al 2016, Añel et al 2017, Dosio et al 2018). Despite the ambiguity in the drought definition and limitations of data products, studies based on observations and model simulations have demonstrated increased frequency and severity of drought over global land areas (Dai 2011, Cook et al 2014, Trenberth et al 2014). Along with global warming, a robust increase in the frequency and severity of heat related extremes (e.g. heat wave, warm spells, and number of hot days) has been observed over most land areas in historical records and projected to continue in the 21st century based on model simulations (Perkins et al 2012, Coumou and Robinson 2013, Seneviratne et al 2014, Donat et al 2016). Assessments of the variability of the characteristics of drought and hot extremes provide useful information for the mitigation of extremes under global warming.
Compound extremes (or events) may lead to amplified impacts than may individual extremes (or events) and have received increasing attention in the past decade. A definition of the compound event (extreme) is given in the Special Report on Managing the Risks of Extreme Events and Disasters to Advance Climate Change Adaptation (SREX) as follows (Seneviratne et al 2012): '(1) two or more extreme events occurring simultaneously or successively, (2) combinations of extreme events with underlying conditions that amplify the impact of the events, or (3) combinations of events that are not themselves extremes but lead to an extreme event or impact when combined'. The compound events may result from contributing events either of the same or different type(s) that amplify the impact to the wildfire occurrence, agricultural production, vegetation growth, energy security and human health (Seneviratne et al 2012, Leonard et al 2014, Añel et al 2017, Zscheischler and Seneviratne 2017). Notable occurrences of compound dry and hot extremes include the 2003 European heat wave and 2010 Russia heat wave that were all accompanied by serious drought conditions (Miralles et al 2014, Russo et al 2015), which led to huge losses to the society and ecosystems. For example, the summer 2010 caused an estimated 55 000 deaths, a drop of 25% annual crop production and more than 1 million hectare burned areas in Russia (Barriopedro et al 2011). The past decade has witnessed a surge in the study of compound dry and hot extremes in terms of their causative mechanisms, variabilities and impacts (Zscheischler and Seneviratne 2017, Hao et al 2018). For example, Beniston (2009) analyzed the trend of the joint quantile of precipitation and temperature in Europe and found a significant increase in warm/dry events. Meanwhile, a number of studies on the frequency or spatial extent of different compound drought and hot extremes have demonstrated its increased risk under global warming (Hao et al 2013, Mazdiyasni and AghaKouchak 2015, Sharma and Mujumdar 2017).
The impact of a compound dry and hot extreme is defined not only by its frequency but also its severity. Thus, measuring and evaluating the severity of the compound dry and hot extreme is critical for mitigating its adverse impact (Hao et al 2018). Though a variety of studies have been devoted to the variability of the frequency and spatial extent of compound dry and hot extremes, there is still a lack of detecting changes in the severity of compound extremes. The objective of this study therefore is to evaluate changes in the severity of compound dry and hot extremes over global land areas. A standardized index was first defined to measure the extremeness of a compound dry and hot extreme. Spatial and temporal changes in the severity of compound dry and hot extremes over global land areas were then assessed.
2. Method
To evaluate the severity of a compound dry and hot extreme, a suitable measure is needed. Intuitively, a low value of precipitation (P) relative to the local climatology indicates dry condition and a high value of temperature (T) relative to the local climatology implies hot condition. An intuitive derivation of the severity measure (X) of the compound dry and hot extreme (or event) would then be X = P/T, with lower values indicating a more severe condition. Similar concepts of P/T or its variations (e.g. P/(T + 10)) have been defined in previous studies as a measure of aridity (Quan et al 2013).
In characterizing an extreme (e.g. drought), the percentile of a variable (or its standardization) is of particular interest to measure the extreme in a relative manner (Zhang et al 2011, Steinemann et al 2015). Thus, to incorporate the comparative status of both moisture and heat condition, we define a matrix X = G1(P)/G2(T), where functions G1(P) and G2(T) are the marginal probability distribution functions (or percentiles) of precipitation and temperature, respectively. From the definition, lower values of X represent low ratios of precipitation percentiles to temperature percentiles relative to the local climatology and indicate more severe conditions of the compound dry and hot extreme (event). To aid the spatial comparison, we standardize X based on the concept of deriving the standardized precipitation index (SPI) (McKee et al 1993), in which a marginal cumulative distribution F is first fitted and then the standardization is performed, based on the standard normal distribution Φ. We term the index as Standardized Dry and Hot Index (SDHI), which can be expressed as:

Note that this standardization procedure has been applied to a variety of variables to derive the extreme index, including the Standardized Temperature Index (STI) (Zscheischler et al 2014) based on temperature and the Standardized Precipitation Evapotranspiration Index (SPEI) based on precipitation minus potential evapotranspiration (Vicente-Serrano et al 2010). In computing the SDHI, there are three marginal distribution functions (i.e. G1, G2 and F) that need to be fitted. We use an empirical method based on the Gringorten plotting position formula (Gringorten 1963) to compute the marginal distributions (i.e. P = (i − 0.44)/(n + 0.12), where i is the rank and n is the length of observations). Similar to the commonly used SPI, low or negative values of the SDHI indicate severe conditions of the compound dry and hot extreme. Traditionally, the thresholds −0.5, −0.8, −1.3, −1.6 and −2.0 have been used to define severity levels of drought (i.e. abnormally dry, moderate drought, severe drought, extreme drought, and exceptional drought) in the US Drought Monitor (USDM) based on the individual drought indicator (e.g. SPI) (Svoboda et al 2002). Since SDHI is also a standardized indicator computed in a similar way to SPI, these thresholds can also be adopted to define different severity levels (from the least intense to the most intense level) of compound dry and hot extremes. The SDHI (without unit) can then be used to measure the severity of a compound dry and hot condition.
3. Data and results
3.1. Data
The gridded monthly precipitation and temperature data at a 0.5° resolution, which were obtained from the Climatic Research Unit (CRU TS v. 3.25) of the University of East Anglia (http://cru.uea.ac.uk/data) (Harris et al 2014), were used in this study. We performed the compound dry and hot extreme analysis based on the data after 1951 during which a relatively large number of gauges were available to generate the datasets. Since our focus is the compound dry and hot extreme, we focus on the warm season over global land areas. Following Zscheischler and Seneviratne (2017), the warm season for each grid point over global land areas is defined as the hottest three-month period in the local temperature climatology. For each grid point, we first obtain the average precipitation and temperature of the hottest three months (or the warm season) and then compute the SDHI for the warm season based on equation (1).
3.2. Illustration of the index
In the recent decade, a variety of compound dry and hot extremes (events) occurred in different regions around the word, including the 2003 European heatwave and 2010 Russian heat wave accompanied by drought (Miralles et al 2014). The SDHI series during the warm season for two regions in southern France (5–8 °E, 43–46 °N) and western Russia (47–50 °E, 52–55 °N), which have been struck by the heat wave accompanied by drought during the summer 2003 and 2010, respectively (Otto et al 2012, Russo et al 2015), based on the regional average precipitation and temperature are shown in figure 1. The individual indices of SPI and STI for the warm season were also computed in a similar way (i.e. based on the Gringorten plotting position formula) and shown for comparisons in figure 1. Usually the SDHI value is low when the SPI value is low with concurrent high STI values, indicating the basic properties of SDHI in combining the status of both drought and hot conditions. The reason is that relatively low precipitation and high temperature will lead to low G1(P) and high G2(T) with respect to the local climatology, resulting in the low value of G1(P)/G2(T) (and thus low values of SDHI). For example, the value of SPI for the warm season during 2003 and 2010 was extremely low and that of STI was extremely high during the same period, implying severe drought and hot conditions. The SDHI values for the two periods were the lowest (−2.38) for the period 1951–2016, indicating the severe condition of the compound dry and hot extreme. Since these indices were computed based on the empirical method, the coincidence of the peak values (−2.38) of SDHI and SPI values during 2010 was observed (since the dry condition and compound condition is most extreme in historical records). Overall, the two compound events during 2003 in southern France and 2010 in western Russia are clearly shown from figure 1.

Figure 1. Series of three indices (SPI, STI and SDHI) during 1951–2016 at two regions in southern France (a) and western Russia (b), along with the scatter plot of the SPI and STI in southern France (c) with the marker size specified by absolute values of the SDHI (orange for negative SDHI value and light green for positive SDHI values).
Download figure:
Standard image High-resolution imageTo further illustrate the property of the SDHI, we show the scatterplot of the SPI and STI during the warm season in southern France (5–8 °E, 43–46 °N) in figure 1(c), in which the marker size is represented by the absolute value of the SDHI. Overall, the low SPI and high STI value corresponds to negative values of the SDHI. For example, the point in the upper left quadrant representing the compound dry and hot extreme in 2003 corresponded to exceptional low SPI and high STI values. Note that several points with negative SDHI value in the supper right quadrant corresponded to positive SPI values and positive STI values. This indicates that though no drought conditions were shown from SPI, the combined condition from SPI and STI may still leads to compound dry and hot condition (i.e. negative SDHI values). This shows an interesting property of SDHI to characterize the compound extreme resulting from combinations of events that may not be extremes themselves. These results imply that the SDHI provides a useful measure of the severity of a compound dry and hot extreme.
3.3. Spatial changes of severity
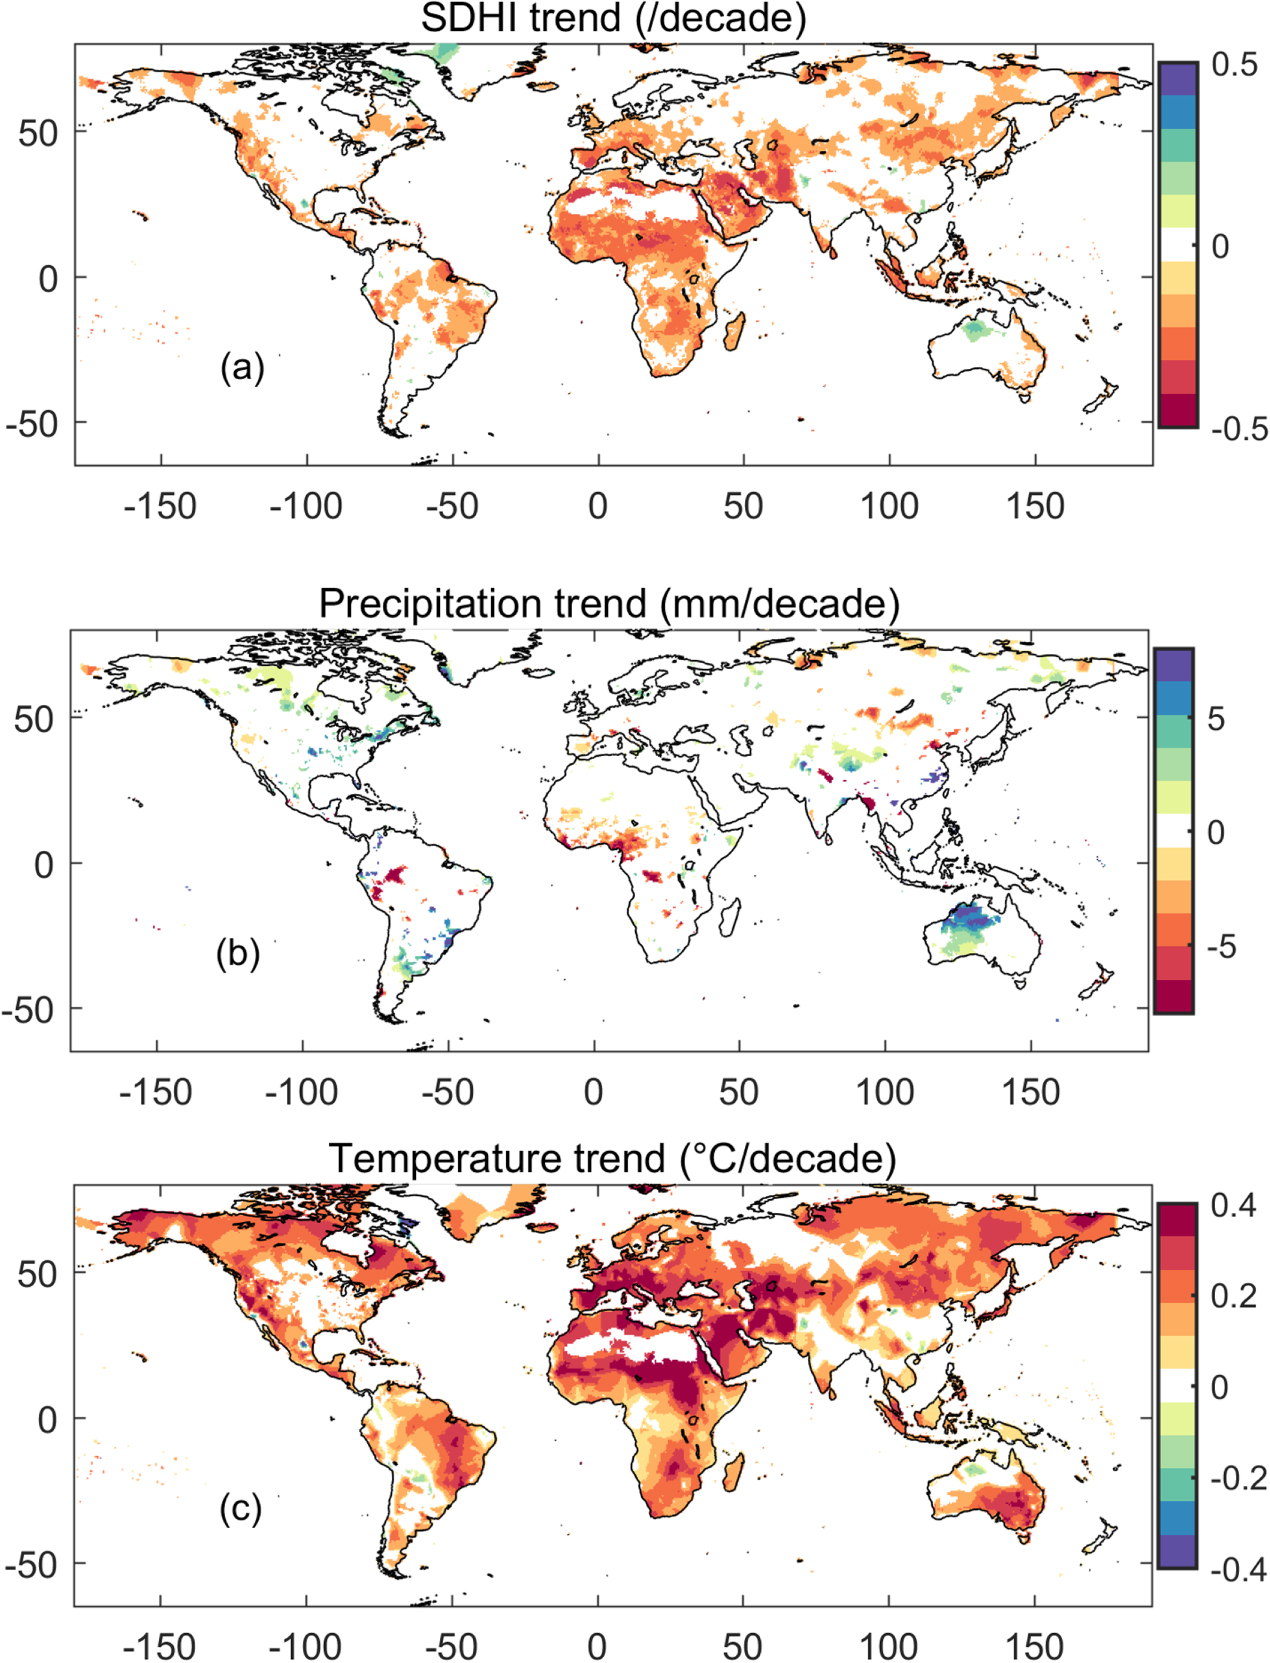
In this section, we show the trend of SDHI (as a measure of the severity of compound extremes) based on the nonparametric Mann–Kendall trend test. The slope of the SDHI trend (significant at a 0.05 significance level) is shown in figure 2(a). The SDHI value significantly decreased in western US, northern South America, western Europe, Africa, western Asia, southeastern Asia, southern India, northeastern China and eastern Australia. This implies that the compound dry and hot condition in these regions has become more severe, indicating the increased risk of compound drought and hot conditions. A large portion of these regions (e.g. western US, southern India, northeastern China) also experienced increased frequency of the concurrent drought and hot extremes (Hao et al 2013, Mazdiyasni and AghaKouchak 2015, Sharma and Mujumdar 2017). The significantly increased SDHI value was shown in very limited regions, such as part of northwestern Australia, indicating the decreased severity of the compound dry and hot extremes.

Figure 2. Trend analysis of the SDHI (a), precipitation (b), and temperature (c) for the warm season during 1951–2016 over global land area (based on the nonparametric Mann–Kendall test).
Download figure:
Standard image High-resolution imageThe changes in the severity of compound dry and hot extremes may be related to the trend of precipitation and/or temperature. We also show the significant trend of precipitation and temperature of the warm season based on the nonparametric Mann–Kendall test (figures 2(b), (c)). A significant decrease of the precipitation for the warm season was shown in the western US, part of northern South America, central and southern Africa, and northeastern Asia (figure 2(b)). Previous studies have shown increased frequency and intensity of drought in most of these regions (Dai 2013, Kumar et al 2013, Masih et al 2014, Vicente-Serrano et al 2014). Certain regions, including central US and western Australia, showed significantly increased precipitation (or less drought) (Jones et al 2009, Naumann et al 2018). The temperature of the warm season has increased significantly in most regions of global land areas, as shown in figure 2(c), with limited regions showing decreased temperature, such as southeastern China, and northern Australia. Though a significant change of the precipitation was mostly seen in limited areas, the significant trend of the severity of compound dry and hot extreme was shown in much larger areas, indicating that the severity change of compound extremes was likely modulated by a significant temperature increase over global land areas. Decreased precipitation and increased temperature co-occurred in certain regions with increased severity of the compound dry and hot extreme including northern South America and southern Africa. Regardless of the current debate on whether the increased temperature increases drought or is caused by drought (Nicholls 2004, Yin et al 2014, Kirono et al 2017), the increased severity of the compound extreme shown for large regions with increased temperature and decreased precipitation may create significant challenges to the society and ecosystem in these regions.
3.4. Temporal changes of severity
We then show the temporal change of the average severity of compound dry and hot extremes of each year over global land areas. Since the warm season may correspond to two years (e.g. December–January–February for certain regions in the Southern Hemisphere), we computed the SDHI for the hottest month estimated from the local temperature climatology over global land areas. The average severity of compound dry and hot extremes for the hottest month of each year can then be obtained by averaging the SDHI of the hottest month of each grid over global land areas (figure 3(a)). There was a significant decrease of SDHI values (or increase of the severity of the compound dry and hot extreme) with the slope around −0.09/decade (significant at 0.05 significant level). The decrease of SDHI values is expected to lead to more severe compound dry and hot extreme over global land areas.

Figure 3. Changes of average SDHI and average coverage of different SDHI levels of compound dry and hot extremes for the hottest month during 1951–2016 over global land areas. (a) Annual average SDHI. (b) Area coverage of different SDHI levels.
Download figure:
Standard image High-resolution image
We then assess temporal changes of the percentage of areas covered by different severity levels of compound dry and hot conditions. The area coverage based on three SDHI thresholds (−0.5, −0.8 and −1.3) of the hottest month for each year can then be estimated (figure 3(b)). A significant increase of the area covered by different severity levels (SDHI < −0.5, SDHI < −0.8 and SDHI < −1.3) was observed with slopes 0.03/decade, 0.02/decade and 0.006/decade, respectively. Previous studies on the changes of the spatial extent of drought over global land areas did not derive consistent results (Sheffield et al 2012, Dai 2013, Schrier et al 2013), while a significant increase of the spatial extent covered by the temperature extreme has been well established (Coumou and Robinson 2013, Seneviratne et al 2014). Thus, the increase of global land areas covered by compound dry and hot extremes shown in figure 3 is likely dictated by the increase in temperature.
4. Conclusion and discussion
The changes in the severity of compound dry and hot extremes over global land areas are evaluated, based on a compound dry and hot extreme index using the CRU data for the period 1951–2016. Results show a significant increase in the severity of compound drought and hot extremes in the western US, northern South America, western Europe, Africa, western Asia, southeastern Asia, southern India, northeastern China and eastern Australia, indicating an increased risk of compound dry and hot extremes in these regions. A significant temporal trend of the increasing severity is also shown, along with increased area coverages of different severity levels of compound dry and hot extremes.
The proposed index is derived from the ratio of the marginal probability (percentile) of precipitation and temperature, which takes into account both the dry and hot conditions relative to the local climatology in characterizing compound events. It enables the spatial comparison due to its standardized form similar to other commonly used indices such as SPI. Other indicators, such as SPEI, can be employed to represent the dry condition to derive the SDHI. Overall, the proposed SDHI provide a useful measure for the severity characterization. A Global Compound Events Monitoring and Prediction System (GCEMaPS) based on this index is currently under development for the early warming of the compound dry and hot event. The performance of the index was evaluated only based on the 2003 and 2010 heat wave events in two regions. More efforts are needed to evaluate the index in characterizing compound events at different temporal and spatial scales.
The changes in the severity of compound dry and hot extremes are related to the trend of precipitation and temperature. Under global warming due to increased greenhouse gas emissions by human activities, the increase of temperature may cause the increase of the evaporative water demand, leading to more frequent and severe droughts with profound spatial variability (Dai 2011, Cook et al 2014, Vicente-Serrano et al 2014). For example, in southern Europe, evidences have shown that the increase of temperature and the associated increase of greater atmospheric evaporative demand may lead to increased drought severity (Vicente-Serrano et al 2014). However, this hypothesis is also subject to variable results obtained by the studies on the impact of temperature increase on the severity of drought (Sheffield et al 2012, Dai 2013, Schrier et al 2013). In addition, the dry condition may lead to the increase of local temperature due to the land atmosphere interaction during summer, especially in transitional climate regimes (Hirschi et al 2011, Mueller and Seneviratne 2012, Koster et al 2016). For example, Liu et al (2017) showed that precipitation deficits in the preceding months enhanced the heat stress in northeastern China due to the positive feedback between dry and hot extremes. Finally, the natural variability (e.g. ENSO) may also affect the variability of precipitation and temperature (Trenberth et al 2014). For example, decreased precipitation in regions, including western US, central South America, central and southern Africa, and southern and northeastern Asia is likely driven by long-term trends and decadal to multidecadal variations in sea surface temperature (Hoerling et al 2006, Seager et al 2007, Dai 2013, Schubert et al 2016). Improved efforts are needed to understand global warming impacts on the internal variability of the geophysical system and then to fully understand how climate change drives the mechanisms that lead to compound events. These will be conducted in our future studies to improve our understanding of the variations of compound dry and hot extremes and associated impacts.
Acknowledgments
We thank the editor and reviewers for their constructive comments and suggestions. This research was funded by National Natural Science Foundation of China (Grant number 41601014). The monthly precipitation and temperature data were obtained from the Climatic Research Unit (CRU) (http://cru.uea.ac.uk/data).