

Abstract
A wide range of research shows that nutrient availability strongly influences terrestrial carbon (C) cycling and shapes ecosystem responses to environmental changes and hence terrestrial feedbacks to climate. Nonetheless, our understanding of nutrient controls remains far from complete and poorly quantified, at least partly due to a lack of informative, comparable, and accessible datasets at regional-to-global scales. A growing research infrastructure of multi-site networks are providing valuable data on C fluxes and stocks and are monitoring their responses to global environmental change and measuring responses to experimental treatments. These networks thus provide an opportunity for improving our understanding of C-nutrient cycle interactions and our ability to model them. However, coherent information on how nutrient cycling interacts with observed C cycle patterns is still generally lacking. Here, we argue that complementing available C-cycle measurements from monitoring and experimental sites with data characterizing nutrient availability will greatly enhance their power and will improve our capacity to forecast future trajectories of terrestrial C cycling and climate. Therefore, we propose a set of complementary measurements that are relatively easy to conduct routinely at any site or experiment and that, in combination with C cycle observations, can provide a robust characterization of the effects of nutrient availability across sites. In addition, we discuss the power of different observable variables for informing the formulation of models and constraining their predictions. Most widely available measurements of nutrient availability often do not align well with current modelling needs. This highlights the importance to foster the interaction between the empirical and modelling communities for setting future research priorities.
Export citation and abstract BibTeX RIS

Original content from this work may be used under the terms of the Creative Commons Attribution 3.0 licence. Any further distribution of this work must maintain attribution to the author(s) and the title of the work, journal citation and DOI.
Abbreviations
Research infrastructures
| ANAEE | Analysis and experimentation on ecosystems (https://anaee.com/) |
| ICOS | Integrated carbon observation system (https://icos-ri.eu/) |
| LTER | Long term ecological research (https://lternet.edu/) |
| NEON | National ecological observatory network (https://neonscience.org/) |
| CZO | Critical zone observatory (http://criticalzone.org/national/) |
Research networks
| ClimMani | Climate change manipulation experiments in terrestrial ecosystems: networking and outreach (http://climmani.org/) |
| DroughtNet | Network of drought experiments (http://drought-net.colostate.edu/) |
| Fluxnet | Global network of meteorological sensors measuring atmospheric state variables, like temperature, humidity, wind speed, rainfall, and atmospheric carbon dioxide. |
| INTERFACE | An integrated network for terrestrial ecosystem research on feedbacks to the atmosphere and climate (https://bio.purdue.edu/INTERFACE/experiments.php) |
| LIDET | Long-term inter-site decomposition experiment team (https://andrewsforest.oregonstate.edu/sites/default/files/lter/pubs/webdocs/reports/lidet.htm) |
| NutNet | Nutrient Network (http://nutnet.umn.edu/) |
| TERN | Australia's land ecosystem observatory http://tern.org.au/ |
| INCyTE | Investigating Nutrient Cycling in Terrestrial Ecosystems (NSF network) |
1. Introduction
More than a century of research has shown that availability of nutrients, such as nitrogen (N) and phosphorus (P), is a key determinant of ecosystem community composition, diversity, architecture, and functioning (von Liebig 1841, Chapin 1980, Elser et al 2000, Peñuelas et al 2013, Borer et al 2014). Nutrient availability can influence, plant activity and growth (Vitousek et al 2010, Fay et al 2015, Verlinden et al 2018), as well as microbial activity (Janssens et al 2010), and consequently has a strong influence on terrestrial carbon (C) cycling (De Vries et al 2009). Nutrient availability is also an important modulator of the effect of environmental changes on terrestrial ecosystems, and hence the terrestrial feedback to anthropogenic climate change (Melillo et al 2011, Sardans and Peñuelas 2012). For example, nutrient availability has been shown to have a fundamental control over plant responses to elevated CO2 (De Graaff and Van Groenigen 2006). Despite the critical role of nutrients in terrestrial C cycling, however, we still lack comprehensive, comparable datasets to fully unravel the influence of nutrients and the varied mechanisms through which they interact with environmental change to influence ecosystem functioning (box 1). The lack of coordinated assessments of multiple elements in concert not only limits our fundamental understanding of the role of nutrients, but also hinders model evaluation and development.
Box 1. A need for a coordinated assessment of coupled biogeochemical cycles.
| Targeted measurements of specific nutrient pools and fluxes performed across a range of locations can directly inform a unified understanding of how variation in nutrients helps dictate ecosystem structure and function. Yet, relatively few synthesis studies on terrestrial C cycling have taken nutrient availability into account, and those that exist, have typically focused on N—the element often considered most limiting for plant growth outside the tropics (LeBauer and Treseder 2008, Augusto et al 2017)—using a single indicator for N availability (e.g. N addition in van Groenigen et al 2006, C:N ratio in Alberti et al 2015, or total N stock in Stevens et al 2015). In an attempt to create a more comprehensive understanding of the role of nutrient availability in mediating ecosystem carbon cycling and its responses to environmental perturbations, a coarse classification was developed based on the sparsely available data and on expert knowledge (Vicca et al 2012, Fernandez-Martinez et al 2014, Alberti et al 2015, Campioli et al 2015, Terrer et al 2016). These data syntheses provided powerful insight into the ways nutrients influence ecosystem responses to environmental changes, but they also revealed that our understanding of the role that nutrients play in the terrestrial C cycle is hampered by the limited comparability of datasets where soil nutrient information was provided. While carbon cycle data are increasingly becoming available, and the comparability of these data among sites and networks is improving, standardized assessment of ecosystem nutrient dynamics are less common (figure 1). These data gaps hinder inter-site comparison of the influence of nutrient availability on ecosystem processes and their responses to environmental change. |
The strong evidence for nutrient effects on C cycling in terrestrial ecosystems has motivated their explicit representation in process-based terrestrial biogeochemistry (BGC) models, (Thornton et al 2007, Medvigy et al 2009, Wang et al 2010, Zaehle and Friend 2010, Parton et al 2010, Smith et al 2014, Reed et al 2015). Taking nutrient limitations into account, these models generally simulate a reduced sensitivity of plant growth to increasing CO2 and strongly reduced C uptake by the terrestrial biosphere under future climate and atmospheric CO2 concentration scenarios (Thornton et al 2007, Zaehle and Dalmonech 2011, Peñuelas et al 2013, Wang et al 2015, Wieder et al 2015a, Achat et al 2016). This is in line with evidence from manipulation experiments and remote sensing results, which imply that allowable emissions to keep global warming below a given target are much lower than emission estimates from models without C-nutrient interactions (Zaehle et al 2010, 2014a, Ciais et al 2013, Zhang et al 2014, Smith et al 2015). However, detailed comparisons of models with interactive C and N cycles against field experiments revealed that key mechanisms determining the uptake and recycling of nutrients are poorly simulated by the current generation of BGC models (Piao et al 2013, Zaehle et al 2014b, Medlyn et al 2015) and the uncertainty arising from missing empirical data and poor process understanding remains a serious limitation for model projections (Thomas et al 2013, Meyerholt and Zaehle 2015, Meyerholt et al 2016). Information on soil properties, nutrient availability, allocation and plant stoichiometry, along with site-level terrestrial C cycle data, is therefore critical to inform the formulation of models and to establish new benchmarks.
A range of large scale research infrastructures (e.g. ICOS, ANAEE, NEON, LTER, TERN, CZO) and research networks (e.g. Fluxnet, ClimMani, INCyTE, INTERFACE, LIDET, NutNet, DroughtNet, TERN) have been initiated to collect empirical data from terrestrial ecosystem monitoring and manipulation experiments with a focus on characterizing the cycling of C and its response to environmental change (Hinckley et al 2016, Richter et al 2018). While ample data are commonly available for accompanying measurements of meteorological variables, background climate, vegetation cover, and soil moisture, an assessment of how nutrient cycling may modulate terrestrial C cycling across networks and in experiments is often missing. Here, we argue that the additional provision of coherent and comprehensive observations of nutrient availability, soil properties, and plant stoichiometry would greatly enhance the power of these networks and experiments to generate mechanistic insights for understanding how and why nutrient availability interacts with ecosystem functioning and structure to shape their response to global environmental change.
To support the coupling of nutrient cycling measurements with those being made for C in large scale cross-site infrastructures and global change experiments, we highlight research gaps and the types of measurements that could be particularly valuable for: (1) developing a solid empirical basis and identifying general patterns of how nutrient availability interacts with C cycling; and (2) parameterizing and evaluating BGC models, especially their representation of mechanisms by which nutrients affect C cycling and ecosystem feedbacks to climate and environmental change. We first focus on how to characterize and compare the nutrient status and propose combining a set of complementary measurements to assess nutrient availability among sites and experiments. Subsequently, we discuss the power of different variables of ecosystem nutrient cycling to inform and evaluate process-based BGC models. A primary aim of this work is to raise awareness about the need for comparable nutrient cycling measurements. To facilitate a wide implementation, we focus on common biogeochemical measurements that are relatively easy to make and interpret. We focus on N and P as nutrients shown to strongly affect C cycling (although we recognize other nutrients have poorly represented importance as well (Kaspari and Powers 2016)).
2. Integrated assessment of nutrient availability
Comparing nutrient availability among sites remains challenging due to the large variability in edaphic properties that modify nutrient availability (e.g. soil pH) and due to varying plant strategies of nutrient acquisition (e.g. cluster roots, mycorrhizal fungi). This complicates the interpretation of chemical assays used to assess N and P availability (Binkley and Hart 1989, Holford 1997, Neyroud and Lischer 2003, Inselsbacher and Näsholm 2012, DeLuca et al 2015, Darch et al 2016). Nonetheless, characterizing and comparing nutrient availability within and among sites can be accomplished by combining key soil properties with indicators of N and P availability. The simultaneous measurement of multiple aspects of nutrient cycling can help reduce the caveats associated with any single measurement. Such integrated metrics could provide a broad indication of site nutrient availability and provide new insights into how it influences C cycling.
Qualitative estimates of nutrient availability across sites can be made using relatively common metrics. This integrative approach was applied in a few synthesis studies that used a nutrient availability classification (Vicca et al 2012, Fernandez-Martinez et al 2014, Campioli et al 2015) and could help bring quantitative capacity to coupled biogeochemical perspectives. However, large data gaps persist. For example, figure 1 shows the availability and overlap of a few of the most commonly measured soil variables that are available for a set of 125 forest sites, including sites that are part of networks such as Fluxnet and LTER (Luyssaert et al 2007, Vicca et al 2012, Campioli et al 2015). Here, we used all forests for which aboveground primary production data were available (table S1 is available online at stacks.iop.org/ERL/13/125006/mmedia). Although some soil data (especially texture and soil C:N ratio) were available for the majority of the sites, overlap in the combination of soil variables providing complementary information was very limited. Using these sparse data (see figure 1), Vicca et al (2012) developed a nutrient availability classification based on information such as soil texture, soil organic matter (SOM), pH, C:N ratio, and cation exchange capacity (CEC). This categorical classification explained significant differences in biomass production efficiency and ecosystem carbon use efficiency across forests (Vicca et al 2012, Fernandez-Martinez et al 2014). Hence, integrated assessments of ecosystem nutrient availability could provide a means to assess nutrient effects on broad differences in ecosystem function and productivity. Such classifications would become more accurate and powerful if more comprehensive and comparable datasets were available, such that the same set of variables can be considered for all sites.

Figure 1. The availability of data for 13 soil variables in a global dataset of 125 forests and a Venn diagram showing the overlapping availability for four of these variables. These four variables were chosen because of their complementary information regarding nutrient availability and because they are among the most commonly measured soil properties in the database. The number of sites providing any single variable is shown by n, some combination of two of these variables is shown by n where two polygons overlap, and the combination of all four is shown in bold text. Abbreviations are for bulk density (BD), soil organic matter (SOM), cation exchange capacity (CEC), and total exchangeable bases (TEB). For SOM, n includes also sites that provided soil organic carbon (SOC) instead of SOM, and pH includes measurements performed using H2O, CaCl2 or KCl solutions. For both SOM and pH, the variable of interest can be obtained through conversion (Ahern et al 1995, Pribyl 2010). All data are provided in table S1.
Download figure:
Standard image High-resolution imageAdding to this qualitative approach, quantitative metrics that integrate information about key soil properties and nutrients can be used in inter-site comparisons. For example, Fischer et al (2012) and Van Sundert et al (2018) developed site fertility indices from commonly used measurements to broadly assess nutrient availability. Briefly, these metrics consider three or four soil factors that influence nutrient availability (attributes like SOM, pH, texture, C:N ratio, total exchangeable bases (TEB, i.e. the sum of K, Ca, Mg and Na)). Each attribute included in the metric received a rating that decreases as it diverges from a predefined optimal range. Thus, nonlinear relationships and interactions among attributes are taken into account. For example, at low pH, differences in N availability may be less influential than at optimal pH because at pH < 4.5 plant growth is commonly limited by Al toxicity and/or P deficiency (Cross and Schlesinger 1995, Chapin et al 2002). This approach requires further investigation, development, and testing, as its potential for wider applications requires the establishment of comprehensive datasets of soil properties and nutrients (Van Sundert et al 2018). In future availability of a larger number of data for multiple edaphic factors and nutrient availability measurements, along with C cycle variables, may enable machine learning-based approaches to identify such patterns from the data alone.
As illustrated by the variables included in both the nutrient availability classification and in quantitative nutrient metrics, some soil characteristics seem consistently indicative of site nutrient status and can help to estimate ecosystem nutrient availability (Andrianarisoa et al 2009, Van Sundert et al 2018). These include SOM, CEC and TEB, texture, bulk density, and pH. SOM is a source of nutrients and both organic matter and clay colloids are important exchange sites for nutrients (Schroeder 1984, Roy et al 2006). CEC represents the capacity of soil to avoid leaching of essential nutrients, including N (Robertson et al 1999). Bulk density indicates the porosity of the soil and is particularly relevant where gravel and stones reduce the 'fine earth' volume from which plants acquire essential nutrients. Bulk density is also necessary to convert concentration data into stocks. Soil pH is a critical determinant of nutrient availability, especially for P, and also has strong relationships with soil microbial communities (Fierer and Jackson 2006). Thus, these relatively straightforward soil assays are useful for developing proxies of nutrient availability across sites (see also box 1).
Pairing these simple assays of soil characteristics with direct, targeted measurements of ecosystem N and P availability provides additional information about nutrient-carbon cycle interactions from monitoring programmes, networks, and global change experiments. An indicator of N availability that is comparable across a wide range of environmental conditions is the soil C:N ratio (e.g. Andrianarisoa et al 2009, Wang et al 2014, Alberti et al 2015). The soil C:N ratio has the advantage of being fairly straightforward to determine and it does not change on short temporal scales, thus the timing of measurements is less influential. This variable was also included in the metric developed by Van Sundert et al (2018). A high soil C:N ratio indicates a relatively low N availability, and several studies have reported a significantly negative relationship between soil C:N ratio and N mineralization rates (Andrianarisoa et al 2009, Yan et al 2012), plant biomass (Grau et al 2017), organic matter decomposition, and plant productivity (Yan et al 2012, Van Sundert et al 2018). Similarly, assessment of foliar N and P stoichiometry suggests broad scale indicators of relative nutrient limitation in plants (Vitousek 1984, McGroddy et al 2004, Reich and Oleksyn 2004). Although caution in inferring nutrient limitation from stoichiometry is warranted (e.g. because of a strong phylogeny effects; Townsend et al 2007, Asner et al 2014, Sardans et al 2015, Zechmeister-Boltenstern et al 2015), we contend that these metrics offer powerful indicators of ecosystem nutrient availability, especially when paired with other measurements.
Ecosystem P status regulates productivity and ecosystem function at multiple spatial and temporal scales (Vitousek et al 2010, Cleveland et al 2011, Peñuelas et al 2013). Despite the central role of coupled C–N–P dynamics, a reliable, widely applicable indicator for P availability for inter-site comparisons is challenging to suggest, as the accuracy of different indicators of P availability depends strongly on soil properties (especially pH) and on the dominant P acquisition strategy (e.g. carboxylate-releasing cluster roots, roots releasing phosphatase enzymes, or mycorrhizal fungi; Raven et al 2018, Zemunik et al 2018). We therefore advocate that inter-site comparisons (e.g. in meta-analyses) and models should always take the P-acquisition strategy of plants into account, and combine this with data on total soil P and the most suited extraction methods for the study soils (Olsen P, Bray P, Colwell P (Colwell 1963), Resin P (Turner and Romero 2009)) (table 1). These extraction methods have been widely applied (Colwell 1963, Bolland 1997, Dalling et al 2016, Turner et al 2018a, b). While Olsen P is considered to best reflect P extractability in soils of alkaline to neutral pH (Olsen et al 1954), Bray P and Colwell P provide a more accurate estimate of extractable P at lower pH (Wolf and Baker 1985). We recommend prioritizing the Resin-P extraction method, as it measures P that is in solution, independent of soil pH. P in the soil solution is available for all plants, but because species with P-mining strategies have access to a greater pool (Lambers et al 2018), we advise measuring also other P indicators most relevant to the system (e.g. total P, Olsen P, Bray P).
Table 1. List of suggested soil measurements to characterize sites in terms of nutrient availability and additional data needs for model development and evaluation. Foliar stoichiometry refers to the ratios of the elements: C, N, P, Ca, Mg, K, Zn, Fe, Mn, S.
| Primary advantage | ||
|---|---|---|
| Edaphic soil properties | pH | Generalist and integrative indicators of soil nutrient availability |
| Texture | ||
| Bulk density | ||
| Organic matter concentration | ||
| Cation exchange capacity | ||
| Targeting specific plant and soil | Total N | Indicative of the stock size and availability of individual nutrients |
| nutrients | C:N ratio | |
| Total P | ||
| P extractiona | ||
| Total exchangeable bases (K, Ca, Mg, Na) | ||
| Resin membranes | Ability to capture short-term changes | |
| Foliar stoichiometry | ||
| Additional model data needs | Belowground C allocation | Improving mechanistic understanding of nutrient cycling and its |
| Plant nutrient uptake rates | relationship with C cycling | |
| Net mineralization rates | ||
| N fixation | ||
| Nutrient resorption coefficients | ||
Inorganic nutrient pools (   ) ) |
aP extraction refers to Resin P, Olsen P, Bray P, Colwell P, etc depending on the soil condition (see text).
Except for the P extraction methods, the measurements of soil properties and indicators of N and P availability suggested above are all relatively stable at short time scales. While this is advantageous for a nutrient availability characterization of different sites (avoiding confounding effects of the time of sampling), these measurements may miss short-term responses to natural or imposed environmental changes. A particularly useful method that can be added to capture short-term dynamics are resin membranes, with which the availability of a suite of nutrients that can be estimated in an integrated fashion through time. Resin membranes (or bags) absorb anions and/or cations that are in the soil solution, and hence provide an estimate of the relative availabilities ('supply rates') of various ions during the time resins are in the soil (Qian and Schoenau 2002). These membranes also provide unique information about the relative abundance of different elements in soil solution, a measure that is comparable among study sites. Nonetheless, the potential for comparing changes in nutrient availability among sites and in response to environmental perturbation is challenging, in part because supply rates depend on soil moisture and temperature (Qian and Schoenau 2002), and the units (e.g. μg N cm−2 membrane−1 burial time−1) differ from those of fluxes actually occurring in the ecosystem. Nevertheless, relative differences in measured supply rates among treatments or sites provide valuable information, useful for interpreting observations (Dijkstra et al 2010, 2012) and for informing models. Overall, ion exchange resins can offer a good additional measurement for comparing nutrient availability among treatments within a site, as well as the elemental ratios among sites, and for indicating strong differences in individual nutrient availabilities among sites.
In table 1, we summarize the measurements that we consider of primary relevance for inter-site comparison—in addition to (already available) data on major C pools and fluxes of ecosystems (e.g. net C exchange fluxes, plant and soil C stocks, microbial respiration). We focus on measurements that are comparable across a wide range of environmental conditions, that provide complementary information, and that are relatively simple to make. We suggest that, for the aim of inter-site comparison, variables with low seasonal variability are preferred over variables that exhibit considerable variability at short temporal and spatial scales, as the latter require high spatial and temporal resolution of measurements or spatial and seasonal integrations, and would substantially complicate robust comparisons across biomes and climatic regions. Of course, the measurements in table 1 can be complemented by other measurements that help advance process understanding of nutrient cycling or fit specific project goals.
This article focusses on the type of data that are needed, without providing or discussing specific protocols for sample timing, depth or spatial representation. However, standardized measurement protocols are critical for enabling comparability of data across sites. Concerted research within multi-site networks offers an opportunity for designing and disseminating common protocols. This has been put into practice within some networks (see e.g. NutNet http://nutnet.org/methods and NEON https://neonscience.org/data-collection/protocols-standardized-methods). In future, more effort should be made to adopt standard protocols more widely and harmonize them across networks. In addition, publicly accessible and usable datasets from monitoring and experimental sites and networks is needed to greatly enhance the power of data synthesis as well as model development and evaluation.
3. Data and process understanding for model development and evaluation
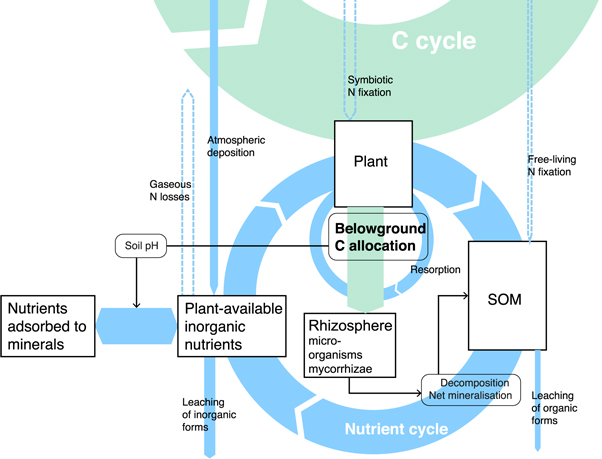
Data from research networks and experimental manipulations are already critical for developing and evaluating BGC models (Luo et al 2012, Schaefer et al 2012, Zaehle et al 2014b, Hinckley et al 2016). Expanded measurements that facilitate the characterization and comparison of nutrient status among different sites would also enable additional insights into the representation of nutrient controls on biogeochemical cycles in models. BGC models provide process-based representations of BGC and vegetation dynamics and are the primary tool for integrating knowledge about the functioning of the terrestrial C cycle and its interaction with nutrient cycles. Here we provide a brief overview of the development of C-nutrient interactions in BGC models and summarize data-model linkages that would be enabled by systematic, targeted data collection across existing research infrastructures. An overview of the interplay of relevant processes and fluxes is given in figure 2.
Figure 2. Schematic representation of the link between carbon and nutrient cycles as considered in biogeochemistry models. 'Belowground C allocation' subsumes different components and functions, including fine root production, fine root respiration, export to mycorrhizae and symbiotic bacteria (e.g. rhizobium for N fixation), and exudation of labile C compounds into the rhizosphere. The thickness of arrows approximately indicate the relative magnitudes of the fluxes. Blue arrows indicate nutrient fluxes, green arrows indicate carbon fluxes. Fluxes specific to nitrogen are given by arrows with a dashed outline. Boxes indicate pools.
Download figure:
Standard image High-resolution image
3.1. Carbon-nutrient relationships in terrestrial BGC models
While the explicit representation of C and N interactions is becoming common in BGC models, and recent developments have been aimed at explicitly simulating P cycling (Wang et al 2010, Yang et al 2014, Achat et al 2016, Goll et al 2017), other nutrients and additional soil properties that modulate nutrient availability to plants (e.g. pH, CEC, texture) remain largely ignored by the suite of models available today. This historical legacy resulted from the origin of these models, which were developed and applied mainly with the aim of simulating C cycle changes and their feedbacks with climate. The motivation for including effects of nutrients has primarily been to increase confidence in model projections of future C cycle trajectories in response to environmental change (Hungate et al 2003, Zaehle et al 2014a, Wieder et al 2015a). However, substantial uncertainties remain in how to adequately represent ecological processes that determine C-nutrient cycle interactions in global-scale models (Brovkin and Goll 2015, Meyerholt and Zaehle 2015, Wieder et al 2015b, 2015c). This challenge also presents new opportunities to test alternative hypotheses and refine ecological understanding of how nutrients shape the C cycle at centennial time scales and across the globe (Fowler et al 2015, Medlyn et al 2015, Tian et al 2018).
The key mechanistic relationships between C and nutrient cycles represented in models are related to allocation and stoichiometry. Allocation defines the partitioning of assimilated C into different plant organs and functions. Key for simulating C-nutrient interactions in BGC models is the partitioning into above- and belowground biomass pools (foliage and wood versus roots). The size of these pools is related to the efficiency at which above- and belowground resources are acquired. Stoichiometric relationships in models define particular C:nutrient ratios in simulated ecosystem pools. Despite widespread observational evidence for adaptive flexibility in plant C allocation and stoichiometry in response to nutrient availability and environmental manipulations, appropriately simulating these changes remains a significant challenge (Zaehle et al 2014b, Ghimire et al 2016, Terrer et al 2018). This challenge is particularly acute for belowground processes, where allocation and stoichiometry affect root function and plant-soil interactions that control nutrient uptake (figure 2). While many BGC models only have a rudimentary representation of functional relationship between roots and nutrient uptake, recent model developments have been aimed at better resolving this process (Iversen et al 2017, McMurtrie and Näsholm 2018). Despite this progress, significant knowledge and data gaps persist.
3.2. Data-model linkages
To address knowledge and data gaps, we call on existing research infrastructure and networks to collect data that help to clarify and quantify key functional relationships between allocation, stoichiometry and ecological function that are to be represented in models. Broadly, measurements are needed: (1) to reveal insights into allometric and stoichiometric changes and how they vary across ecosystems, over time, and under experimental manipulations; and (2) to link observed plant adaptations with observed variations in nutrient availability. We acknowledge a significant disconnect between suggested measurements for characterization of the nutrient status (section 3) and modelling needs (see below), which underscores opportunities to better align future research activities. Below we briefly summarize the approach commonly taken to simulate nutrient limitations in global models and discuss the power of different observable variables for informing and evaluating modelled relationships.
Belowground C allocation is directly affected by nutrient availability and the balance between above- (light, CO2) and belowground (water, nutrients) resource availabilities (Poorter et al 2012). The magnitude of belowground C allocation indicates how much of the assimilated C is spent on nutrient and water acquisition. Without explicitly resolving how much C is allocated to different nutrient uptake mechanisms and plant-soil interactions, total belowground C allocation is the most relevant quantity for providing information on overall C costs of nutrient uptake (Gill and Finzi 2016) and can directly be related to variables simulated in BGC models (Shi et al 2016). Therefore, we highly recommend a strengthened focus on measuring belowground C pools and its change under experimental treatments and along environmental gradients (Iversen et al 2017). In the field, belowground C allocation is commonly estimated by subtracting litterfall and the changes in SOM pool from the soil CO2 efflux (Davidson et al 2002, Litton et al 2007). Direct estimates of root production are rarely available since they are highly labour-intensive. However, root mass estimates can be more easily obtained by soil core sampling, and may be used as alternative proxy for total belowground C allocation under some simplifying assumptions (Terrer et al 2018). Instead of relying on absolute estimates of root mass, relative differences across sites and experimental manipulations may be a useful constraint on the model sensitivity of root allocation to environmental conditions (Terrer et al 2018). Interpretation of relationships between belowground C allocation and nutrients has to take into account that belowground C allocation and root biomass are affected by water availability, especially where deep rooting is a common plant strategy to access water stored in deep layers during prolonged dry periods.
Plant tissue stoichiometry and its response to nutrient availability is critical for the degree to which nutrient uptake limits plant growth. Particularly critical is to appropriately simulate the flexibility in leaf stoichiometry in response to environmental change. Current N-enabled BGC models explicitly resolve the C:N stoichiometry in plant tissue (Ghimire et al 2016). An evaluation by Zaehle et al (2014b) showed that available models generally overestimate the flexibility in tissue stoichiometry in response to elevated CO2. This ensemble of models also simulated a feedback of increased foliar C:N under elevated CO2 which (erroneously) tended to induce a progressively enhanced N limitation effect on plant growth due to greater N immobilization at high C:N ratios of litter inputs. Empirical data documenting how stoichiometry varies with experimental treatments and across environmental gradients is therefore important as a constraint for models and model-data evaluations should be extended to investigate P-related stoichiometry.
Soil C:N is typically prescribed in models for different SOM compartments (e.g. slow and fast turnover SOM). Hence, it is treated as constant in time and independent of environmental factors. Therefore, although soil C:N emerges as a good indicator for explaining variations in C cycling in observational datasets (see section 2), it cannot be used as a direct observational constraint on simulated nutrient dynamics in models. Furthermore, prescribed soil C:N ratios do not directly determine N availability in models. Until the complex nature of soil C:N as both a predictor and result of coupled ecosystem C and N cycling is accurately simulated by a next generation of models, its use for constraining current BGC models remains limited.
Plant nutrient uptake rates from the soil are useful for quantifying the 'return' on a given 'investment' of belowground C allocation (Terrer et al 2018). While these fluxes cannot directly be observed, field data can be obtained indirectly, based on litterfall, biomass increment, and tissue nutrient concentration data (Finzi et al 2007). Hence, the power of such data and the usefulness as an independent model benchmarking variable is limited. Nevertheless, comparing modelled and observation-derived nutrient uptake rates may serve as a practical way for model evaluation and has previously generated valuable insights (Zaehle et al 2014b).
Net mineralization rates represent the balance between gross mineralization from organic matter and the simultaneous immobilization in microbial biomass. While gross mineralization and immobilization are usually simulated separately by models, these are not readily measurable quantities in the field (Schimel and Bennett 2004). Net mineralization rates quantify the total nutrient 'throughput' through the system (figure 2) and are used to estimate nutrient availability for plants in the field (Gill and Finzi 2016). However, the use and interpretability of net mineralization data is not straightforward due to large seasonal variations, requiring repeated measurements, and due to the varying importance of nutrient losses (leakage and gaseous N loss) in confounding the relationship between net mineralization rates and nutrient availability. The value of net mineralization data for models therefore lies primarily in constraining simulated nutrient cycling rates and, in combination with estimates of nutrient inputs or losses and resorption, they can indicate the openness of nutrient cycling (Cleveland et al 2013).
N fixation is an important component of the ecosystem N balance and provides information about the degree of biological control on N availability and therefore on the potential of plants and the ecosystem as a whole to relieve limiting effects of low N availability, especially in global change scenarios (Menge et al 2014, Wieder et al 2015c, Meyerholt et al 2016). N fixation is increasingly recognized as a key variable that should be modelled based on the balance between N availability in the soil and plant demand (Medlyn et al 2015). Reliable measurements are therefore crucial for constraining models, but extrapolations based on field measurements and isotopic data produce varied estimates of global N fixation rates that still lack spatial or temporal resolution (Vitousek et al 2013). While estimates of ecosystem-level N fixation rates are difficult to achieve, especially where contributions from diverse N-fixing processes are substantial (e.g. free-living microbes, bryophytes; Reed et al 2011), information about relative differences in fixation rates or the fraction of N in biomass derived from N fixation (Schneider et al 2004) can also be used as a valuable constraint for models.
Resorption coefficients are typically prescribed and constant parameters in models (but see Shi et al 2016). Since they are thus not internally predicted, they cannot directly be used as an observational constraint. Nonetheless, a wider availability of observational data can provide a solid empirical basis for how resorption coefficients vary along environmental gradients (Reed et al 2012) and are therefore important for robust model parameterizations and as a target for future modelling efforts, where resorption coefficients may be treated as an internally predicted quantity.
Atmospheric deposition of nutrients is a key quantity that determines ecosystem nutrient balances and the degree to which nutrients limit or support additional C sequestration (De Vries et al 2009). CN-models commonly use prescribed spatial data of atmospheric deposition derived from large-scale atmospheric chemistry and transport models (Mahowald et al 2008, Lamarque et al 2011, 2013). However, these global datasets have a relatively coarse resolution spatially and temporally, may not resolve all local processes affecting deposition velocities, and comparisons to local measurements indicate a tendency for underestimated rates in global datasets (Sutton et al 2011), at least partly owing to challenges in estimating dry N deposition rates. This underlines the value of using specific measurements of deposition rates for interpreting results in empirical studies and as model forcing for site-level simulations.
The sizes of inorganic soil nutrient pools (

 ) are often simulated explicitly in models and typically determine plant uptake and loss rates. The temporal dynamics of inorganic nutrient pools are highly variable and subject to different biotic and abiotic factors. Hence, reliable model-data comparisons require frequently repeated sampling and standardized measurement protocols. However, the response of these pools to experimental manipulations and environmental changes yield insights into how nutrient pools, and therefore nutrient availability, change and how these changes relate to C cycling. More robust and accurate measurements, integrated over relevant timescales may be obtained from resin membrane methods (see above). These methods are particularly useful for assessing relative differences among sites or experiments that can be highly informative for network syntheses and for model-data comparisons. Field estimates typically quantify the inorganic pool size per unit soil volume or mass. In contrast, pool size per unit surface area is typically, but not always (Koven et al 2013), simulated in models. Quantities integrated over the entire soil profile are generally difficult to measure, suggesting that an explicit representation of the vertical distribution of SOM dynamics in models will contribute to a better capacity to evaluate models. Due to the key role of triggering plant responses and its explicit treatment and equally central role in models, we highly encourage the wide application of measurements of the size and availability of inorganic nutrient pools, and recommend methods that provide temporally integrated information (e.g. resin membranes).
Additional edaphic factors for modelling, including several soil properties (pH, CEC, texture, etc) influence soil chemistry and nutrient availability and can explain substantial additional variability of terrestrial C cycling across sites (Vicca et al 2012, Fernandez-Martinez et al 2014). These empirically based studies established the utility of using multiple edaphic factors to develop qualitative or quantitative metrics as proxies to understand ecosystem C responses across fertility gradients (section 2). Applying a similar methodology in models may help simulate cross-site variation in C cycle responses to environmental change, or the efficiency by which assimilated C is converted to biomass (Vicca et al 2012). To our knowledge, such a 'phenomenological' approach that accounts for multiple indicators of soil nutrient availability remains untested in BGC models. Alternatively, soil properties may serve as covariates in functions describing nutrient transformations and fluxes. For example, soil texture and pH modify transfer coefficients and C turnover times in several soil biogeochemical models, although recent analyses call into question the underlying assumptions applied in these models (Rowley et al 2017, Rasmussen et al 2018). Moreover, although it is tempting to explicitly represent fine scale soil processes and nuances, attention should be given to the main application of BGC models' to predicting large-scale biosphere dynamics and fluxes, especially under global change scenarios. The aim of using edaphic properties in conjunction with models should be to identify robust patterns in these relationships and will be important to guide future model developments to account for additional edaphic factors. Simultaneously, these efforts should identify additional data needs or availability to better constrain novel model formulations.
The imperfect overlap between field measurement options (section 2, table 1) and current model representations (section 3) speaks to the challenges and opportunities for incorporating empirical data into models, as well as for using models to help inform our understanding of terrestrial processes that are difficult to measure. For example, many of the processes central to regulating nutrient cycling in models are not easy to gather data for in the field (e.g. belowground C allocation, gross mineralization). Moreover, many of the field measurements are not straightforward to incorporate into existing models (e.g. spatial variation in site nutrient availability). Cross-site evaluations and global change manipulations offer strong possibilities to address the lack of overlap in what is measured empirically and what is represented numerically. In particular, the physical edaphic characteristics discussed above may be a common ground where increased data collection and incorporation into models could improve both approaches and our overall understanding. Further, components of models that are difficult but not impossible to measure well in the field could be collected across sites or treatments in an organized way, knowing the data would be critical for model evaluation. Improved knowledge of coupled C and nutrient cycles from separated empirical and modelling approaches will advance understanding, but joining these approaches through data collection, analysis, and interpretation would be the strongest way forward.
Acknowledgments
We acknowledge support of the European Research Council grant ERC-SyG-610028 IMBALANCE-P and the ClimMani COST Action (ES1308). SV is a postdoctoral fellow and KVS a PhD fellow of the Fund for Scientific Research—Flanders (FWO). BDS was funded by ERC H2020-MSCA-IF-2015, FIBER, grant number 701329. SCR was supported by the US Geological Survey and the US Department of Energy (DE-SC-0011806). WRW was supported by the US Department of Agriculture NIFA Award number 2015-67003-23485, NASA Interdisciplinary Science Program award number NNX17AK19G, and US National Science Foundation grant DEB 1637686 to the Niwot Ridge LTER. Any use of firm, product, or trade names is for descriptive purposes only and does not imply endorsement by the US Government. MB was supported by Austrian Science Fund (FWF) project no. P28572 and the Austrian Academy of Sciences (project ClimLUC). SZ was supported by the European Research Council (ERC) under the European Union's Horizon 2020 research and innovation programme (QUINCY; grant no. 647204).