

Abstract
Acidic deposition has caused severe surface water acidification in Europe and North America, but surface water acidification has not been systematically studied in Russia. Here we present the first detailed study on regional surface water acidification in European Russia (ER) and Western Siberia (WS) based on a survey of 367 lakes in a transect from the tundra to the steppe, which were investigated to explore the status and mechanism of surface water acidification. The variability of water chemistry is documented and discussed. High pH and acid-neutralizing capacity (ANC) were observed for lakes in the southern region, indicating that surface water acidification does not occur here. Anthropogenic acidification occurs in the humid areas of both regions, being observed in 4.4% of ER and 8.2% of WS lakes. These tundra and taiga lakes are characterized by high transparency, low pH, and ANC with a high concentration of strong acid anions. The main factor leading to acidification in the ER lakes is sulfur emission from metal smelters whilst that in WS is acidification, likely associated with gas burning by oil production facilities. In the ER acid lakes, SO42− is dominant; this is in contrast to WS, where NO3− and Cl− are dominate. The influence of strong technogenic acids on the structure of organic components and their possibility to form a proton is discussed. The phenomenon of the increase in water acidification by organic acids and strong acids is explained. These results clearly show the effect of a number of factors that strengthen the acidity of water. Differences in the chemical composition of lakes of both regions, as well as differentiation by their acid properties, were statistically proved. Results of our research indicate the need to reduce emissions of acidic gases into the atmosphere.
Export citation and abstract BibTeX RIS

Original content from this work may be used under the terms of the Creative Commons Attribution 3.0 licence. Any further distribution of this work must maintain attribution to the author(s) and the title of the work, journal citation and DOI.
1. Introduction
From the middle of the last century, the burning of fossil fuels has led to acid rain and the acidification of water bodies in some regions of Europe and North America (Henriksen et al 1992, Kvaeven et al 2001, Driscoll et al 2003). In the past decades, sulfur dioxide (SO2) emissions have declined in Europe and North America, as well as in Russia, and some authors have shown evidence for recovery trends in lakes and rivers (Stoddard et al 1999, Evans et al 2001, Skelkvale et al 2005, Garmo et al 2014, Strock et al 2014). SO2 and NOx emissions are still high in some parts of the world, for example in developing countries such as China and some South American countries (Kuylenstierna et al 2001, Galloway et al 2004, Duan et al 2011, Xia et al 2016). Therefore, the problem of water acidification continues in the current century (Nakahara et al 2010, Mitchell and Likens 2011, Moiseenko and Gashkina 2011, Reitzel et al 2013, Wang et al 2014, Yu et al 2017).
Research into the extent of freshwater acidification in Russia has been neglected, where monitoring only takes place for the assessment of large lakes and rivers. One of the first regional surveys of lakes subject to quality control in Russia was undertaken in the Kola North (within the international project 'Survey Lakes') (Moiseenko 1994, Henriksen et al 1998). Here anthropogenic water acidification is caused by SO2 emissions from the local copper–nickel smelter. The anthropogenic acidification of lakes in some other regions of northwest Russia, such as Karelia, Arkhangelsk, and Vologda, has also been found (Komov et al 1997, Moiseenko and Gashkina 2011). However, the extent of freshwater acidification in other parts of Russia has not been established.
The aims of this paper are as follows:
- to present the first baseline data of lake water chemistry extending from the tundra to the arid zones of European Russia (ER) and Western Siberia (WS);
- to estimate the vulnerability of fresh waters to acid precipitation based on the concentration of chemical components;
- to determine the differences in water chemistry between investigated regions and to identify anthropogenic acidification;
- to estimate the contribution of major anions to water acidification and to study the structure of differences between the chemical compositions of water lakes from the humid regions of ER and WS.
2. Materials and methods
2.1. Study area water sampling
Studies were conducted on two large regions of Russia—ER and WS (figure 1). ER is located from the Kola Peninsula in the north to the Caspian depression in the south (East European Plain), with an average elevation of 170 m a.s.l., with some hills rising to 300–400 m a.s.l. or higher. In the northern part of the plain (in the Kola Peninsula and Karelia tundra and taiga zones) the crystalline Archean and Lower Proterozoic outcrops form the Baltic Shield, whereas the southern part of the plain (mixed forests, forest steppe, and steppe) is covered by thick Upper Proterozoic and Phanerozoic sedimentary rock (Zabrodina et al 1982, Voitkevich et al 1990).

Figure 1. Locations of the investigated lakes.
Download figure:
Standard image High-resolution imageER is characterized by industrial sulfur emissions. In the northern part of ER two large copper–nickel smelters ('Pechenganikel' and 'Severonikel') have polluted the environment by the emission of SO2 and metals. In the central part of ER, there are large metallurgical facilities: Cherepovets, Oskol, Novolipetsk, Novotulsky, and others. Ferrous metal smelters include blast furnace production, steelmaking, rolling production, sinter smelters, and coke plants. The emissions to the atmosphere include considerable amounts of SO2 and nitrogen oxides (NOx), volatile organic compounds, and heavy metals. Sulfur emissions in ER decreased more than 25 years ago and was stable over the last decades (State Reports 2012).
WS ranges from the tundra of the Yamal Peninsula in the north to the steppe zone of the Kurgan Region to the south. The area consists of monomineral Quaternary deposits with a predominance of quartz sand and loose silicate rocks, widespread in the tundra and taiga zones of WS. In the northern and middle parts of WS rainfall dominates over evaporation, and there is extensive development of wetlands (Khrenov 2011).
WS is a region dominated by the oil industry, producing 60% oil and 90% gas (310 million tonnes of oil and 500 billion m3 of natural gas) (Moiseenko et al 2013a, 2013b). The oil comes from deep deposits associated with gas that is burned in flares. The content of sulfur in the oil is low (up to 1 wt %), and mercaptan and disulfides are absent (Jüttner et al 1997, Reitzel et al 2013). Nitrogen (N) compounds (pyridines, amides and imides, benzopirol) are dominant in the composition of oil and the associated gas. The fraction of N2 in the associated gas can be up to 9%. The burning of the associated gas leads to acid deposition, especially of NOx. The mid-taiga zone is characterized by having the maximum values of acid deposition (Kiryushin et al 2013) unlike the territories of the northern taiga and tundra.
Data on acid deposition in these regions are limited, but where available they clearly show that this phenomenon has taken place (Protasov 2001, Semenov 2002, EMEP Status report 2010, State Reports 2012). According to these data, the precipitation of strong acids can be approximately estimated for natural areas ER and WS (meq/m2/year): в tundra and forest tundra—10–12 and 10–40, northern taiga—10–12 and 90–95, middle taiga—∼15 and 100–120, south taiga and mixed forests—17–22 and ∼110, and forest steppe and steppe—20–22 and ∼80.
2.2. Water sampling
We selected lakes typical for the climatic zones, with a preference for atmospherically fed systems. Large lakes or lakes affected by any sewage were excluded from studies as were lakes near industrial or urban centers. The surface area ranged from 0.4 km2–20 km2. A total of 201 small lakes in ER along this transect were sampled from 2000–2005, and 166 samples of lake waters in WS from the Yamal and the Gydan Peninsulas to the Kurgan Region (forest steppe) were collected from 2011–2014. The sampling was carried out during autumn turnover (from late September for tundra lakes to late November for lakes on the steppe) to minimize the effect of interannual and seasonal variations. Unabsorbent plastic bottles were used for sampling. The bottles were rinsed twice with lake water, then and placed into dark containers and cooled to 4 °C and transported to the laboratory as soon as possible (within 5–15 days).
Chemical analyses were carried out using techniques outlined in the Standard Methods for the Examination of Water and Wastewater (Eaton et al 1992). Analysis took place in three laboratories: the Laboratory of the Institute of North Industrial Ecology Problems, Kola Science Center (INEP RSC RAS); the Laboratory of Water Quality, Ecosystem Sustainability and Ecotoxicolgy, Tyumen University; and the Laboratory of the Institute of Water Problems of RAS. Analytical methods were standardized between the laboratories using a single method recommended by the 'International Cooperative Programme on Assessment and Monitoring of Acidification of Rivers and Lakes' (ICP-water) (Kvaeven et al 2001, Waters Programme Manual 2010). The quality of the analytical results of INEP RSC RAS was repeatedly tested by intercomparisons in the frame of the ICP water programs (Intercomparison 2010).
Each water sample was filtered through a membrane filter (0.45 μm pore size). Analyzed parameters included pH, conductivity (at 20 °C), alkalinity (Alk), main cations and anions, Si, total N (Ntot), dissolved organic carbon (DOC) and color. The concentrations of inorganic ions (Ca2+, Mg2+, K+, NH4+, Na+, SO42−, NO3−, NO2−, F−, and Cl−) were determined by ion chromatography (Dionex). The alkalinity was analyzed by acidimetric titration (endpoint pH = 4.5); Ntot and DOC was analyzed by Vario TOC Cube Elementar. Norg was calculated as the difference between Ntot and inorganic forms of N (ammonium, nitrates, nitrites). Where complete ionic analyses were available, we tested the validity of our results by checking the ion balance by subtracting the total anion charges (sum of Cl−, SO42−, NO3−, F1, and HCO3−) from the total cation charges (sum of Ca2+, Mg2+, Na+, NH4+, K+ and H+) and dividing by the total charges in solution (Murray and Wade 1996). The absolute value of percent difference between the total positive and negative charges should be lower than 15%. The acid-neutralizing capacity (ANC) was calculated according to the concentrations of major ions based on the charge balance approach using the below formula (Reuss et al 1987), where the square brackets indicate the ion concentrations. Organic anion concentrations (An−) were determined based on the empirical relationship suggested by Oliver et al (1983).
The ANC of water is generally used to estimate the anthropogenic acidification as the difference between cations and anions of strong acids (Henriksen et al 1992). The unit of ion concentration and ANC is meq · L−1. The ANC is calculated in two ways:

Where the chemical analyses are made reliably, values of ANC1 and ANC2 will be equal. When calculating the value of ANC we take into account aluminum ions and iron, as well as calcium and magnesium.
Discriminant analysis (Statistica 10) was used to establish the variability of water chemistry and differences between the two regions (acidified and neutral lakes). Redundancy analysis (RDA) (Statistica 10) was used to establish connections between the main chemical parameters.
3. Results and discussion
3.1. Water geochemistry and anthropogenic impacts
The main geochemical feature of both regions is an increase in cations and alkalinity concentrations in water toward the south and an increase in the content of mineral salts (in ER at 50–55°N and in WS at 57–62°N). In the southern regions, watersheds are characterized by natural salinization (Starikov and Tul'kova 2010), and the higher temperatures promote intensive evaporation, which results in an increase in the concentration of salts. Lakes of southern regions (forest steppe and steppe zones) have an extremely high buffer capacity (tables 1 and 2). ANC in both regions is more than 1000 μeq l−1, and therefore the water of these lakes is not affected by acidification. We can conclude that the lakes of forest steppe zones in ER and WS are highly resistant to acidification. Therefore, further discussion of these lakes is excluded. The low salinity and oligotrophic nature of the lakes in the tundra and forest tundra, and northern and middle taiga regions of ER and WS are also connected to the geochemical features. In the humid regions, lakes are vulnerable to acid deposition due to the low content of calcium and alkalinity in water, and have pH values from 4.5–7.0. In these zones there are lakes with very low ANC values.
Table 1. Hydrochemical characteristics of lakes of different natural zones in ER (the numerator—the median (bold), the denominator—the limits of contents).
| Natural zones | |||||
|---|---|---|---|---|---|
| Tundra and forest tundra | Northern taiga | Middle taiga | Mixed forests | Forest steppe and steppe | |
| Element | n = 35 | n = 73 | n = 97 | n = 53 | n = 20 |
| pH | 6.36 | 6.61 | 6.72 | 7.49 | 8.11 |
| 4.65–6.86 | 4.49–7.51 | 4.41–7.74 | 4.72–8.82 | 6.78–9.66 | |
| Color, 0Pt-Co | 20 | 34 | 52 | 45 | 23 |
| 5–69 | 0–125 | 4–202 | 8–156 | 10–120 | |
| Ca, mg l−1 | 1.08 | 2.24 | 2.87 | 21.2 | 43.9 |
| 0.44–2.11 | 0.18–5.85 | 0.91–9.58 | 3.31–50.0 | 14–132 | |
| Mg, mg l−1 | 0.73 | 0.66 | 1.10 | 3.75 | 15 |
| 0.40–1.39 | 0.06–5.23 | 0.92–4.20 | 0.60–15.6 | 1.2–74 | |
| K, mg l−1 | 0.34 | 0.41 | 0.64 | 0.77 | 15 |
| 0.15–0.80 | 0.05–2.27 | 0.10–3.67 | 0.10–8.10 | 1.3–23 | |
| Na, mg l−1 | 3.54 | 1.6 | 1.8 | 1.90 | 50.5 |
| 2.18–9.52 | 0.43–10.2 | 0.5–11.9 | 0.4–14.1 | 1.4–115 | |
| NH4+, μgN l−1 | 16 | 21 | 24 | 170 | 580 |
| 1.0–60 | 1–509 | 1–690 | 1–5440 | 180–1610 | |
| Alk, μeq l−1 | 70 | 161 | 175 | 1239 | 2400 |
| 0–135 | 0–839 | 15–839 | 50–2900 | 500–8500 | |
| SO42−, mg l−1 | 2.37 | 2.06 | 3.58 | 5.01 | 24.25 |
| 1.03–6.16 | 0.72–5.50 | 0.87–12.78 | 0.53–42.20 | 10.00–259.00 | |
| Cl−, mg l−1 | 5.33 | 1.08 | 1.22 | 2.13 | 34.50 |
| 2.95–15.40 | 0.40–9.35 | 0.39–14.90 | 0.44–24.00 | 0–119.00 | |
| NO−3 + NO−2, μgN l−1 | 1 | 2 | 4 | 86 | 120 |
| 1–15 | 1–480 | 1–595 | 1–840 | 20–220 | |
| A−, μeq l−1 | 18 | 30 | 38 | 44 | 32 |
| 6–49 | 1–89 | 7–117 | 15–151 | 7–271 | |
| Al, μg l−1 | 53.8 | 54.2 | 70.0 | 15 | 8.8 |
| 15.5–180.0 | 8.9–808.0 | 2.4–672.0 | 0–700 | 0.1–35.8 | |
| Fe, μg l−1 | 66.7 | 100 | 197 | 92 | 5.0 |
| 13.7–710.0 | 3–3160 | 9–3300 | 0–1100 | 0.1–204.0 | |
| Mn, μg l−1 | 1.5 | 3.8 | 15.0 | 12.3 | 1.24 |
| 0.2–18.0 | 0.3–37.8 | 1.3–94.0 | 0.1–144.0 | 3.06–17.70 | |
| ANC, μeq l−1 | 233 | 206 | 249 | 1349 | 2806 |
| −15–387 | −1–378 | 20–1020 | 173–2320 | 795–8778 | |
Table 2. Hydrochemical characteristics of lakes of different natural zones in WS (the numerator—the median (bold), the denominator—the limits of contents).
| Natural zones | |||||
|---|---|---|---|---|---|
| Tundra and forest tundra | Northern taiga | Middle taiga | South taiga | Forest steppe | |
| Element | n = 57 | n = 35 | n = 74 | n = 11 | n = 11 |
| pH | 6.29 | 5.38 | 5.70 | 7.13 | 7.92 |
| 4.81–7.71 | 4.54–7.17 | 4.50–7.74 | 6.50–7.63 | 7.47–8.75 | |
| Color, 0Pt-Co | 22 | 51 | 58 | 107 | 34 |
| 1–355 | 5–198 | 7–149 | 17–166 | 29–89 | |
| Ca, mg l−1 | 2.85 | 1.88 | 2.06 | 25.53 | 28.31 |
| 0.72–5.74 | 0.86–3.55 | 0.94–18.15 | 3.54–72.19 | 0.84–33.06 | |
| Mg, mg l−1 | 1.11 | 0.59 | 0.56 | 9.85 | 0.41 |
| 0.24–2.25 | 0.25–1.48 | 0.19–5.24 | 1.09–17.26 | 0.12–41.60 | |
| K, mg l−1 | 0.99 | 0.56 | 0.82 | 2.34 | 0.16 |
| 0.20–4.04 | 0.17–2.66 | 0.18–2.25 | 0.83–4.53 | 0.03–14.00 | |
| Na, mg l−1 | 1.89 | 1.72 | 4.34 | 11.11 | 0.39 |
| 0.60–5.87 | 0.70–9.51 | 0.92–20.62 | 2.47–24.81 | 0.15–70.02 | |
| NH4+, μgN l−1 | 170.3 | 45.6 | 57.8 | 27.9 | 648.3 |
| 10.2–1114.3 | 7.2–1529.9 | 6.3–1228.6 | 10.7–730.3 | 10.8–2578.0 | |
| Alk, μeq l−1 | 182 | 112 | 99 | 2814.9 | 6730 |
| 10–1502 | 0–306 | 0–1350 | 217–5210 | 5790–12 300 | |
| SO42−, mg l−1 | 0.64 | 0.48 | 1.42 | 0.88 | 0.67 |
| 0.22–2.79 | 0–2.50 | 0.59–16.00 | 0.58–3.55 | 0.16–6.11 | |
| Cl−, mg l−1 | 2.02 | 1.00 | 3.07 | 13.58 | 0.35 |
| 0.61–11.54 | 0.34–13.16 | 0.55–24.40 | 1.20–17.94 | 0.09–26.39 | |
| NO−3 + NO−2, μgN l−1 | 220 | 177 | 21 | 498 | 60 |
| 1–2022 | 5–530 | 0–1546 | 4–3873 | 3–829 | |
| A−, μeq l−1 | 16.72 | 50 | 69.67 | 66.98 | 125 |
| 0.1–81 | 3–116 | 0.75–187 | 28.1–97.3 | 89–185 | |
| Al, μg l−1 | 12.6 | 46.9 | 32.4 | 13 | 24.7 |
| 1.9–109.0 | 0.7–204 | 7.3–534.5 | 5–499 | 10.6–78.4 | |
| Fe, μg l−1 | 389 | 374 | 433 | 139 | 248 |
| 76–2328 | 0–1457 | 11–4186 | 64–1394 | 16–1820 | |
| Mn, μg l−1 | 3.06 | 0.93 | 5.68 | 4.70 | 4.72 |
| 0.13–8.46 | 0–8.46 | 1.98–29.7 | 2.13–30.0 | 1.10–24.00 | |
| ANC, μeq l−1 | 327 | 235 | 654 | 2592 | 3430 |
| 40–1399 | 71–356 | 110–6315 | 557–5255 | 227–19 314 | |
The differences in the chemical composition of the waters of the ER and WS lakes are shown in figure 2. The median pH water in WS is lower than in ER (by more than one pH unit). Water entering the lakes from the of swamp watersheds of WS is naturally acidic (pH ≤ 5) and highly colored (>100°Pt-Co), but the number of lakes with an extremely low pH (<5) was fewer in WS than ER. There is also a large number of lakes with very low alkalinity (less than 50 μeq l−1) in ER compared with the lakes in WS. The most significant differences between the lake water chemistry in ER and WS are observed in the content of basic anions.
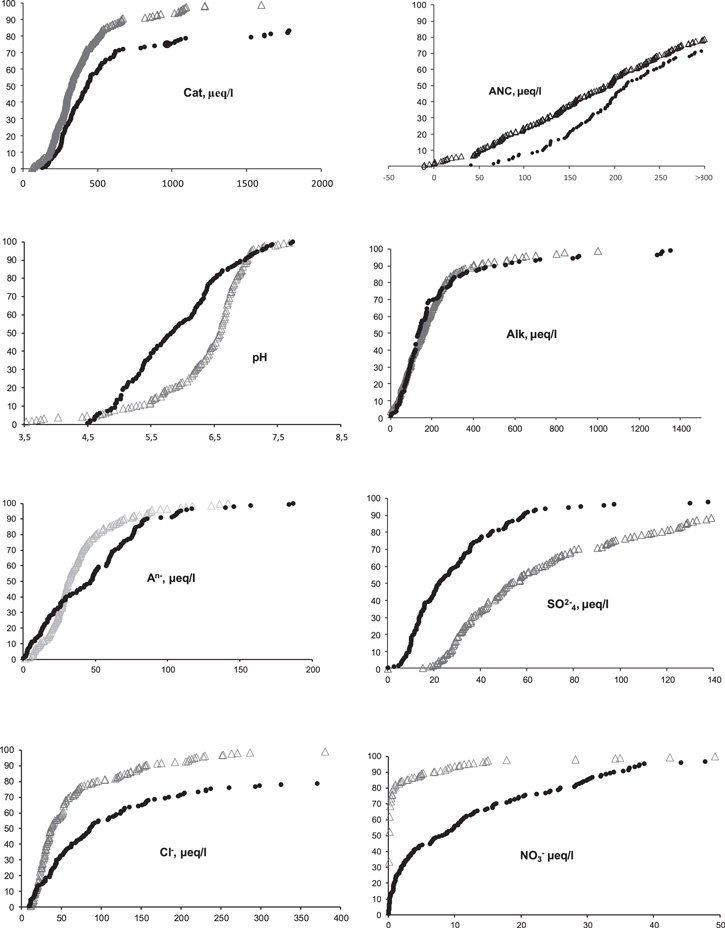
Figure 2. Results (%) of cumulative analyses of some components in water lakes in ER (∆) and WS (●).
Download figure:
Standard image High-resolution imageThe higher concentration of sulfates due to the development of the metallurgical industry was found in lakes in ER. The percentage of lakes with a high concentration of chlorides, nitrates, and organic ions was higher in WS than in ER. The high chloride content in the waters of WS can be explained by the following natural and (or) anthropogenic factors. WS is covered by a thick sedimentary cover; tertiary and quaternary rocks contain an amount of chloride (Arkhipov et al 1987). The chlorides present in the waters of WS are also due to pollution caused by the development of oil and gas fields with higher chloride contents in soils and waters surrounding areas of gas combustion (within a radius of 10 km) (Kiryushin et al 2013).
The higher content of nitrates, nitrites, and ammonium ions in the waters of WS is the result of natural and anthropogenic factors. The significantly higher nitrate content in lakes in WS is associated with the prevalence of wetlands, which leads to the natural enrichment of water by humic acids and Norg. According to our data, DOC is correlated with Norg:

Anthropogenic factors such as gas flaring (from oil production) сan lead to the formation of nitrates. Significant concentrations of NOx pollution are connected to the interaction between the molecular O2 and N2 from atmospheric air. However, the role of propane in the gas–oil composition at a temperature similar to the combustion temperature of the electric arc (3000 °C) is 17%–20%. In addition, possible NOx formation reactions in the atmosphere are characterized (Chambers 1993): anthropogenic sources of NOx play an important role in the pollution of environments in WS (particularly in the north, where there is the largest number of flares).
The explanatory variables to be tested in RDA were pH, DOC, this electrical conductivity (Cond), deposition, ANC1, and ANC2. All parameters are presented in logarithmic scale; the points (figure 3) indicate dependent variables (all components are used in the ANC calculation) whereas arrows (vectors) indicate the independent variables. The length of the vector indicates the importance of the variable in the analysis, i.e. the longer the vector the more confident one can be about the inferred correlation. RDA was conducted with a Monte Carlo permutation test.

Figure 3. RDA-ordination diagrams (сonnection between chemical components of (a) ER and (b) WS lakes): axes are independent variables (factors) that determine the behavior of other components; points are dependent variables that have an affinity for certain parameters.
Download figure:
Standard image High-resolution imageThe general agreement between the two methods of estimating ANC1 and ANC2 is indicative of high-data quality in the sense that the ion balances for these samples were essentially closed. Iron and aluminum have a greater affinity for organic matter (part a, figure 3) in ER than WS. Such relationships can be explained by the complexation of these cations with organic matter (humic nature) to a greater degree in organic matter in ER lakes (the Kola North) then in organic matter in WS lakes.
Moreover, in the case of manganese, a mixed type of speciation (anionic and cationic) may occur depending on the concentration of DOC (ER). In ER lakes, SO42−, Cl−, and NO3− mostly have an affinity for Cond. In WS SO42− mostly has an affinity for deposition, and Cl− for Cond; meanwhile, nitrate is inert to the selected axes. This can mean that there is a role of anthropogenic sulfate in the water chemistry of WS. It should also be noted that there is a clear inverse relationship between pH and deposition for WS.
3.2. Mechanisms of acidification
The majority of investigated ER and WS lakes are characterized by a pH of around 7.00 and color from 10–100° Pt-Co. In some lakes with low pH and high water transparency, the strong mineral acid (sulfates, nitrates, and chlorides) in the anionic composition dominate. In the tundra and the taiga zones of ER, 4.4% of the lakes have a pH < 6 and water color of waters <10°Pt-Co. In WS this proportion is 8.2%. In ER, 6.9% of the lakes have a color less than 30°Pt-Co and pH < 6, while in WS this is 17.2%. 2.0% of lakes in ER are highly acidified lakes with pH < 5 and color <30°Pt-Co (WS is 5.0%) (table 3).
Table 3. The distribution of lakes (%) by pH and color of water in the tundra–taiga zones (tundra and forest tundra, the northern and middle taiga) of ER and WS.
| Color, °Pt-Co scale | ||||||
|---|---|---|---|---|---|---|
| pH | <10 | 10–30 | 30–60 | 60–100 | >100 | n |
| ER | ||||||
| 4–5 | 1.0 | 1.0 | 0 | 1.5 | 1.0 | 201 |
| 5–6 | 3.4 | 1.5 | 1.5 | 0.5 | 2.9 | |
| 6–7 | 2.9 | 23.6 | 27.6 | 14.3 | 3.9 | |
| 7–8 | 0.5 | 3.4 | 8.4 | 0.5 | 0.5 | |
| WS | ||||||
| 4–5 | 2.5 | 2.5 | 2.5 | 5.7 | 3.3 | 166 |
| 5–6 | 5.7 | 6.5 | 13.1 | 7.4 | 8.2 | |
| 6–7 | 2.5 | 6.5 | 5.7 | 6.5 | 4.1 | |
| 7–8 | 0 | 6.5 | 4.9 | 0.8 | 6.5 | |
The analysis of publications devoted to the study of the mechanisms of acidification of water shows a great variability in the contribution of natural and anthropogenic factors to this process. It is shown that acidification of water can develop with the dominance of one factor (most often technogenic sulfates and nitrates) or with a combination of several factors (Wright et al 1988. Kramer et al 1989, Camargo and Alonso 2006, Evans et al 2008, Evans et al 2011, Zhang and Nelson 2013, Yu et al 2017). In most cases the acidification mechanism is determined by a combination of several factors that can mutually reinforce or neutralize each other. We will consider the contribution of the different factors to the acidification of small lakes. Figure 4 shows the ionic composition of the strongly acidic lakes (with a pH < 5) in ER and WS. The water of the acidic lakes (pH < 5) of ЕR and WS contained various acids anions: sulfates, nitrates, chlorides, and organic anion.
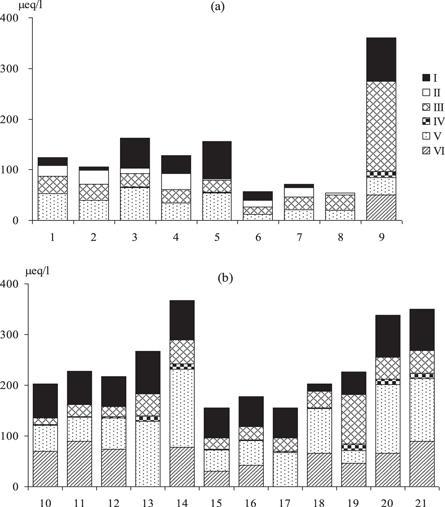
Figure 4. The anionic composition (I—strong organic acid, II—weak organic acid, III—SO42−, IV– NO3−, V– Сl−, VI– HСO3−) of the lakes with pH < 5 in (a) ER (1—in the forest, 2–8—in the northern taiga, 9—in the middle taiga) and (b) WS (10–12 in the tundra, 13–14—in the northern taiga, 15–21—in the middle taiga). Lake locations: 1—68°28' N 35°10' E, 2—69°04.3' N 30°11.8' E, 3—68°06.2' N 34°01.9' E, 4—68°05.8' N 34°04.5' E, 5—68°06.2' N 34°02.1' E, 6—67°19.6' N 34°13.4' E, 7—67°20.7' N 34°13.6' E, 8—67°01.8' N 33°28.0' E, 9—62°13' N 33°20' E, 10—67°07.2' N 76°20.5' E, 11—67°08.0' N 76°18.7' E, 12—67°08.2' N 76°19.8' E, 13—63°14.9' N 75°34.0' E, 14—63°10.5' N 75°34.1' E, 15—61°28.1' N 74°13.1' E, 16—61°32.8' N 74°15.1' E, 17—61°29.8' N 74°14.6' E, 18—61°52.4' N 66°34.7' E, 19—60°36.0' N 66°03.0' E, 20—61°35.6' N 72°33.0' E, 21—61°35.4' N 72°36.6' E.
Download figure:
Standard image High-resolution image3.2.1. Sulfates and nitrates
Lake water acidification due to anthropogenic sulfate is a characteristic of ER. There is a similar distribution of anionic composition for acidified lakes in Scandinavia (Henriksen et al 1998) and the Kola Peninsula (Moiseenko 1994). The concentration of nitrates is extremely low (near 0.1–0.2 μeq l−1) and nitrates do not influence acidification in ER.
Nitrates in the water of the WS contribute to the anionic composition of strongly acidic lakes (lakes 14, 15, 19, 20, 21), but their contribution is not dominant. The higher content of nitrates in the waters of the lakes in WS, in comparison with the lakes ER (figure 4), is a consequence of both natural and anthropogenic factors. Natural factors include its inflow in the composition of organic matter. Anthropogenic factors include the regional combustion of gas in the process of oil production, which is typical for WS.
3.2.2. Chlorides as a factor of acidification
Chlorides dominate the strongly acidic lakes of WS (pH < 5) (lakes 13, 14, 20, 21). Chlorides in waters are usually equilibrated with sodium. In ANC calculations, Henriksen et al (1992) assumed that chlorides are of marine origin and all ions are corrected for by removing marine aerosols using their ratio in marine aerosols. This method is correct for the waters of Scandinavia, as well as the northern part of ER. A number of studies have shown that Na+ can be absorbed from marine aerosols due to ion exchange processes in catchments with cation-poor soils, followed by the release of protons and HC1, which enter the water and result in a lowering of pH (Wright et al 1988, Moiseenko et al 2001, Evans et al 2011).
Evans et al (2011) presents an analysis of the effect of HCl on acidification mechanisms in the UK. It is shown that due to high lability, Cl can indirectly promote the acidification of water during passage through the soil layer. High chloride content is a feature of the natural waters of WS, caused mainly by geochemical factors. The Cl/Na ratio in rocks is close to that in seawater, about 1.17; therefore, as a rule in lakes the chlorides are equilibrated with sodium. In acidic lakes of WS, this ratio moves toward increasing chlorides, which indicates the contribution of this anion to the acidification of waters.
3.2.3. Humus acids and their acid–base properties
In humid areas of both regions, the lakes with high water color and high concentrations of humic acids are widely distributed. In some acidic lakes (ER 3, 4, 5, 6; and WS 10, 11, 15, 16) organic anions are important components of water acidification. Natural processes of humic acid leaching (allochthonous organic matter) from wetland watersheds to lakes causes naturally low-pH waters. In both regions there are naturally acidified lakes as a consequence of waterlogging in the humid regions. Previous work (Monteith et al 2007, Clark et al 2013) has shown the nature of organic matter acid–based properties. Here we calculated the contribution of strong and weak acids in water for the acidification of lakes in ER and WS based on one method using data for the balance of water chemical composition in each lake. The calculation algorithm takes into account the whole structure of the cationic and anionic groups, including carbonates and bicarbonates. The estimated data reveal significant differences in the proportion of weak and strong acids (figure 5).

Figure 5. Scattering values graphic of the canonical functions that discriminate against groups of lakes (G_1: 1—with a pH < 6 and G_2: 2—with a pH > 6 for ER; G_3: 3—at pH < 6 and G_4: 4—at pH > 6 for WS).
Download figure:
Standard image High-resolution image
Humus acids are heteropolycondensates with the properties of hydroxy and amino acids, which contain various functional groups. They have varying molecular sizes and different degrees of compaction. The ability of humic acids to dissociate depends on the type of functional group and the presence of electron-donating and/or electron-withdrawing groups.
In the natural waters of WS the content of weak organic acids is very low; pH is mainly formed by the dissociation of strong acids due to the specific cation–anion composition of natural waters. In the natural waters of ER the proportion of weak acids is more significant than for WS lakes (even in lakes with high color) and is associated with large variations in the ionic composition of the water. Humus substances such as the high-molecular organic compounds due to mesmeric and inductive effects are capable of disproportionation reactions. Furthermore, humus acids can react through electrophilic and nucleophilic substitution and with inorganic anions and cations, and can form lower molecular weight fragments, which results in forming new protons and reducing the water's pH (Clark et al 2013).
In the humid areas of ER, lakes with high water color along with a high content of natural humic substances can also contain high concentrations of technogenic sulfates, which may have some influence on mesomeric effects in the structure of humus substances. In WS, in lakes with high color, anions of strong acids are present (chlorides, sulfates, and nitrates), and it is possible that there is a similar process for the geochemical conversion of humic substances.
In this situation, it is difficult to separate the natural from the anthropogenic origin of acidification of lakes. These results clearly show the effect of a number of factors that strengthen the acidity of water and prove that natural waters with a high content of humic acids are vulnerable to anthropogenic acidification.
3.3. Discrimination of ER and WS lakes, and of lakes with pH < 6 and pH > 6
It was important for us to assess the reliability of the difference between lakes among the regions, and also to identify groups of acidic and neutral lakes based on the chemical composition of the waters. It was also important for us to identify the main components that determine these differences. Discriminant analysis (discriminant function analysis) was used to study the structure of differences between the chemical compositions of water lakes from the humic regions of ER and WS (including acidic lakes) (table 4, figure 5). The calculations were made for two discriminatory models.
Table 4. Characteristics of variables (important in bold) of two lake discrimination models using water chemistry parameters (model 1 discriminates between the lakes of ER and the lakes of WS; model 2 discriminates between lakes with pH < 6 and pH > 6, in both ER and WS).
| Model 1 | Model 2 | |||||||
|---|---|---|---|---|---|---|---|---|
| Parameter | Wilks' lambda | F-remove (1,32) | p-level | 1-Toler. (R-Sqr.) | Wilks' lambda | F-remove (3,32) | p-level | 1-Toler. (R-Sqr.) |
| Ca | 0.2883 | 2.03 | 0.154 875 | 0.84 | 0.1967 | 4.02 | 0.007 886 | 0.91 |
| Mg | 0.2865 | 0.01 | 0.915 431 | 0.82 | 0.1916 | 1.12 | 0.340 424 | 0.79 |
| Na | 0.2901 | 4.08 | 0.044 167 | 0.69 | 0.1954 | 3.27 | 0.021 439 | 0.93 |
| K | 0.2979 | 12.76 | 0.000 408 | 0.29 | 0.1946 | 2.80 | 0.040 285 | 0.22 |
| Alk | 0.3153 | 32.06 | 0.000 000 | 0.88 | 0.2269 | 21.12 | 0.000 000 | 0.83 |
| SO4 | 0.3058 | 21.53 | 0.000 005 | 0.31 | 0.2054 | 8.95 | 0.000 010 | 0.76 |
| Cl | 0.2897 | 3.53 | 0.059 174 | 0.70 | 0.1951 | 3.11 | 0.026 623 | 0.89 |
| NH4 | 0.2950 | 9.52 | 0.002 212 | 0.50 | 0.2076 | 10.20 | 0.000 002 | 0.50 |
| NO3 | 0.3271 | 45.29 | 0.000 000 | 0.44 | 0.2239 | 19.47 | 0.000 000 | 0.42 |
| TN | 0.2888 | 2.61 | 0.107 206 | 0.69 | 0.1938 | 2.35 | 0.072 208 | 0.66 |
| TP | 0.2888 | 2.61 | 0.107 459 | 0.53 | 0.1951 | 3.10 | 0.026 987 | 0.50 |
| Color | 0.2870 | 0.55 | 0.459 440 | 0.70 | 0.1906 | 0.53 | 0.661 446 | 0.69 |
| DOC | 0.2885 | 2.24 | 0.135 593 | 0.76 | 0.1983 | 4.93 | 0.002 313 | 0.74 |
| Si | 0.312 74 | 29.23 | 0.000 000 | 0.27 | 0.2278 | 21.66 | 0.000 000 | 0.24 |
| Al | 0.2950 | 9.52 | 0.002 208 | 0.29 | 0.2015 | 6.72 | 0.000 207 | 0.26 |
Discrimination model 1 characterized the differences in water chemistry between two groups of lakes: the first group were lakes of ER, and the second group were lakes of WS. Based on the criterion of F-remove, fundamental differences in the chemical composition of the waters were found, such as in alkalinity, sulfates, nitrates, and silicon.
Discrimination model 2 considered the differences between four groups of lakes: in ER with pH < 6 and pH > 6, and in WS with pH < 6 and pH > 6. Alkalinity, sulfates, and nitrates are the most important parameters showing the differences between groups. These four groups are different in their content of organic matter, and a similar model is characterized for Cl.
The variety of natural and anthropogenic factors in the flow and distribution of chloride and organic matter in the WS lakes complicates the results of discriminant analysis. The range of variation of major ions is wider in WS (table 2) than in ER due to the continental climate; for example, large-amplitude oscillations of seasonal and daily temperatures could increase the range of leaching conditions and the formation of the chemical composition of lake waters. These variations are maximized for chlorine; therefore, it is not a discriminatory parameter.
In conclusion, the largest contributions to the discrimination of acidic and neutral lakes are the alkalinity, sulfates, and nitrates, and, to a lesser extent, chlorides and organic matter.
The extent of differences of acidic lakes in ER and WS is also illustrated by the canonical analysis. Figure 5 shows graphs of the scattering in the projection 1 and 2 roots of the first and second functions to illustrate the best discrimination between the different lake groups. The WS lakes are located on the left side of the 0 value on the horizontal axis, while the ER lakes are on the right side. Acidic lakes are located above value 0 along the vertical axis, and a lake with neutral and alkaline conditions are below. The considered group of lakes are concentrated in different sectors according their differences on an indicators range. The 'overlap' is observed more among lakes with pH < 6 and pH > 6 in ER than between the lakes of WS.
Thus, the chemical composition of ER and WS lakes is significantly different, and the maximum differences are observed in the anion composition of chemical parameters (alkalinity, sulfates, and nitrates) that form the acid–base properties of the water.
4. Conclusion
For the first time in the territory of Russia, using a study of two large regions, the specific features of the chemical composition of lake waters are investigated. Waters of small lakes (without a direct source of pollution) reflect zonal, regional, and local characteristics, as well as the contributions of atmospheric pollutant deposition. The main air pollution is possibly by emissions from ferrous and nonferrous metallurgy industries (ER) and the flaring of gas (WS). The geographic gradients increase the concentration of cations and alkalinity of lake waters from the north to the south due to geochemical factors; in southern regions (forest steppe) the lakes are resistant to acidification. In the humid areas of ER and WS acidic lakes are identified.
The mechanism of acidification is determined by the combined effect of natural and anthropogenic factors. In strongly acidified lake waters (pH < 5), the dominant anions are sulfates in ER, and chlorides, sulfates, and organic acids in WS. Chlorides are not always balanced by sodium because of ion exchange in the catchment area, where they are able to produce protons and contribute to acidification. Organic acids, when interacting with technogenic acids, can enhance the acidic properties of water by splitting off the proton. Discrimination analysis shows that lakes of ER and WS differ considerably in a number of parameters including alkalinity, sulfates, and nitrates. The acidic (pH < 6) and neutral lakes (pH > 6) are identified by discriminant analysis in each of the zones.
The investigation of the chemistry of small lakes has shown how anthropogenic factors affect the chemical composition of surface waters. Our results underline that anthropogenic processes, such as the acidification of waters, are important mechanisms in aquatic systems. Water quality changes under the influence of nonpoint pollution sources: metallurgical production (ER) and the burning of associated gases (WS) have been identified despite the lack of direct sources of pollution. The overall result of such processes is the development of acidification. In recent years, cleaning of air emissions due to significantly modernized enterprises has reduced the emission of acid gases. However, our research shows for the first time the need for the introduction of a post-treatment phase in metallurgical and gas-processing plants.
Acknowledgment
This research was done within the RFBR grant 18-05-60012/18.