

Abstract
Amazonian rainfall plays a critical role in the global climate system and the hydrological cycle. It is thus important to quantify changes in the Amazonian rainfall and clarify its mechanism. Previous studies indicate that the interannual variability of Amazonian precipitation could be largely attributed to variabilities in the South American monsoon system and the El Niño Southern Oscillation. However, the trend of the wet season tropical Amazonian precipitation during recent decades is not very well investigated. In this study, by combining both satellite and in situ observations, it is revealed that tropical Amazonian precipitation has significantly increased by ∼180 to 600 mm (in different datasets) in the wet season during the satellite era from 1979 to 2015. We then use a state-of-the-art atmospheric model to simulate the impact of the tropical sea surface temperatures (SSTs) on the precipitation changes. Results show that the multidecadal warming of the tropical Atlantic has contributed more than half of this precipitation change over the past three decades, while the east Pacific cooling plays a secondary role. We finally combine the simulation results and the reanalysis data to investigate the mechanisms of this process, i.e. the SST variability dramatically increases the convergence of the moisture transport over the Amazon region. The precipitation changes over the Amazon region largely impact on the local hydrological cycle and the ecosystem, and have important impacts on the global climate system by mediating the teleconnection between the Pacific and the Atlantic oceans. Our results show that the long-term change in the wet season Amazonian precipitation is important and deserves further investigation and discussion.
Export citation and abstract BibTeX RIS

Original content from this work may be used under the terms of the Creative Commons Attribution 3.0 licence. Any further distribution of this work must maintain attribution to the author(s) and the title of the work, journal citation and DOI.
Corrections were made to this article on 23 November 2020. The affiliations were amended.
1. Introduction
The Amazon region is very important for the global climate and the hydrological system. The rainforest provides about 20% of the Earth's freshwater discharge, and regulates the Earth's carbon cycle (Foley et al 2002). The Amazon basin is one of the most important global convective centers, which serves as a heat and moisture source for the global atmosphere system through the convective pump. This tropical deep convection has an impact on the precipitation, the meridional heat transport (Riehl and Malkus 1958), and the troposphere-stratosphere exchanges (Holton et al 1995, Sherwood and Dessler 2000), and may potentially affect the tropical atmosphere-ocean interactions and the inter-basin teleconnections (Li et al 2016). Beyond that, wet rainforests are home to a variety of biological systems (Lewinsohn and Prado 2005). As a result, investigating the variability and the changes in Amazonian rainfall are among the top priorities of climate study.
Amazonian precipitation is associated with the South American monsoon system (SAMS) (Rao and Hada 1990, Zhou and Lau 1998, Gan et al 2004, Marengo et al 2012), and is remotely related to the South Atlantic Convergence Zone (Nogués-Paegle and Mo 1997, Liebmann et al 1999, Robertson and Mechoso 2000, Carvalho et al 2002, 2004). The precipitation annual cycle features distinct wet and dry seasons between the equator and 25°S (Marengo et al 2012). In most SAMS regions, precipitation peaks in austral summer (Gan et al 2004, Marengo et al 2012). But in northwestern and central Amazon regions the peak of precipitation occurs in spring (March-May) (Marengo et al 2012), and to the north of the Equator the wet season is in austral winter (Grimm 2003). The intra-seasonal and interannual variability of Amazonian precipitation has been widely investigated. During the wet season, Amazonian precipitation is primarily dominated by the deep convection (Greco et al 1990) and may be further driven by variations in sea surface temperatures (SSTs). Seasonality of SSTs in the tropical Pacific and Atlantic has an important influence on precipitation in the eastern Amazon during the equinox seasons (Fu et al 2001). Many studies indicated that the El Niño Southern Oscillation (ENSO) has an important influence on the rainfall in South America (Rao and Hada 1990, Paegle and Mo 2002, Grimm 2003, 2011). The El Niño events usually enhance the precipitation in east-central South America and decrease the equatorial precipitation during the wet season. These precipitation variations are tightly associated with the adjustment of the Walker circulation and the Rossby wave trains (Grimm 2003). The influences of the ENSO events on South America precipitation can also be adjusted by decadal climate variability (Kayano and Andreoli 2007, Kayano and Capistrano 2014, Kayano et al 2016). In addition, interannual variability of Atlantic SST also impacts on South America precipitation (Yoon and Zeng 2010). A pattern of anomalous SST and wind stress asymmetric relative to the equator is the principal mode of interannual and longer variability over the tropical Atlantic, and negative rainfall anomalies to the south of the equator during MAM (March, April and May) are connected to an early withdrawal of the Intertropical Convergence Zone toward the warm SST anomalies over the northern tropical Atlantic (Nobre and Shukla 1996). The North Atlantic Sea Surface Temperature Anomaly (SSTA) probably has a direct association with rainfall north of 15°S in South America, and rainfall in northeast Brazil seems to be related to South Atlantic SSTA (Enfield 1996). The 2005 drought, for example, is more related to the tropical Atlantic variability rather than the ENSO event (Marengo et al 2008).
Amazonian precipitation has also experienced long-term changes and variability. Previous studies indicated that southern Amazonian precipitation has increased in the second half of the 20th century (Marengo 2004). It was also reported that the duration of the SAMS significantly changed in the 1970s, extending from 170 days (1949–1972) to 195 days (1972–1982) due to the enhanced moisture flux (Carvalho et al 2011). In recent decades, however, the dry season has been prolonged in the southern Amazon (since 1979), which is partly driven by the SST variability of the tropical Pacific and Atlantic, and is closely related to the shift of the subtropical jet in austral winter (Fu et al 2013). Zhang et al found that precipitation surplus (deficit) in the Amazon River basin during JJA (June, July and August) can be caused by the positive (negative) Pacific Meridional Mode (Zhang et al 2017); but only the tropical Atlantic meridional SST gradient is strongly associated with southern precipitation in JJA (Good et al 2008). Moreover, with the reductions in reflective aerosol pollution in the Northern Hemisphere, the risk of dry season (July-October) severe droughts (such as the 2005 droughts) is rapidly increasing over the Amazon in the 21st century (Cox et al 2008). Recent studies reported that the hydrological cycle in the Amazon region has been intensified since the 1990s (Gloor et al 2013). Most of these studies focused on either the southern Amazonian region or on the dry season. However, the changes in tropical Amazonian precipitation during the wet season in recent decades are not very well investigated, which is the main focus of this study.
In the rest of this paper, we describe the datasets and the analysis methods used in the study in Part 2. We then examine the changes in the wet season tropical Amazonian precipitation in Part 3.1, by comparing three observational and three reanalysis datasets, independently. In all datasets, tropical Amazonian precipitation has significantly increased over the past three decades during the wet season. In Part 3.2, we investigate the impacts of tropical SSTs on the observed precipitation changes by using atmospheric model simulations. The results show that Atlantic warming and the east Pacific cooling largely contribute to the observed rainfall trend. We finally investigate how SST forcing enhances the moisture flux to the tropical Amazonian region in Part 3.3, followed by the conclusion and discussion in Part 4.
2. Data and methods
To examine the changes in Amazonian precipitation from 1979 to 2015, we compared three observational and three reanalysis datasets, based on both satellite and in situ measurements: (1) the GPCP (Global Precipitation Climatology Project) observational data, which combines measurements from rain gauge stations, satellites, and sounding observations from 1979 to the present (Huffman et al 2009); (2) the CRU TS version 3.24 (Climatic Research Unit Timeseries version 3.24) observational data, which is mainly based on meteorological stations across the world's land areas (Harris et al 2014); (3) the CMAP (CPC Merged Analysis of Precipitation) observational data, which is a reconstruction of gauge stations and satellite observations (Xie and Arkin 1997); (4) ECMWF (the ERA-Interim reanalysis data from the European Centre for Medium-Range Weather Forecasts) (Dee et al 2011); (5) CFSR (Climate Forecast System Reanalysis) reanalysis data, based on the Climate Forecast System (CFS) model in the National Centers for Environmental Prediction (NCEP) (Saha et al 2010); and (6) MERRA2 (Modern-Era Retrospective Analysis for Research and Applications version 2), which is a NASA atmospheric reanalysis for the satellite era using the Goddard Earth Observing System Model, version 5 (GEOS-5) with its Atmospheric Data Assimilation System (ADAS), version 5.12.4 (GMAO 2015). We adopt the precipitation generated by the Atmosphere General Circulation Model (AGCM) within the cycling MERRA2 system. All six datasets show a very similar phenomenon, achieving a robust conclusion that the wet season Amazonian precipitation has dramatically increased. In addition, we use an observed SST dataset (HadISST) (Rayner et al 2003) to examine decadal climate trends for 1979–2015. We adopt Sen's slope method to calculate the 36-year trends of the precipitation in both the observational/reanalysis datasets and the atmospheric model simulations. We use the Mann-Kendall method to evaluate the significance level of the trends. Sen's slope chooses the median value of the slopes of all lines through each pair of two-dimensional sample points (Sen 1968). The Mann-Kendall method is a non-parametric trend test method, which is also better suited to type variables and ordinal variables (Gilbert 1987).
Previous studies have found that models tend to produce excessive convective precipitation. But the ratio of large-scale to total precipitation is higher in the Community Atmosphere Model version 4 (CAM4) than in CAM5 at comparable resolution, which means that CAM4 is closer to Tropical Rainfall Measuring Mission observational estimates than CAM5 (e.g. Bacmeister et al 2014, Dai 2006). We use CAM4 to investigate the atmospheric responses to SST changes in different ocean basins. In the experiments for each ocean basin (the Pacific, the Atlantic, and the Indian Ocean), we perform an ensemble simulation with 12 ensemble members. These ensemble members have different initial conditions. We first performed CAM simulation forced by climatological forcing for 12 model years. The restart files for each year are used as the initial condition of the 12 ensemble members. The four experiments (each with 12 ensemble members) were forced by the observed SST variability over the tropical ocean, the tropical Atlantic, the tropical Pacific, and the tropical Indian Ocean, respectively, from 1979 to 2015, while the SST forcing over other ocean areas is fixed with the seasonal varying climatological SST. There are buffer zones (10 degrees) between the observational SST forcing areas (tropical oceans) and the climatological SST forcing areas. The ensemble mean of these 12 members is considered as the atmospheric model response to SST forcing in the target ocean basin. In addition, we run a suite of experiments according to the following settings. First, we run an experiment using the seasonal cycle embedded in the climatology of the observed SST change (control experiment). Second, we run perturbation experiments with this seasonal cycle overlapping the observed anomalies associated with SST anomalies in the Atlantic. Third, we subtract the control experiment results from those of the perturbation experiment. This can also isolate the impacts of SST anomalies from different basins. We call this experiment the perturbation experiment, and this method is the same as that mentioned in Zhang et al (2018).
3. Results
3.1. Observed Amazonian precipitation during the wet season
The wet season in the tropical Amazonian region is usually considered to be from December to May, with a rainfall peak in the equatorial Amazon region in March, April, and May (Marengo et al 2012). Figures 1(a)–(f) show a trend in the DJFMAM (December, January, February, March, April, and May)-averaged precipitation from 1979–2015 in all six observations and reanalyses. All of the three observational datasets show significant positive trends in the equatorial Amazon, although the 'wet areas' are slightly different among these three datasets. In the reanalysis, the positive trends are much stronger than those in the observations. Even in subtropical regions, the reanalysis datasets show significant trends. The 'wet regions' in the ERA-Interim and the CFSR are almost identical, while the rainfall enhancement in MERRA2 data only appears in the north of the equatorial western Amazon. The result of MERRA2 is probably related to the atmospheric observing system and data processing. Reichle et al (2017) indicated that the bias of the MERRA2 precipitation is strong in many tropical and subtropical areas, especially in South America, during DJF (December, January, and February). All six datasets show robust wet changes over the equatorial Amazon. However, the six datasets show different amounts of precipitation changes. This motivates us to further quantify and compare the rainfall trends among different datasets.

Figure 1. The DJFMAM-averaged precipitation change from 1979–2015 in observation and reanalysis over South America. (a) GPCP, (b) CRU TS v3.24, (c) CMAP, (d) ERA-Interim, (e) CFSR, (f) MERRA2. Stipples in panels (a-f) indicate areas with trends that are significant at the 95% confidence level. These results indicate that there is more precipitation over the tropical Amazon.
Download figure:
Standard image High-resolution imageWe calculate the area-averaged precipitation changes over the equatorial Amazon region (8°S-5°N, 75°W-55°W, as shown in figure 1(a)), in order to quantify the DJFMAM precipitation changes in different datasets. Figure 2(a) shows the total amount of the precipitation changes, together with the confidence interval. Figure 2(b) displays the precipitation changes in six different months (DJFMAM) from 1979–2015. All measurements show significant increases in the precipitation, although the area-mean rainfall changes in the observations are comparatively weaker than those in the reanalysis. The total precipitation changes range from 180 to 600 mm (in the six months of DJFMAM, from 1979 to 2015) across different measurements (figure 2(a)). Figure 2(b) indicates that the rainfall is strengthened over all six months from December to May, while the peak season usually appears in March, when precipitation increased by 63–168 mm (in different datasets). However, the magnitude of the changes in MERRA2 is smaller than the others (figure 2(b)), and precipitation in February even decreases. This is because precipitation has reduced over most regions of the equatorial western Amazon during February (figure 3), which results in a negative spatially averaged precipitation change for this month. Overall, the precipitation has been dramatically increased over the tropical Amazon.
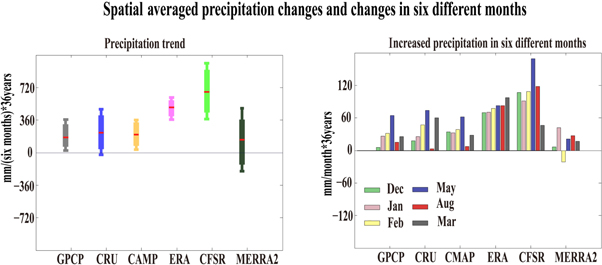
Figure 2. Spatial averaged precipitation changes and changes in percentage over six different months. (a) Box and whisker plots showing values with 95% confidence intervals, and the band inside the box is the calculated tropical Amazon (8°S-5°N, 75°W-55°W) mean precipitation changes from 1979–2015. The ends of the whiskers represent the 99% confidence intervals. (b) Precipitation changes over six different months (DJFMAM) from 1979–2015. These results indicate that the precipitation has dramatically increased over the tropical Amazon.
Download figure:
Standard image High-resolution image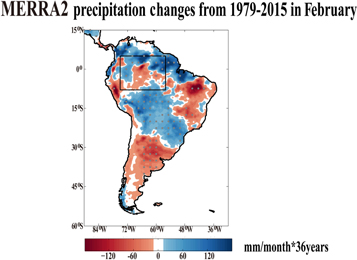
Figure 3. MERRA2 precipitation changes from 1979–2015 in February. Stipples in the figure indicate areas with trends significant at the 95% confidence level. This figure indicates that precipitation has reduced over most of the equatorial western Amazon during February.
Download figure:
Standard image High-resolution imageAll six measurements show identical phenomena, indicating a robust signal that the precipitation increases over the tropical Amazon during the wet season. It is necessary to investigate the sources and mechanisms of these changes. Previous studies show that the tropical SST anomalies may impact Amazonian precipitation (e.g. Rao and Hada 1990, Paegle and Mo 2002, Grimm 2003). We thus further use an atmospheric model (i.e. CAM4) to isolate the impact from each ocean basin on the multidecadal Amazonian precipitation changes.
3.2. Sources of the precipitation changes
The climate system experienced several decadal oscillations, including the Pacific Decadal Oscillation (Newman et al 2016) and the Atlantic Multidecadal Oscillation (Kerr 2000, Knight et al 2006). In tropical oceans, these oscillations form a tropical dipole SST mode (Li et al 2016), with warming trends over the tropical Atlantic, the Indian Ocean, and the west Pacific, and a cooling trend over the east Pacific (figure 4, Kosaka and Xie 2013, McGregor et al 2014, Watanabe et al 2014, Kamae et al 2017). We thus design atmospheric model simulation experiments and the perturbation experiment to isolate the roles of these multidecadal processes on the Amazonian precipitation changes.
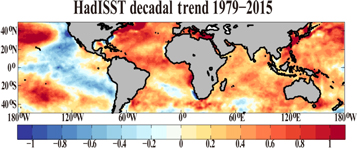
Figure 4. The HadISST decadal trend 1979–2015. Observed decadal trends of SST (K 37  ) for 1979–2015. Averages for December to May. There is abundant evidence showing that the tropical SST trend features warming over the tropical Atlantic, Indian Ocean, and western Pacific and cooling over the eastern Pacific.
Download figure:
Standard image High-resolution imageThe spatial distributions of precipitation simulated by CAM4 for DJFMAM, DJF and MAM are compared to those derived from the reanalysis precipitation averaged over the period of 1979–2015 (figure 5). The simulation results reproduce the seasonal change and spatial distribution of precipitation over the equatorial Amazon well, although the model underestimates southern Amazonian rainfall in MAM and overestimates it around the Andes. Overall, the model captures the pattern of precipitation. Hence, the atmospheric model simulations allow us to isolate the impact from each ocean basin. Figure 6 shows CAM4 simulation results forced by the entire tropical oceans, as well as by the three tropical ocean basins: the tropical Atlantic, the tropical Pacific, and the tropical Indian Ocean, respectively. In each of these experiments, the SSTs over the target region (e.g. the tropical Pacific) are driven by the monthly varying Hadley SST data from 1979 to 2015, while the SSTs outside the target region are replaced by the climatological-mean SST during the same period. For each of these four experiments, we perform 12-member ensemble simulations, while the ensemble mean is considered as the model response to the SST variability over the target ocean. The entire tropical ocean experiments (figure 6(a)) successfully reproduced the tropical Amazonian precipitation changes, indicating that the rainfall changes may be primarily driven by the tropical SST variability. When isolating the effect from different ocean basins, we found the tropical Atlantic (figure 6(d)) plays a leading role in strengthening the precipitation. The Atlantic-induced precipitation change is about 540 mm (for DJFMAM) in the CAM model, contributing to more than 60% of the total rainfall changes. The perturbation experiment shows nearly identical results with the first experiment. Significantly increased precipitation appears over the most equatorial Amazon regions during the wet season (DJFMAM) in the tropical Atlantic SST forcing, although the change in precipitation is not obvious in parts of the southern Amazon (figure 7). This result increases the robustness of our conclusions. On the other hand, the model responses to the tropical Pacific (figure 6(g)) and Indian Ocean forcing (figure 6(j)) also show a distinct 'wet belt' feature over equatorial South America, although the impacts of these two basins are comparatively weaker than the Atlantic. Moreover, compared with tropical Pacific forcing, the Indian Ocean forcing has less impact on this region.
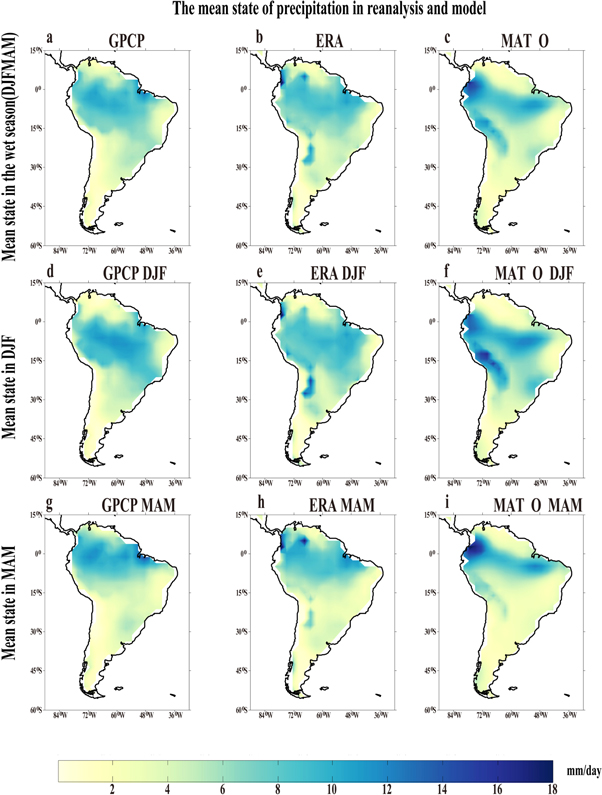
Figure 5. Comparison of the mean precipitation between reanalysis and the model. (a), (d), (g) are the precipitation for GPCP; (b), (e), (h) are the precipitation for ERA; and (c), (f), (i) are the precipitation for the model which is driven by entire tropical ocean forcing. (a), (b), (c) show the mean precipitation during the wet season; (d), (e), (f) show the mean precipitation in DJF; and (g), (h), (i) show the mean precipitation in MAM. The simulation result in the model reproduces the seasonal change and spatial distribution of precipitation over equatorial Amazon well, although the model underestimates southern Amazonian rainfall in MAM and overestimates it around the Andes.
Download figure:
Standard image High-resolution image
Figure 6. CAM4 simulated precipitation changes driven by SST anomalies in different oceans. Stipples indicate areas with changes that are significant at the 95% confidence level. Results show the precipitation changes driven by the entire tropical oceans (a)–(c), the tropical Atlantic forcing (e)–(f), the tropical Pacific forcing and (g)–(i), the tropical Indian Ocean forcing (j)–(k), respectively. (a), (d), (g), (j) show the total precipitations; (b), (e), (h), (k) show the convective precipitation; and (c), (f), (i), (l) show the large-scale precipitation. Results indicate that the tropical Atlantic SST changes play a key role in changing the tropical Amazonian convective precipitation, whereas the tropical Pacific has a secondary impact.
Download figure:
Standard image High-resolution image
Figure 7. The precipitation in the wet season forced by tropical Atlantic forcing in the peturbation experiment. Significantly enhanced rainfall is observed over most of the equatorial Amazon. This result agrees reasonably with the results from our simulation.
Download figure:
Standard image High-resolution imageWe further investigate the impact of different tropical ocean basins on the two types of precipitation. Figures 6(b), (e), (h) and (k) show the convective precipitation changes in each experiment, while figures 6(c), (f), (i) and (l) illustrate the large-scale rainfall. Changes in convective precipitation are very similar to those of the total precipitation, with slightly lower magnitudes. In contrast, the large-scale precipitation is negligible in this process. The total changes in tropical Amazonian rainfall can be largely attributed to the intensification of the local deep convection. It is thus important to further clarify the moisture convergence processes.
4. Moisture convergence
Previous research has shown that moisture flux convergence/divergence anomalies can be used to diagnose the precipitation surplus/deficit in the Amazon region (Satyamurty et al 2013). Here we examine the changes in moisture transport convergence/divergence over the tropical Amazon using both observation and numerical simulation results, in order to better clarify the mechanisms of the observed precipitation changes. We first calculate the climatological-mean moisture transport divergence during the wet season using ERA-interim data, with the results shown in figure 8(a). Positive values (red) indicate divergence and negative values (blue) signify convergence. A strong moisture convergent center appears over equatorial South America, associated with a deep convection center over the tropical Amazon. The low-and middle-level moisture convergence provides plenty of water vapor for the occurrence of strong convection. This is closely associated with convective precipitation during the wet season. We then illustrate the changes in the moisture transport divergence/convergence in figure 8(b). Positive values (red) indicate strengthened divergence, while negative values (blue) illustrate intensified convergence. The convergence center over the tropical Amazon is dramatically strengthened. Regions where convergence is intensified are consistent with areas where precipitation is increased, whose center is a sign of the heavy rain center.
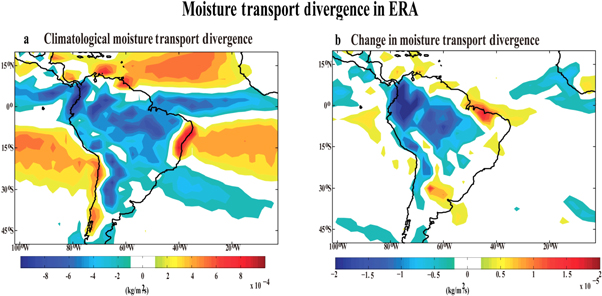
Figure 8. Climatological moisture transport divergence. (a) Climatology moisture transport divergence during the wet season for the period 1979–2015 in ERA-Interim. Positive values (red) indicate divergence and negative values (blue) signify convergence. (b) Moisture transport convergence changes for 1979–2015 in ERA-Interim. Red indicates enhanced divergence and blue indicates enhanced convergence.
Download figure:
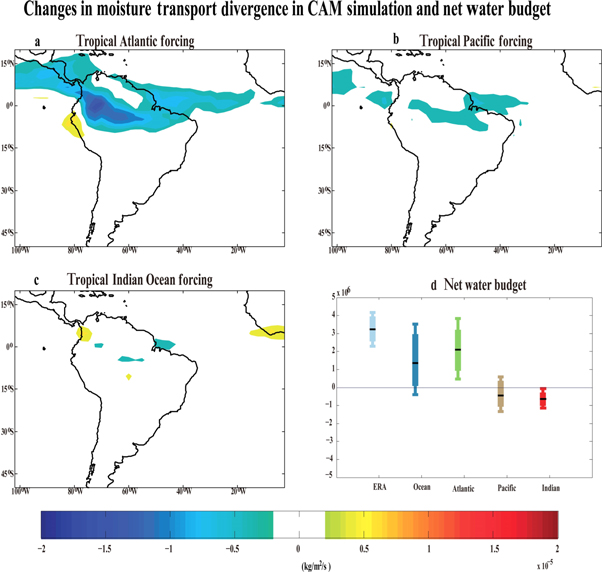
Standard image High-resolution imageWe then further investigate the change in moisture transport divergence driven by the SST changes in different ocean basins using CAM4 model simulations. The tropical Atlantic forcing triggers an intensified deep convection (figure 9(a)), which results in more/larger areas with increased precipitation. The change in moisture transport divergence driven by the Pacific is weaker than that of the Atlantic (figure 9(b)). For the tropical Indian Ocean forcing result (figure 9(c)), there are hardly any apparent signs. It is clearly shown that the tropical Atlantic forcing is of great importance for the increased precipitation over the equatorial Amazon. Figure 9(d) quantifies the spatial-mean water vapor budget in the tropical Amazon (8°S-5°N, 75°W-55°W) in the ERA-interim data and the CAM4 model. Tropical Atlantic forcing drives a strong moisture transport to the Amazonian region.
Figure 9. Changes in moisture transport in CAM simulation and the net water budget. Moisture transport convergence changes driven by the tropical Atlantic forcing (a), the tropical Pacific forcing (b), and the tropical Indian Ocean forcing (c), respectively. Blue indicates enhanced convergence and red indicates enhanced divergence. These results show that tropical Atlantic forcing intensified moisture transport convergence over the tropical Amazon. (d) The water budget in the equatorial Amazon (8°S-5°N, 75°W-55°W). The thick vertical bars show the 95% confidence intervals, and the error bars indicate 99% confidence intervals.
Download figure:
Standard image High-resolution image
5. Conclusion and discussion
In this study, we investigate the changes in the precipitation in the equatorial Amazon during the wet season over the period of 1979–2015. By combining the observational data including the GPCP, the CMAP and the CRU TS v3.24, as well as the reanalysis data including the ERA-Interim, the CFSR and the MERRA2, we reveal that the precipitation over the tropical Amazon is dramatically increased during the wet season. The spatially averaged DJFMAM precipitation over the equatorial Amazon (8°S-5°N, 75°W-55°W) has been increased by 180 mm–720 mm (according to different observational data) over the past three decades. These dramatic changes can be largely attributed to the SST forcing over the tropical Atlantic, and can be further related to the Atlantic multidecadal variability, revealed by the CAM4 model simulations. Also, the result of the perturbation experiment is nearly identical to the CAM4 simulations, which further emphasizes the robustness of our conclusions. Moisture transport convergence and its budget serve as key factors in changing the precipitation rate. The Atlantic warming intensified the moisture transport convergence over tropical South America, which forms deep convection and thus enhances the local rainfall. SST warming in the North Atlantic plays a crucial role in causing the observed decadal change in the western North Pacific tropical cyclone frequency (Zhang et al 2017). We must pay great attention to Atlantic SST warming. Our conclusion is partly based on the numerical simulations of a state-of-the-art atmospheric model. The results may depend on the reliability of this model. However, the strong similarity between different observations and the model results indicates the robustness of our conclusion.
The precipitation over the Amazon is critical for the global climate system. The rainforest provides plenty of water vapor, making an important contribution to the global water cycle. The intensified deep convection, shown in this study, may alter the Walker circulation over the Pacific and the Atlantic oceans, and thus influence the inter-basin teleconnection between these two ocean basins (Li et al 2016). The precipitation over the Amazon is also very important for global hydrology and the ecology system. As rainfall increases during the wet season, photosynthesis is weakened and the growth rate of rainforest plants may slow down. These processes affect the energy exchange and the carbon cycle. Beyond that, the precipitation changes could lead to habitat loss and may even result in species extinction. Moreover, torrential rain has caused flooding and landslides. Our results show that tropical SST changes, in particular the Atlantic warming, can influence the precipitation and deep convection over tropical South America during its wet season. The tropical SST-induced Amazonian deep convection may have a further impact on the large-scale atmospheric circulation over the global ocean, which requires further study.
Acknowledgments
This work was supported by the National Key R&D Program of China (2016YFC1401705). This research is also supported by the 'Belt and Road Climate Change and Observing' project of the Chinese Academy of Sciences. The observed and reanalysis datasets were downloaded from the International Pacific Research Center (IPRC)/Asia-Pacific Data-Research Center (APDRC) data portal (http://apdrc.soest.hawaii.edu/index.php). The reanalysis dataset (CFSR) was downloaded from the National Oceanic and Atmospheric Administration (https://www.ncdc.noaa.gov/data-access/model-data#cfsr).