

Abstract
The metallurgy, nonmetal products and chemical industry sectors (MN&C) are the three major industrial sources of air pollutants in China. Previous studies have focused on calculating emissions from MN&C via production-based accounting and identifying the drivers of MN&C using consumption-based accounting. However, these previous studies did not discuss how the total outputs from MN&C upstream and downstream industries influence air pollutant emissions. In this study, we use a pure backward linkage (PBL) method to quantify emissions from industries upstream of MN&C and to evaluate how the downstream industries drive the outputs of MN&C in China. We find that the emissions from industries upstream of MN&C are generally higher than the production-based emissions of MN&C. In particular, the chemical industry largely increased its contribution to air pollution according to the PBL method. Furthermore, much of upstream emissions of MN&C are embodied in the interregional trade, transferring substantial emissions from the eastern region to inland provinces. Regarding the drivers of MN&C, our results reveal that consumption-based accounting underestimates the importance of many sectors. The outputs of these previously underestimated sectors could maximally cover 80% of metallurgy, 85% of nonmetal products and 25% of chemical industry outputs. We suggest that improving the structure of MN&C would considerably help decrease the environmental burden on the entire supply chain. Additionally, improving the productivities of MN&C downstream industries could also address the air pollution caused by MN&C.
Export citation and abstract BibTeX RIS

Original content from this work may be used under the terms of the Creative Commons Attribution 3.0 licence.
Any further distribution of this work must maintain attribution to the author(s) and the title of the work, journal citation and DOI.
1. Introduction
Due to the surge in air pollutant emissions, China frequently suffers serious haze events, causing millions of premature mortalities every year (Tao et al 2012, Hu et al 2017, Tao et al 2015). These haze episodes are characterized by high concentrations of fine particulate matter (PM2.5), which are primarily derived from emissions of primary PM2.5 (Sun et al 2006) and chemical reactions of multiple precursors (such as sulfur dioxide (SO2) and nitrogen oxide (NOx)) (Huang et al 2014). Accounting for approximately 60% of total suspended particulate (TSP) emissions, 50% of SO2 emissions, and 30% of NOx emissions, industry (excluding the electricity sector) plays a critical role in the formation of PM2.5 pollution (National Bureau of Statistics of China 2013). Based on the direct emissions among all industry sectors, the metallurgy sector (MS), nonmetal products sector (NPS) and chemical industry sector (CIS) rank as the top three sources of air pollutants, aggregately generating 73% of TSP, 82% of SO2 and 81% of NOx (National Bureau of Statistics of China 2013). One primary reason for these substantial emissions is China's large capacities of metallurgy, nonmetal products and chemical industry sectors (MN&C). On a global scale, 50% of crude steel (World Steel Association 2013), 60% of cement (US Geological Survey 2015), and 30% of urea (Food and Agriculutre Organizaitons of the United Nations 2012) capacities are intensively distributed in China. To improve air quality, the Chinese government plans to greatly reduce the capacities of MN&C, including iron and steel products, cement products and glass products (State Council 2013). Furthermore, during poor meteorological conditions, MN&C factories are required to temporarily close to prevent degrading air quality (Ministry of Environmental Protection 2017).
Previous work primarily evaluated the contribution of the large capacities of MN&C to air pollution via production-based accounting, which calculates emissions within the production process (Wang et al 2016, Lei et al 2011). This method is the official method with which China compiles inventories and tracks progress toward emission-reduction goals, such as those established in China's 13th Five Year Plan (State Council 2016). However, the production-based accounting underestimates the role of MN&C in air pollutant emissions, failing to reflect their life cycle influence. The outputs of MN&C require intermediate inputs from upstream industry, thereby driving emissions through the entire supply chain. For example, the iron and steel-making process requires electricity, coke, coal, oil and natural gas and therefore causes pollutant emissions in upstream sectors such as coal-fired power plants and coke and petroleum refining plants (Yang et al 2018, Hu and Jiang 2001). By not including emissions from these upstream sectors, production-based accounting May largely underestimate the overall contribution of MN&C to air pollution (Skelton et al 2011).
Identifying the drivers of MN&C could also help reduce the capacities of MN&C from the sources of the supply chain. Previously, final demand was identified as the ultimate driver of the supply chain using consumption-based accounting (Meng et al 2015, Zhao et al 2015, Huo et al 2014). However, this accounting approach cannot fully illustrate the driving forces of the MN&C downstream industries (Liang et al 2017b, Liang et al 2017a). The production of MN&C is also driven by the total outputs of downstream industries (Clements and Rossi 1991). The outputs of downstream industries can then be used as intermediate inputs to manufacture other products or directly consumed by residents. From a consumption-based perspective, only the consumption portion of the total outputs is categorized as a driver (Lenzen and Murray 2010). Therefore, previous studies might have largely underestimated the contribution of the sectors whose outputs primarily serve as intermediate inputs rather than final demand.
To comprehensively understand the role of MN&C in the mitigation of air pollutants, the status of MN&C to air pollutant emissions must be reevaluated by investigating their upstream and downstream industries. Therefore, in this study, we had two goals. The first goal was to quantify the contribution of sectors upstream of MN&C to primary PM2.5, SO2 and NOx emissions. The second goal was to evaluate the driving forces of sectors downstream of MN&C. We used the concept of pure backward linkage (PBL) to trace upstream and downstream industries of MN&C. The 2012 multiregional input-output table (MRIO) of China was used to help quantify the contributions and drivers of MN&C sectors.
Table 1. Definitions for abbreviations.
| Abbreviations | Definitions |
|---|---|
| MS | Metallurgy sector |
| NPS | Nonmetal products sector |
| CIS | Chemical industry sector |
| MN&C | Metallurgy, nonmetal products and chemical industry sector |
| PBL | Pure backward linkage |
| CDF | Consumption-based driving force |
| Pure backward linkage-based driving force |
2. Materials and methods
2.1. Production-based accounting
To calculate the emissions from each sector, we followed the method in Lei et al (2010) and Liu et al (2010):

where i is the air pollutant type; j is the economic sector; k is either fuel or product type; m is the technology used for production; n is the removal devise; p is the province; and Ei,j,pproduction is the production-based emission of air pollutant i from sector j in province p. Aj,k,p is the activity rate of fuel or product k of sector j in province p; Xj,k,m,p is the share of fuel or production processed by a specific technology m of sector j in province p; Fi,j,k,m is the effective emission factor after adjustment by emission control devises; Fi,j,k,munabated represents the unabated emission factor. Ci,j,k,n represents the penetration control technology n for air pollutant i in sector j; and ηi,n represents the removal efficiency of control technology n for air pollutant i.
The values for the share of technology (Xj,k,m,p), the penetration of control technology (Ci,j,k,n) and the removal rate ηi,n were adopted from the Greenhouse Gas-Air Pollution Interactions and Synergies model (GAINS, http://gains.iiasa.ac.at/models/gains_models3.html) under the current legislation V5a scenario (Stohl et al 2015). The unabated emission factors (Fi,j,k,munabated) were compiled from the GAINS model and Lei et al (2010). We collected the activity rates of fuel and products from China Emission Accounts and Datasets (CEADs, www.ceads.net/data/energy-inventory/) and the China Industry Yearbook, respectively. The emissions for power and transportation sectors were compiled from the Multi-Resolution Emission Inventory for China (MEIC, www.meicmodel.org/).
The uncertainties of our estimation were originated from the emission factors, the activity levels, the share of technology, the penetration of control technology and the removal rates. The largest uncertainties were due to the wide range of emission factors from industry sectors, as the emissions varied greatly among different enterprises (State Environmental Protection Administration 1996). Another source of the uncertainties was the activity levels, reaching 15%–20% among industry sectors (Intergovernmental Panel on Climate Change 2006). Due to lack of data on the penetration of the control technology, we assumed the penetration rate following the current legislations and laws. Zhao et al (2011) quantified the uncertainties of these parameters, and found that the uncertainties of these production-based PM2.5, SO2 and NOx emissions (within 95% confidence intervals around the central estimates), respectively, varied between (−17%–54%), (−14%–13%) and (−13%–37%). Additionally, we compared our estimates with those from MEIC, PKU-FUEL (http://inventory.pku.edu.cn), 2012 Environmental Statistical Report (Ministry of Environmental Protection 2013) and the work of Wang et al (2014), and we found that our estimated emissions were comparable to these studies.
Table 2. Comparison of the production-based emissions (excluding residential emissions) with previous works. The PM2.5 emissions of the Environmental Statistical Report were derived by multiplying the TSP emissions by the factors of PM2.5/TSP, which we calculated from the PKU-FUEL and MEIC inventories, respectively.
| This work | MEIC | PKU | Statistical report | Wang et al 2014 | |
|---|---|---|---|---|---|
| PM2.5 (Tg) | 5.76 | 7.50 | 7.80 | 2.84–4.37 | 6.48 |
| SO2 (Tg) | 21.5 | 25.8 | 32.8 | 19.1 | 21.6 |
| NOx (Tg) | 28.0 | 28.3 | 24.1 | 23.0 | 24.3 |
2.2. Consumption-based accounting and consumption-based driving force
The 2012 MRIO database (Mi et al 2017) was used to calculate the portions of MN&C outputs were driven by consumption behaviors. From the MRIO table, we derived the following equations to estimate the driving force of a sector (Meng et al 2016):


where L is the Leontif inverse representing the total (direct and indirect) input coefficient; I is the identity matrix; A is the direct input coefficient matrix; Cj'jp'p is the output of sector j in province p driven by sector j' in province j; Ljp is the row vector of sector j in province p; Yj'p' is a vector representing the final demand of sector j' in province p', while the values for the final demand of the other sectors are set to zero; CDFj'jp'p, defined as consumption-based driving force, measures the contribution of sector j' in province p' to the output of sector j in province p using consumption-based accounting (figure 1); and xjp is the output of sector j in province p.
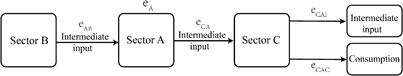
Figure 1. The framework of the production-based method, PBL method and output-based method and the consumption-based driving force and PBL-based driving force. eA is the production-based emissions from sector A, eAB is the emissions from sector B caused by the outputs of sector A (i.e. sector A PBL emissions), eCA is the emissions from sector A driven by sector C, eCAI is the portion of eCAI used for intermediate input, and eCAC is the portion of eCA used for consumption. The CDF of sector C to sector A is defined as eCAC/eCA, and the corresponding PDF is defined as eCA/eA.
Download figure:
Standard image High-resolution image2.3. PBL accounting and PBL-based driving force
To calculate the pollutant emissions from the upstream sectors of a given sector, we adopted the PBL method introduced by Sonis et al (2010). PBL initially quantifies the output (excluding the output from sector j) that is induced by sector j and can then be extended to calculate the emissions of upstream sectors induced by sector j using the following equations (Skelton et al 2011):


where we define Ei,j,pPBL as PBL emissions of pollutant i from sector j in province p; Ajp is the column vector of all intermediate purchases made by sector j in province p; Ajp' is the matrix of intermediate purchases, with purchases by and from j set to zero; hi is the intensity vector of direct emissions of air pollutant i per unit output, and its element hi,j,p is the intensity of direct emissions of air pollutant i per unit output from sector j in province p; and hi,j,p⁎ is the intensity vector of direct emissions of air pollutant i per unit output, with the emissions intensity for sector j in province p set to zero.
We then used PBL to calculate the share of the output from sector j in province p driven by sector j' in province p'.

where PBLj'jp'p is the output of sector j in province p driven by sector j' in province p' and PDFj'jp'p is defined as a pure backward linkage-based driving force, representing the share of the output from sector j in province p driven by sector j' in province p' according to the PBL method.
2.4. Output-based accounting
To combine the emissions from sector j and its upstream sectors, we define the term output-based accounting, which represents the emissions from all sectors that are embodied in the total output xj of sector j. As shown in figure 1, the output-based accounting consists of two components: (a) the emissions from all sectors, excluding sector j, that are embodied in the total output of sector j and (b) emissions from the production of sector j. The output-based accounting Ei,j,pOutput can then be calculated with the following equation:
3. Results
3.1. PBL and output-based emissions of MN&C
Figure 2 shows that the output-based emissions of MN&C were significantly higher than the production-based emissions due to high PBL emissions. The importance of CISs in emission mitigation increased greatly when considering emissions from upstream sectors. On average, the CIS output-based primary PM2.5, SO2 and NOx emissions in 30 provinces were higher than their provincial production-based emissions by a factor of 7.7. 3.5 and 6.2, respectively. Additionally, PBL identified the CIS in Shandong as a large source of emissions, whereas according to the production-based accounting, the CIS in Hubei was the largest emitter of air pollutant emissions. After the addition of emissions from upstream sectors, output-based air pollutant emissions from the CIS in Shandong were 111.5 Gg primary PM2.5, 665.0 Gg SO2 and 694.5 Gg NOx, which were twice the output-based emissions in Hubei.
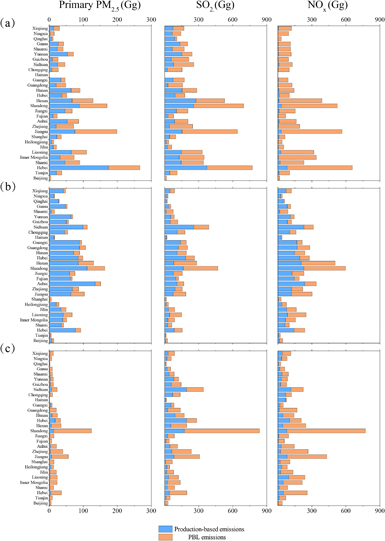
Figure 2. The PBL emissions and production-based emissions of primary PM2.5, SO2 and NOx from the (a) MSs, (b) NPSs and (c) CISs in 30 provinces. Blue bars represent the production-based emission, and orange bars represent the PBL emission. Plots in the left (middle, right) column represent the production-based and PBL emissions of primary PM2.5 (SO2, NOx).
Download figure:
Standard image High-resolution imageMSs were major emitters of primary PM2.5 and SO2 emissions and indirectly induced substantial quantities of emissions in their upstream sectors. For example, PBL primary PM2.5 and SO2 emissions from the MS in Jiangsu (i.e. 130.2 Gg PM2.5 and 491.6 Gg SO2) almost reached the production-based emissions of the Hebei MS, which was the largest production-based emitter. Furthermore, MSs were not major sources of NOx emissions, but indirectly caused large quantities of NOx emissions in their upstream sectors. The PBL NOx emissions of MSs in 30 provinces were 6 to 237-fold greater than their provincial production-based emissions.
NPSs were an important sources of direct primary PM2.5, SO2 and NOx, and PBL emissions further increased the contribution of NPSs to SO2 and NOx emissions. For most provinces, output-based emissions doubled the production-based SO2 and NOx emissions. Using this output-based accounting, the NPS in Shandong became the largest source of primary PM2.5, SO2 and NOx emissions, which was not the case when using the production-based accounting.
Figure 3 shows the upstream sectors from which the PBL emissions were emitted. For MN&C, a common pattern was that PBL emissions were primarily originated from coal mining and power sectors. In detail, power sectors contributed more than 20% of the PBL primary PM2.5 emissions and nearly half of the PBL SO2 and NOx emissions. Coal mining sectors were particularly critical for PBL emissions from CISs, covering 27%, 43% and 24% of PBL primary PM2.5, SO2 and NOx emissions, respectively. Additionally, transport sectors were a major source of PBL NOx emissions and accounted for approximately 20% of NOx emissions from MN&C. Figure 3 also indicates that much of PBL emissions were embodied in the interregional trade. For example, MSs from other provinces covered approximately 20% and 15% of the local MS PBL primary PM2.5 and SO2 emissions, respectively. These findings indicate that the same amounts of emissions were embodied in the interregional trade of metallurgy outputs since local metallurgy emissions were not counted in the provincial PBL emissions. Similarly, we found that 20% of the PBL primary PM2.5 emissions from NPSs were embodied in the interregional trade. To further explore the role of trade in upstream emissions, we traced the interregional flows of the PBL emissions in the next section.

Figure 3. The contribution of upstream sectors to the PBL emissions of MN&C. The proportion of a sector in each subfigure is the average of its sectoral contributions to PBL emissions (emissions from the upstream sector/total PBL emissions) in 30 provinces. The figure only shows the upstream sectors that accounted for 5% or more of the PBL emissions. The left (middle, right) column shows the sources of PBL primary PM2.5 (SO2, NOx).
Download figure:
Standard image High-resolution image3.2. Emissions embodied in trade driven by the MN&C outputs
Figure 4 shows that economically developed regions (eastern coastal provinces) commonly tend to import products embodying primary PM2.5 emissions from less developed provinces (detailed information on the geographical locations and economic conditions of the 30 provinces is given in figure S1 available at stacks.iop.org/ERL/13/084013/mmedia in the supporting information). Over 75% of the total PBL emissions in the MSs of Jiangsu, Zhejiang, Guangdong, Chongqing and Beijing were originated from other inland provinces (figure 4(a)). For NPSs, the pattern was similar to MSs. More than 50% of the PBL primary emissions in eastern provinces (e.g. Jiangsu, Zhejiang and Guangzhou) and megacities (Beijing, Tianjin, Shanghai and Chongqing) were not sourced locally. Figure 4(c) shows that the PBL emissions from CISs were not heavily influenced by interregional trade compared to the PBL emissions from MSs and NPSs, generating over half of the PBL emissions locally in most provinces (except in Jiangsu, Beijing, Shaanxi and Hainan).
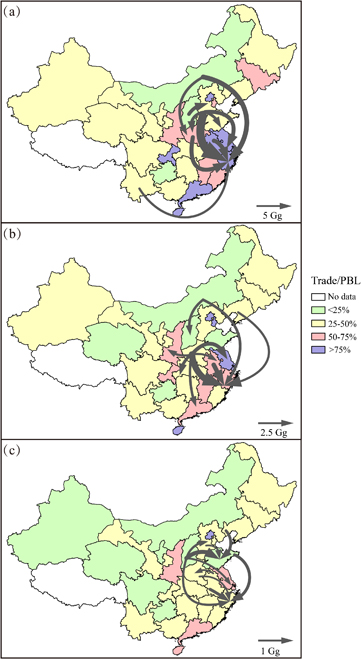
Figure 4. Key trade fluxes of primary PM2.5 (Gg) in mainland China caused by the outputs of (a) MS, (b) NPS and (c) CIS. Arrows depict the 10 largest interregional flows of primary PM2.5 emissions from the province that exported intermediate inputs to the province that imported these intermediate inputs. The colors of each province indicate the proportion of PBL emissions that were embodied in interregional trade.
Download figure:
Standard image High-resolution imageFigure 4(a) also reveals that the MS outputs drove high primary PM2.5 emissions embodied in trade. Large trade flows of primary PM2.5 emissions were primarily sourced from Hebei. In Hebei, more than 7 Gg of primary PM2.5 emissions were embodied in the exported outputs to the MSs in each of Jiangsu, Zhejiang, Shandong and Henan province. Inner Mongolia was another important source of the traded PM2.5 emissions, exporting outputs embodying over 13 Gg and 7 Gg of primary PM2.5 emissions to Hebei and Jiangsu, respectively. The major driver of these large primary PM2.5 trade flows was the MS in Jiangsu, causing large PM2.5 emissions in Hebei, Henan, Anhui, Inner Mongolia and Yunnan. Collectively, the output of the MS in Jiangsu caused 99.6 Gg PM2.5 emissions in the rest provinces, of which 34.4 Gg (34.5%) was emitted in Hebei and Inner Mongolia.
In the trade flows induced by the outputs of NPSs, the dominant source of the traded primary PM2.5 emissions was Henan (figure 4(b)). The NPS outputs in Jiangsu, Zhejiang, Anhui, Hunan, Shaanxi and Guangdong each stimulated more than 3 Gg primary PM2.5 emissions in Henan. The NPS in Jiangsu was the primary destination of the traded primary PM2.5 emissions, causing 42.9 Gg primary PM2.5 emissions in other provinces. The trade flow from Henan to Jiangsu involved the largest 16.6 Gg primary PM2.5 emissions. Additionally, Anhui exported intermediate inputs embodying 6.0 Gg primary PM2.5 emissions to the MS in Jiangsu.
We found that the outputs of CISs generally induced less traded primary PM2.5 emissions than those of MSs and NPSs (figure 4(c)). The largest trade flow embodied only approximately 3 Gg primary PM2.5. The major source of primary PM2.5 emissions embodied in trade was Shanxi. For example, CISs in Hebei, Shandong, Zhejiang and Jiangsu were collectively responsible for approximately 8 Gg of primary PM2.5 emissions in Shanxi. Unlike the case in figures 4(a) and (b), there were two major destinations of the traded primary PM2.5 emissions. The CIS in Jiangsu aggregately drove 24.7 Gg primary PM2.5 emissions, and the CIS in Shandong drove 18.8 Gg of primary PM2.5 emissions in other provinces.
The trade flows of SO2 and NOx are shown in the supporting information (figures S2 and S3), and both show a pattern similar to that of primary PM2.5.
3.3. Comparing the PDF and CDF of the MN&C downstream industries
Figure 5 compares the PDF and CDF of MN&C downstream industries. For many industrial sectors, the CDF was nearly zero, but these sectors had high values of PDF. This difference occurred because outputs from industrial sectors were primarily used as intermediate inputs.
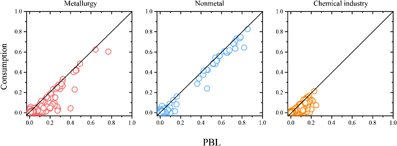
Figure 5. The PDF and CDF of MN&C in 30 provinces. The horizontal axis represents the PDF, and the vertical axis represents the CDF.
Download figure:
Standard image High-resolution imageFor downstream sectors of MSs, the PDF was generally higher than the CDF. The 99th percentile value was 0.03 for the PDF, twice the 99th percentile of the CDF (0.014). Furthermore, PDF maximally increased to 0.8, while CDF reached only 0.6 at the maximum. According to the consumption-based accounting, local construction sectors were the largest drivers to the MS in each province (table S1). However, using the PBL method, we identified several new driving sectors in addition to construction sectors. In detail, the PDF of general machinery sectors, transport equipment sectors and electrical equipment sectors reached maxima of 0.44, 0.40 and 0.27, respectively (table S1). However, the CDF of these sectors was less than 0.1.
Construction sectors contributed greatly to the outputs from NPSs whether evaluating by PDF or CDF. As shown in figure 3, the highest values of PDF and CDF in the 30 provinces were 0.85 and 0.84, respectively. For most provinces, the total outputs and consumption of construction sectors exerted approximately the same influence on NPSs (table S2). One exception was Jiangsu, where the PDF of construction sectors was 0.46, but the CDF only reached 0.24.
Downstream sectors of CISs had lower PDF and CDF values than those of MSs and NPSs because the highest values of PDF and CDF nearly reached 0.25 and 0.20, respectively. Construction sectors and other services sectors were recognized as major drivers to CISs according to CDF (table S3). However, PBL identified diverse drivers to CISs, including the MSs, agriculture, electronic equipment, textile, clothing and food processing sectors, which were mostly ignored by consumption-based accounting. In particular, the total output of agriculture sectors was the largest driver to the CISs in 5 provinces. For example, the CDF of the Shaanxi agriculture sector was 0.07, but the PDF was 0.25.
Figure 6(a) shows that MSs in Hebei, Jiangsu and Shandong had diversified major PBL-based drivers, including electrical equipment, construction, metal products and general machinery sectors. The PDF of these sectors all had a value greater than 0.1. In further detail, the output of the Hebei construction sector drove 20% of the local MS output, the output of the Jiangsu electrical equipment sector drove 27% of the local MS output, and the Shandong general machinery sector drove 44% of the local MS output. Additionally, other provinces strongly drove the MS output in Hebei (e.g. Jiangsu and Zhejiang). Specifically, outputs of the MSs in Jiangsu and Zhejiang contributed 7.7% and 4.1% of the Hebei MS outputs, respectively.

Figure 6. The sectors with top ten PDF to (a) MS, (b) NPS and (c) CIS in the selected three provinces, which had the largest production-based emissions of MS. In each subfigure, if the sector is not located locally, the province of that sector is given.
Download figure:
Standard image High-resolution image
Anhui, Henan and Shandong were the three provinces that emitted large output-based air pollutant emissions from the NPSs, and the outputs of local construction sectors were the dominant drivers of these emissions (figure 6(b)). In Anhui, Henan and Shandong, the PDF of local construction sectors was approximately 0.4. Construction activities in Jiangsu, Zhejiang and Shanghai also largely drove the NPSs in Anhui and Henan. For example, the PDF values of construction sectors from Jiangsu, Zhejiang and Shanghai to the NPS in Anhui were 0.16, 0.03 and 0.02, respectively.
Hubei, Jiangsu and Shandong were important output-based air pollutant emitters of CISs (figure 6(c)). In contrast to MSs and NPSs, CISs did not have a dominant driver that outweighed any other sector. Several different sectors aggregately drove the production of CISs in these three provinces. The outputs of food processing, transportation equipment, electronic equipment and agriculture sectors all accounted for approximately 10% of local CIS outputs.
3.4. Uncertainties
The parameters affecting the uncertainties of PBL emissions are the intensity vector of air pollutants h and the direct input coefficient matrix A. The parameters affecting the consumption-based outputs were the final demand Y and the direct input coefficient matrix A. The output of each sector was directly derived from the statistical data, and thus we assume their values are robust. Based on equations (4) and (7), we find that the consumption-based outputs varied linearly with the final demand, so did the PBL emissions with the intensity vector. This linear relationship indicates that 1% percent change of the final demand or the intensity vector would result in 1% change of the consumption-based outputs or PBL emissions.
Tables S4–S12 in the supporting information show the sensitivities of PBL emissions to the direct input coefficient matrix. We uniformly changed all elements in the coefficient matrix, and investigate the overall effects on PBL emissions. A non-linear relationship is observed between the PBL emissions and the coefficient matrix. If the coefficient matrix increases or decreases by 5%, the PBL emissions would correspondingly increase or decrease by 10%–15%. We also did sensitivity tests of the coefficient matrix to the consumption-based outputs in tables S13–15, and found similar results for the PBL-based emissions.
Furthermore, we did a Monte Carlo analysis with 10 000 simulations to quantify the uncertainties of the PBL emissions. Based on the method in Lin et al (2014), we assumed that relative errors of all parameters followed the normal distribution. Details on parameters' setting are given in table S16, and the results of Monte Carlo simulations for the 30 provinces are shown in tables S17–19. We have also done Monte Carlo simulations for the consumption-based outputs of the 30 provinces, and the results can be seen in table S20. Generally, a factor of −30%–35% uncertainties are implicated from these Monte Carlo simulations.
4. Discussion
In the supply chain, air pollutant emissions from a sector are closely linked to both upstream and downstream sectors, as the emissions from the upstream are ultimately driven by the demands of downstream. To efficiently mitigate emissions, it needs to quantify the emissions from the upstream and evaluating the driving forces from the downstream. Then policy makers could identify more undiscovered sectors requiring significant emission mitigation. To reach a supply chain mitigation, policy makers could regulate downstream sectors with powerful driving forces on upstream emissions, since a policy targeted at a downstream industry could effectively reduce the emissions from all upstream sectors. However, current targets of many polices are twisted without distinguishing upstream or downstream sectors, which May lead to overlapped or inefficient regulation measures. In this study, we used a PBL method to measure how the upstream and the downstream sectors influence the air pollutant emissions from MN&C. We firstly quantified the emissions emitted from the upstream sectors of MN&C and compared these upstream emissions with the production-based emissions directly emitted by MN&C. We then traced the source-receptor flows of the upstream emissions, and identified the locations of the drivers and emitters. Finally, we calculated the driving forces of the downstream sectors to MN&C, and recognized the sectors with largest driving forces.
Our findings show that large quantities of primary PM2.5, SO2 and NOx emissions are emitted in the upstream industries of MN&C. Particularly, we find that the upstream emissions of CIS are 3–7 times of the direct or production-based emissions by MN&C. In addition, substantial PBL emissions are emitted in inland provinces (e.g. Hebei, Henan and Shanxi), but are mainly driven by the MN&C industry in Jiangsu and Shandong. We also find that the PBL method is able to identify several drivers of MN&C which are invisible to consumption-based accounting. The driving forces of a few manufacture sectors, including general machinery, electrical equipment, metal products and food processing, are largely underestimated by the traditional consumption-based accounting. Our results reveal that up to 85% of the MN&C outputs in a specific province could be driven by only one downstream sector.
Our results suggest that policies targeting only on end-of-pipe mitigation of MN&C emissions May miss substantial opportunities for deeper mitigation in the upstream sectors. This underscores the importance of technology improvement in MN&C, so less inputs from upstream sectors (e.g. coal mining sectors, power sectors and transportation sectors) are required. For example, technology that recycles residual heat and pressure to generate electricity could save large amount of energy input. Therefore, policies encouraging technology innovation in MN&C or providing financial support to MN&C to adopt advanced devises are desirable. If the outdated capacities were completely phased out, both production-based emissions and the upstream emissions could be greatly reduced. For example, a small size blast furnace less than 500 m3 consumes even 40% more energy than that of an advanced blast furnace larger than 1000 m3 (Hu and Jiang 2001).
The PBL emissions embodied in the interregional trade serve as a major motivation for the close cooperation between provinces on air pollution control. The MN&C in economically developed provinces could transfer advanced technologies or funding to their upstream sectors in inland provinces. Currently, the cooperation merely focus on adjacent provinces based on the physical transport of air pollution, e.g. the Jing-Jin-Ji region (Beijing, Tianjin and Hebei) or the Yangtze River Delta (Jiangsu, Shanghai and Zhejiang), but the interregional trade pattern of the PBL emissions implies that the cross-boundary cooperation should include provinces or regions that are distantly separated. For example, Hebei, Henan, Inner Mongolia, Liaoning, Shanxi and Yunnan Provinces should strengthen their cooperation with the Yangtze River Delta to improve local air quality. In addition, Guangdong Province could share technology and funding with Henan, and Shanxi should collaborate closely with Shandong.
The MN&C downstream drivers represent untapped opportunities for reducing supply chain-wide environmental pressures. Using less inputs from MN&C to produce the same amount of outputs can significantly contribute to the reduction of output-based emissions from MN&C. The improvement of productivity in manufacture sectors are required for less inputs from MS. Additionally, more research should focus on developing substitutes of metallurgy products. Construction sectors should recycle materials and reduce material waste during production upstream emissions to avoid output-based emissions from NPS. Services, textiles, agriculture and food sectors should be encouraged to use alternative inputs instead of chemical products from CIS. For example, human urine could be reused as fertilizers to reduce the production of mineral fertilizers. With these efforts, we believe air pollution emissions from the whole supply-chain of MN&C and the relevant adverse health and environmental impact will be greatly reduced.
Acknowledgments
This work was supported by funding from the National Natural Science Foundation of China (under award nos. 41571130010, 41671491, 41390240); the National Key Research and Development Program of China (2016YFC0206202); and the 111 Project (B14001).