

Abstract
Certain coastal ecosystems such as mangrove, saltmarsh and seagrass habitats have been identified as significant natural carbon sinks, through the sequestration and storage of carbon in their biomass and sediments, collectively known as 'blue carbon' ecosystems. These ecosystems can often thrive in extreme environments where terrestrial systems otherwise survive at the limit of their existence, such as in arid and desert regions of the globe. To further our understanding of the capability of blue carbon ecosystems to sequester and store carbon in such extreme climates, we measured carbon sediment stocks in 25 sites along the Western Arabian Gulf coast. While seagrass meadows and saltmarsh habitats were widely distributed along the coast, mangrove stands were much reduced as a result of anthropogenic pressures, with 90% of stands having been lost over the last century. Carbon stocks in 1 m deep surface sediments were similar across all three blue carbon habitats, with comparable stocks for saltmarsh (81 ± 22 Mg Corg ha−1), seagrass (76 ± 20 Mg Corg ha−1) and mangroves (76 ± 23 Mg Corg ha−1). We recorded a 38% decrease in carbon stocks between mature established mangrove stands (91 Mg Corg ha−1) and recently planted mangroves (56 Mg Corg ha−1). Mangroves also had the lowest carbon stock per total area owing to their very limited spatial coverage along the coast. The largest stock per total area belonged to seagrass beds as a result of their large spatial coverage within the Gulf. We employed 210Pb dating to determine the sediment accretion rates in each ecosystem and found mangrove habitats to be the most efficient carbon sequesters over the past century, with the highest carbon burial rate of the three ecosystems (19 g Corg m−2 yr−1), followed by seagrass (9 g Corg m−2 yr−1) and saltmarshes (8 g Corg m−2 yr−1). In this work, we describe a comprehensive comparison of sediment stocks in different blue carbon ecosystems within a single marine environment and across a large geographical area, and discuss our results in a global context for other blue carbon ecosystems in the dry tropics.
Export citation and abstract BibTeX RIS

Original content from this work may be used under the terms of the Creative Commons Attribution 3.0 licence.
Any further distribution of this work must maintain attribution to the author(s) and the title of the work, journal citation and DOI.
1. Introduction
Vegetated coastal habitats, including mangroves, seagrass meadows and saltmarshes, can sequester and store significant amounts of organic carbon (Duarte et al 2005, Fourqurean et al 2012). This has prompted increased interest in the potential role of these ecosystems in supporting climate change and adaptation policies, through so-called blue carbon strategies (Nellemann et al 2009, Mcleod et al 2011, Duarte et al 2013). However, studies on carbon sequestration in blue carbon habitats to-date have been disproportionately focused on sites in temperate or tropical climates (Chmura et al 2003, Donato et al 2011, Adame et al 2013, Fourqurean et al 2012, Brown et al 2016, Serrano et al 2016, Macreadie et al 2017). Similar studies in arid regions of the world are relatively scarce, where temperature extremes and low rainfall may affect net ecosystem productivity and primary productivity. Recent studies in arid regions such as those adjoining the Red Sea report some of the lowest short-term carbon sequestration rates (15 g Corg m−2 yr−1) and sediment stocks (43 Mg Corg ha−1 in 1 m-thick soils) in mangrove forests (Almahasheer et al 2017), while (Schile et al 2017) also reported modest carbon stocks in blue carbon ecosystems (49–156 Mg Corg ha−1) within the Arabian Gulf coast of the United Arab Emirates. The distribution of organic carbon in mangrove forests of the Egyptian Red Sea coastline has been described by (Madkour et al 2014), who found moderate levels of organic carbon (190 Mg Corg ha−1) in mangrove sediments. However, studies and data on carbon stocks and sequestration rates for blue carbon ecosystems in the arid Middle East region remain critically low.
The Saudi Arabian coasts of the Arabian Gulf and the Red Sea comprise highly productive vegetated coastal ecosystems. Saltmarshes form vast ecosystems of halophytes known locally as sabkha (Qurban et al 2011). All of these ecosystems are at risk or in decline due to local pressures such as industrial activities and land reclamation for coastal development (Loughland et al 2012), which has resulted in the loss of around 90% of the mangrove cover (Loughland et al 2012) and unknown, but large, spans of sabkha, and possibly seagrass meadows. Almahasheer (2018) recently determined the spatial coverage of mangrove stands in the Arabian Gulf and found that mangrove coverage in Saudi Arabia, Qatar and Bahrain is stable, while stands in Iran have been in decline over recent years. The Middle East and the Gulf of Arabia basin is expected to be especially vulnerable to the negative impacts of climate change, and it is predicted that by the end of this century certain population centres in the region are likely to experience extreme temperatures, owing to the consequences of increasing concentrations of anthropogenic greenhouse gases (Pal and Eltahir 2016).
Here we present a comprehensive analysis on carbon stocks and Corg accumulation rates for mangrove, saltmarsh and seagrass habitats along the Western Gulf coast. This study will contribute important information from a climatically extreme region of the globe, which is underrepresented in the literature, thereby contributing to a more balanced account of global patterns in carbon sequestration and stocks in blue carbon habitats. In literature, the Arabian Gulf and the Persian Gulf are interchangeable, however for this study we refer to the study area as the Arabian Gulf.
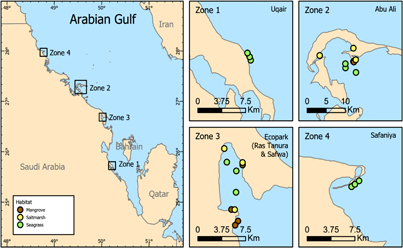
Figure 1. Map of sampling sites: Zone 1) three seagrass sites at Uqair, Zone 2) three seagrass, three mangrove and three saltmarsh sites at Abu-Ali Island, Zone 3) three seagrass, four mangrove and three saltmarsh sites at Ras Tanura/Safwa and Zone 4) three seagrass sites at Safaniya.
Download figure:
Standard image High-resolution image2. Methods
2.1. Study region
2.1.1. Blue carbon habitats along the western Arabian Gulf coastline
The Kingdom of Saudi Arabia has approximately 560 km of coastline in the Arabian Gulf, which covers an area of 226 000 km2 and stretches almost 1000 km in length along its central axis (Sheppard et al 2010). The Gulf is a shallow, semi-enclosed sea with an average depth of 35–40 m, with the only opening to the Indian Ocean (Gulf of Oman) via the relatively narrow Strait of Hormuz (50 km). A number of factors such as limited circulation, extreme summer air temperature (>50 °C) and shallow depth result in high evaporation, hypersalinity, and low water exchange with the open ocean (Kazemi et al 2012, Fard et al 2015). Due to the geographic location of the Gulf, surrounded by a largely arid region, there is little freshwater input from land to the Saudi coast and virtually no water borne sediment reaches the Gulf from the surrounding land mass. Thus, sediments of the Gulf originate mainly from carbonate deposits from sea water and deposited airborne sediment of terrestrial origin, which comprise one third of Gulf sediments Sugden (1963), and sediments delivered by the Tigris and Euphrates rivers in the north and transported to the Saudi coast. The Gulf suffers particularly high anthropogenic pressure owing to the large reserves of crude oil, which represent 57%–66% of the world's oil reserves (Vaezi et al 2015), and thus the presence of a large number of related industries and associated discharges. The industrial development of the region, along with high population growth driven by the large employment created by these industries, has led to significant coastal development, rapidly transforming previously pristine coastal environments through urbanisation, land reclamation and dredging (Lokier and Fiorini 2016). The consequent industrial and sewage effluents, wastewater discharges from desalination plants, shipping and oil tanker traffic and emissions from oil production have all contributed to negatively impact the Gulf environment (Sheppard et al 2010, Naser 2014, Loughland et al 2012).
Almahasheer (2018) estimated that around 165 km2 fragmented mangrove stands are distributed unevenly around Arabian Gulf coastlines. Mangrove ecosystems along the Gulf coast of Saudi Arabia are limited in their distribution, existing mostly in sheltered areas along the coast (Saenger 2011). Mangrove development in the Gulf is restricted largely due to natural environmental pressure, such as aridity, high salinity and seasonal temperature fluctuations from cold to extreme heat. Mangroves on the west coast are represented by a single species, Avicennia marina, which is adapted to withstand the local extreme environmental conditions. On the Iranian coast, a mixture of Avicennia marina and Rhizophora mucronata can be found (Zahed et al 2010). Anthropogenic pressures, such as land reclamation and coastal development, have led to the loss of an estimated 90% of the original mangrove ecosystems along the Saudi coast, with much of the remaining mangrove area likely to be lost within a decade at current lost rates (Loughland et al 2012), except for areas under protection.
Supratidal flats occupy 30%–40% of the Saudi coastline (Basson et al 1977), and mainly consist of mud or very fine sand in sheltered areas where wave energy is limited. Saltmarshes, or sabkhas, of the Saudi Gulf coastline have been surveyed by Al-Abdulkader and Loughland (2012), and were found to be dominated by salt tolerant or halophytic perennial grasses such as Aleuropus lagopoides and Bienertia cycloptera. Seagrass beds, including three species: Halodule uninervis (most widely distributed), Halophila stipulacea and Halophila ovalis (less common) (Price and Coles 1992), occur at 46% of the coastal and 30% of offshore sites of the Gulf coast (Erftemeijer and Shuail 2012). Seagrass meadows in the region are under local environmental pressure due to dredging, land reclamation and associated changes in hydrology, together with pressures derived from climate change and marine pollution.
This study focuses on vegetated coastal habitats along the Gulf coast of Saudi Arabia, spanning 400 km of the coastline, extending from 25° 43' N (Uqair) on the southwest coast to 27° 58' N (Safaniya) on the northwest coast (table 1, figure 1). Sediment core samples were taken in replicate at 25 locations: 12 seagrass habitats, seven mangrove and six saltmarsh habitats (table 1). The mangroves sampled included both recently planted mangroves in Abu-Ali, from a successful replanting project undertaken in the early 1990s, and natural mangrove forests in the protected areas of Ecopark and Safwa (table 1).
Table 1. Summary of sediment parameters per core, mass accumulation rate (MAR) and sediment accretion rate (SAR) ± uncertainty, estimated using 210Pb dating over the past decades to century. Corg (%), dry bulk density (DBD) are means ± SE, stocks extrapolated to surface 1 m depth (± SE).
| Region | Habitat | Core ID | Latitude (°N) | Longitude (°E) | Sediment depth (cm) | Mean Corg content (%) | DBD (g cm3) | Stock (Mg Corg ha−1) | MAR (g cm−2 yr−1) | SAR (mm yr−1) | Corg burial rate (g Corg m−2 yr−1) |
|---|---|---|---|---|---|---|---|---|---|---|---|
| Safaniya | Seagrass | SSGC1 | 27.97364 | 48.77404 | 109 | 0.54 ± 0.03 | 1.3 ± 0.03 | 74 ± 4 | 0.34 ± 0.04 | 2.4 ± 0.3 | 19 ± 2 |
| Safaniya | Seagrass | SSGC2 | 27.97679 | 48.77877 | 90 | 0.56 ± 0.01 | 1.3 ± 0.02 | 73 ± 2 | n/a | n/a | n/a |
| Safaniya | Seagrass | SSGC3 | 27.98142 | 48.78462 | 110 | 0.50 ± 0.04 | 1.1 ± 0.02 | 62 ± 4 | 0.23 ± 0.03 | 1.7 ± 0.2 | 9.0 ± 1.4 |
| Abu-Ali | Mangrove | AAMGC1 | 27.28603 | 49.56685 | 102 | 0.36 ± 0.02 | 1.4 ± 0.02 | 55 ± 3 | 0.25 ± 0.02 | 1.59 ± 0.10 | 8.7 ± 0.8 |
| Abu-Ali | Mangrove | AAMGC2 | 27.28384 | 49.56403 | 103 | 0.39 ± 0.02 | 1.3 ± 0.03 | 51 ± 3 | 0.176 ± 0.013 | 1.24 ± 0.09 | 6.2 ± 0.6 |
| Abu-Ali | Mangrove | AAMGC3 | 27.28283 | 49.56523 | 103 | 0.46 ± 0.05 | 1.4 ± 0.02 | 63 ± 2 | 0.37 ± 0.02 | 2.6 ± 0.2 | 23 ± 3 |
| Abu-Ali | Saltmarsh | AASMC1 | 27.28777 | 49.56953 | 103 | 0.53 ± 0.07 | 1.4 ± 0.04 | 77 ± 4 | 0.178 ± 0.008 | 1.28 ± 0.06 | 9.4 ± 0.8 |
| Abu-Ali | Saltmarsh | AASMC2 | 27.31332 | 49.56401 | 72 | 0.73 ± 0.07 | 1.0 ± 0.05 | 75 ± 5 | 0.102 ± 0.007 | 0.96 ± 0.07 | 6.0 ± 0.6 |
| Abu-Ali | Saltmarsh | AASMC3 | 27.29719 | 49.48471 | 67 | 0.54 ± 0.08 | 1.5 ± 0.06 | 68 ± 4 | 0.123 ± 0.012 | 0.87 ± 0.09 | 5.1 ± 0.6 |
| Abu-Ali | Seagrass | AASGC1 | 27.26978 | 49.54546 | 35 | 0.76 ± 0.01 | 1.3 ± 0.01 | 95 ± 1.4 | 0.21 ± 0.06 | 1.6 ± 0.5 | 16 ± 4 |
| Abu-Ali | Seagrass | AASGC2 | 27.25976 | 49.57006 | 118 | 0.98 ± 0.12 | 0.9 ± 0.02 | 83 ± 4 | 0.09 ± 0.02 | 0.9 ± 0.2 | 4.9 ± 1.2 |
| Abu-Ali | Seagrass | AASGC3 | 27.27886 | 49.54524 | 116 | 1.12 ± 0.04 | 1.2 ± 0.02 | 127 ± 1.3 | n/a | n/a | n/a |
| Ecopark | Mangrove | RTMGC1 | 26.71674 | 50.02111 | 54 | 0.82 ± 0.07 | 1.2 ± 0.02 | 99 ± 4 | 0.50 ± 0.05 | 3.60 ± 0.40 | 38 ± 4 |
| Ecopark | Mangrove | SAMGC1 | 26.65781 | 50.00534 | 28 | 0.87 ± 0.07 | 1.3 ± 0.03 | 113 ± 12 | 0.26 ± 0.10 | 2.00 ± 0.70 | 22 ± 9 |
| Ecopark | Saltmarsh | RTSMC1 | 26.65761 | 50.01003 | 40 | 0.94 ± 0.03 | 1.4 ± 0.08 | 53 ± 3 | 0.082 ± 0.010 | 0.60 ± 0.07 | 3.1 ± 0.4 |
| Ecopark | Saltmarsh | RTSMC2 | 26.71998 | 50.02104 | 98 | 0.40 ± 0.11 | 1.2 ± 0.02 | 104 ± 7 | 0.13 ± 0.03 | 1.2 ± 0.3 | 12 ± 3 |
| Ecopark | Saltmarsh | SASMC1 | 26.73849 | 49.99526 | 117 | 0.81 ± 0.08 | 1.4 ± 0.02 | 113 ± 7 | 0.119 ± 0.014 | 1.04 ± 0.11 | 11.2 ± 1.6 |
| Ecopark | Seagrass | RTSGC3 | 26.72047 | 49.99885 | 106 | 0.74 ± 0.04 | 1.2 ± 0.02 | 86 ± 2 | 0.10 ± 0.05 | 0.8 ± 0.4 | 7 ± 3 |
| Ecopark | Seagrass | RTSGC2 | 26.70883 | 50.01225 | 61 | 0.60 ± 0.05 | 1.2 ± 0.02 | 71 ± 6 | 0.08 ± 0.02 | 0.60 ± 0.2 | 3.8 ± 0.9 |
| Ecopark | Seagrass | RTSGC1 | 26.68064 | 50.01184 | 104 | 0.68 ± 0.04 | 1.1 ± 0.02 | 75 ± 3 | n/a | n/a | n/a |
| Safwa | Mangrove | SAMGC3 | 26.64246 | 50.01462 | 43 | 0.54 ± 0.02 | 1.5 ± 0.02 | 82 ± 1.1 | 0.28 ± 0.09 | 1.5 ± 0.5 | 12 ± 4 |
| Safwa | Mangrove | SAMGC2 | 26.63699 | 50.01067 | 83 | 0.48 ± 0.01 | 1.5 ± 0.02 | 71 ± 2 | 0.44 ± 0.06 | 2.7 ± 0.4 | 20 ± 3 |
| Uqair | Seagrass | UQSGC1 | 25.72452 | 50.23141 | 93 | 0.49 ± 0.01 | 1.1 ± 0.01 | 55 ± 1.3 | n/a | n/a | n/a |
| Uqair | Seagrass | UQSGC2 | 25.72891 | 50.22990 | 87 | 0.56 ± 0.03 | 1.0 ± 0.01 | 58 ± 4 | 0.16 ± 0.06 | 1.3 ± 0.5 | 6 ± 2 |
| Uqair | Seagrass | UQSGC3 | 25.73403 | 50.22677 | 76 | 0.59 ± 0.03 | 0.9 ± 0.02 | 55 ± 3 | 0.16 ± 0.06 | 1.3 ± 0.5 | 6 ± 2 |
2.1.2. Sediment sampling and analysis
PVC cores of 140 cm length and 7 cm internal diameter were employed to collect undisturbed sediment core samples. Cores were manually hammered into the sediment until resistance prevented further percussion (table 1). Compression of sediments during coring was corrected for by distributing the spatial discordances proportionally between the expected and the observed soil column layers and was accounted for in the calculations of bulk density, Corg stocks and accretion rates. The sediment was cut in 1 cm thick segments. Each slice was then dried at 60 °C until constant weight in order to determine bulk density (DBD: g cm−3). The dried sediment slices were then ground by pestle and mortar. Every fifth slice down to 20 cm depth was analysed for organic carbon (% OC) on a CHN analyser (Thermo Scientific CHNS element analyser). A 1 g subsample of ground sample was acidified with 4% HCL to remove inorganic carbon, centrifuged (3400 revolutions per minute, for 5 min), and the supernatant with acid residues was carefully removed by pipette, avoiding resuspension. The sample was then washed with Milli-Q water, centrifuged and the supernatant removed. The residual samples were then re-dried and encapsulated for organic carbon analyses.
Sediment accumulation rates for the last decades-century were determined using the 210Pb method. The concentrations of 210Pb in the upper 19 cm were determined in the fraction <125 µm at the Edith Cowen University (Australia) by alpha spectrometry through the measurement of its granddaughter 210Po, assuming radioactive equilibrium between both radionuclides (Sanchez-Cabeza et al 1998). The concentrations of excess 210Pb used to obtain the age models were determined as the difference between total 210Pb and 226Ra (supported 210Pb). Concentrations of 226Ra were determined for selected samples along each core by low-background liquid scintillation counting method (Wallac 1220 Quantulus) adapted from (Masqué et al 2002). These concentrations were found to be comparable with the concentrations of total 210Pb at depth below the excess 210Pb horizons. Analyses of reagent blanks, replicates and a reference material (IAEA-315, marine sediments) were carried out for both 210Pb and 226Ra to assess for any contamination and to ensure reproducibility of the results. Average sediment accumulation rates (expressed in g DW cm−2 yr−1) for the last decades/century were estimated using the Constant Flux: Constant Sedimentation model, (Krishnaswami et al 1971) and accretion rates (mm yr−1) were calculated using the dry bulk density (DBD) data of each core (table 1).
Corg stocks per unit area were calculated by summing Corg stocks in each segment interval (g Corg cm−2) down to 20 cm; segments for which we did not measure Corg data were interpolated. Corg data deeper than 20 cm were extrapolated to the equivalent of 1 m depth to bring values in line with globally reported stocks. Average short-term Corg burial rates were estimated by multiplying sediment accumulation rates (g cm−2 yr−1) by the fraction of C accumulated to 100 year depth determined by 210Pb dating.
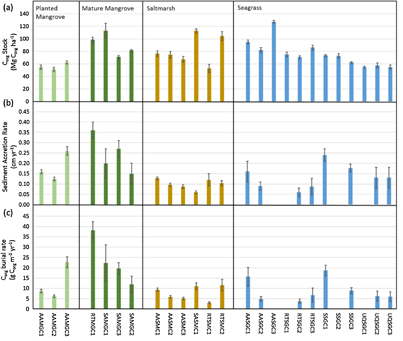
Figure 2. (a) Sediment Corg stocks extrapolated to 1 m depth (b) recent (last 100 years) sediment accretion rates and (c) Corg burial rates per sampling site for the studied blue carbon ecosystems in the Gulf coast of Saudi Arabia. No data available for AASGC3, RTSGC1, SSGC2 and UQSGC2. Values are mean ± SE.
Download figure:
Standard image High-resolution image
Table 2. Mean Corg stocks in the top 1 m sediment, MAR and SAR, and modern (last century) burial rates for mangrove, saltmarsh and seagrass habitats in the Arabian Gulf.
| Ecosystem | No. of samples | Corg stock (Mg Corg ha−1) | MAR (g cm−2 yr−1) | SAR (cm yr−1) | Modern burial rate (g Corg m−2 yr−1) |
|---|---|---|---|---|---|
| Mangrove | 7 | 76 ± 23 | 0.34 ± 0.13 | 0.21 ± 0.09 | 19 ± 11 |
| Saltmarsh | 6 | 81 ± 20 | 0.12 ± 0.03 | 0.10 ± 0.01 | 8 ± 4 |
| Seagrass | 12 | 79 ± 2 | 0.17 ± 0.08 | 0.13 ± 0.05 | 9 ± 6 |
3. Results and discussion
The length of sediment penetrated and collected ranged from 28–118 cm, and were, in general, deeper in seagrass sediments (table 1). Mean bulk density of sediments was similar for the three habitats, around 1.4 g cm−3, with no evident geographical difference or significant changes with depth. The highest bulk densities (>1.5 g cm−3) were found in saltmarsh cores, which were typically comprised of coarser sandy sediments. Organic carbon content (Corg %DW) ranged from 0.3% to a maximum of 1.4%, with a mean Corg of 0.6 ± 0.2% and median of 0.6%.
Mean Corg stocks (±SE), calculated in the upper meter of sediment were similar across habitats, at 76 ± 23, 81 ± 23 and 76 ± 20 Mg Corg ha−1 for mangrove, saltmarsh and seagrass respectively (table 2). Carbon stocks in the upper meter ranged two fold within habitats, from 51–113 Mg Corg ha−1 in the mangrove sediments, 53–113 Mg Corg ha−1 in saltmarshes and 55–127 Mg Corg ha−1 in seagrass sediments (figure 2; table 1). The studied mangrove sites included both recently planted (Abu-Ali; early 1990s) and natural mangrove stands (Ecopark and Safwa). Corg stocks were considerably lower for the planted (56 Mg Corg ha−1) relative to mature mangroves (91 Mg Corg ha−1). Taking the area coverage of remaining mangrove stands along the Saudi coast (256 ha), we estimate a total of 20 Gg Corg stored in the top 1 m of sediment of mangrove ecosystems in the Arabian Gulf coast of Saudi Arabia, and 1254 Gg Corg for the entire Gulf, based on mangrove coverage (165.5 km2) estimated by Almahasheer (2018). Unfortunately we do not know when the original mangrove stands along the coast were destroyed, as human activities have impacted mangrove plantations on the Gulf coast for centuries. However, if we consider that the remaining mangrove stands represent only 10% of the original coverage, then we can estimate that, assuming all sediment Corg was mineralised, a maximum of around 660 CO2eq may have been potentially emitted as a result of their destruction. Although the exact extent of the coverage of seagrass and saltmarshes is unknown, around 7000 km2 of seagrass meadows in the Arabian Gulf have been mapped (Erftemeijer and Shuail 2012). Based on this area coverage, we estimate that seagrass meadows of the Arabian Gulf store around 150 Tg of Corg in the top meter of sediment.
The 210Pb concentration profiles of 21 out of 25 cores showed mixing was a significant issue in the seagrass corers, all having a relatively thick mixed layer in the upper cms. Mangrove corers in Abu-Ali showed evidence of mixing in the top 1–4 cm for AAMGC1 and AAMGC3, and 1–7 cm for AAMGC2 (figure S1 available at stacks.iop.org/ERL/13/074007/mmedia) and this is likely a result of the recent replanting in the 1990s which would have considerably disturbed the sediments. Mixing was not an issue in saltmarsh sediments, probably owing to the reduced influence of bioturbation.
Mass and sediment accumulation rate (MAR, SAR) varied substantially between ecosystems (figure 2; table 2), with mangroves having the highest average MAR and SAR of 0.34 ± 0.13 g cm−2 yr−1 and 0.22 ± 0.17 mm yr−1, followed by seagrass at 0.17 ± 0.08 g cm−2 yr−1 and 0.13 ± 0.12 mm yr−1 and finally saltmarsh with 0.12 ± 0.03 g cm−2 yr−1 and 0.10 ± 0.06 mm yr−1. Variability in local Corg burial rates during the last decades largely reflected the sediment accretion rates across all sampling sites, with similar values in saltmarshes and seagrasses (8 ± 4 and 9 ± 6 g Corg m−2 yr−1), and the highest rate of burial found in mangrove habitats (19 ± 11 g Corg m−2 yr−1; table 2). However, it should be noted that it was not possible to determine the MAR, and thus the burial rate of Corg, for four of the seagrass sediments due to surface mixing of the sediment, which precluded reliable dating with 210Pb. Moreover, values for MAR and SAR among individual seagrass sites exhibited larger variability relative to the other sites, ranging from 0.08 ± 0.02 to 0.34 ± 0.04 g cm−2 yr−1 and 0.06 ± 0.2 to 0.24 ± 0.3 cm yr−1, respectively. We estimate that on an annual basis mangrove stands of the Arabian Gulf coastline currently sequester 3.1 ± 1.8 Gg Corg yr−1. If the mangroves that have been lost over the centuries were restored, mangroves could annually sequester as much as 28 Gg Corg yr−1, increasing the stored Corg stock to 180 Gg. Seagrasses of the Gulf, based on the coverage of 7000 km2 estimated by Erftemeijer and Shuail (2012), sequester 66 ± 40 Gg Corg yr−1. Given the annual sequestration rates of mangrove and seagrass, we estimate that the top metre of sediments in mangroves and seagrasses have been accumulating for 400 and 800 years respectively.
The widespread sampling undertaken in this study covering a large geographical area demonstrates that blue carbon stocks for this region are considerably less variable, both spatially and between ecosystems, compared to climatically similar parts of the globe. For example, (Schile et al 2017) reported a large variation of Corg sediment stocks in United Arab Emirates ranging from 2–515 Mg Corg ha−1. The average Corg stocks in the upper 1 m of sediments in the studied blue carbon ecosystems were substantially lower than global mean local Corg stocks reported by (Duarte et al 2013) for saltmarshes (81 ± 23 in the Arabian Gulf vs. 162 Mg Corg ha−1 as a global mean), mangroves (76 ± 23 in the Arabian Gulf vs. 255 Mg Corg ha−1 as a global mean) and seagrasses (76 ± 20 in the Arabian Gulf vs. 140 Mg Corg ha−1 as a global mean). However, our sediment stocks of Corg were comparable to those reported by (Schile et al 2017) for the climatically and geographically similar United Arab Emirates, who reported stocks of 80 Mg Corg ha−1 in the upper meter of saltmarsh sediments. Furthermore, (Schile et al 2017) described a significant difference in carbon stocks between planted mangrove and mature mangrove stands, whereby planted mangrove sediments in UAE (102 Mg Corg ha−1) contained around 35% less Corg compared to mature mangrove stands (156 Mg Corg ha−1). In our study, Corg stocks were 38% lower for the planted mangroves of Abu-Ali (56 Mg Corg ha−1) relative to mature mangrove Corg stocks (91 Mg Corg ha−1). Lovelock et al (2017) recently stated that restored mangrove forests take around 20–25 years to match the Corg sediment stocks of undisturbed mangroves. 25 years since plantation, mangrove sediments at Abu-Ali contain around 62% less Corg compared to mature mangrove stands 100 km to the south.
The low Corg stocks for mangrove sediments in this region may be a result of the harsh environment, where Avicennia marina exists at its latitudinal limits, and the absence of rivers supplying sediments to these mangrove stands. Mangrove heights here rarely exceed 5 m, typically reaching between 1–1.5 m in height, reflecting the limiting environment characterised by extreme temperatures (both low and high), low rainfall, high salinity and limited nutrient availability. Furthermore, the Gulf War oil spill in 1991 adversely affected the recently planted mangroves on the shorelines of Abu Ali (Al-Abdulkader and Loughland 2012). Atwood et al (2017) recently described global patterns of soil carbon stocks by compiling data and comparing Corg stocks in mangrove sediments across the globe. However, measurements from arid regions included in that study were limited to the Red Sea region and North West Mexico, with no studies from the Arabian Gulf included. As Almahasheer (2018) recently noted, the Arabian Gulf has significant spatial coverage of mangrove stands (165.5 km2), and this would contribute considerably to the global estimates of sequestered Corg. Combining our data for mangrove Corg stocks of the Saudi Arabian Gulf coast (91 Mg Corg ha−1 (mature mangrove stands only)) with that of Baja California reported by (Ezcurra et al 2016, 232 Mg Corg ha−1), the Red Sea coast of Egypt (Atwood et al 2017, 185 Mg Corg ha−1), the Red Sea coast of Saudi Arabia (Almahasheer 2018, 43 Mg Corg ha−1) and the Gulf coast of the UAE (Schile et al 2017, 156 Mg Corg ha−1 (mature mangrove stands only)), we calculate that mangrove sediments in tropical arid regions store on average 139 Mg Corg ha−1. If we consider that mangrove coverage for the Red Sea is 135 km2 (Almahasheer et al 2017), 165.5 km2 in the Arabian Gulf (Almahasheer 2018) and 1873 km2 in Baja California (Ezcurra et al 2016), we can estimate that mangrove sediments to 1 m depth in tropical arid climates store 30 Tg Corg. Previous estimates on global Corg stocks such as those of (Donato et al 2011 and Duarte et al 2013) were calculated based on measurements taken in tropical Indo-Pacific climates, which did not include data from the tropical arid zones. This has led to a probable over-estimation of global mangrove Corg stocks which have been biased by an emphasis on high carbon density mangrove systems, overlooking regions of less carbon dense mangrove sediments. Atwood et al (2017) calculated an average global carbon stock in mangrove sediments across a range of latitudes and climates of 283 ± 193 Mg C ha−1, which we can revise slightly downwards with the inclusion of our study to 281 ± 194 Mg C ha−1.
Published data on Corg content of seagrass sediments for comparison are currently lacking relative to mangrove sites. Fourqurean et al (2012) compiled Corg data from seagrass sediments across the globe and estimated a global mean stock in the upper meter of 140 Mg Corg ha−1, almost double the stocks we measured in seagrass meadows in the Arabian Gulf. This global average only included one study from an area with similar geographical characteristics to our study sites (Abu Dhabi), where (Campbell et al 2015) estimated a carbon stock of 49 Mg Corg ha−1, which is more than one third less than our estimates for the Saudi Arabian coast (76 Mg Corg ha−1). (Arias-Ortiz et al 2018) measured 128 ± 7 Mg Corg ha−1 in Western Australian seagrass sediments, one of the largest assemblages of seagrasses worldwide which exists in a similarly arid environment. Contrary to most published studies that show that seagrass sediments typically contain significantly less Corg compared to saltmarsh and mangrove sediments (Duarte et al 2013, Murray et al 2011, Siikamäki et al 2013, Ewers Lewis et al 2018), we found that sediments in Arabian Gulf seagrass meadows contain comparable stocks of Corg to mangrove and saltmarsh sediments.
The capacity of seagrass sediments to store carbon is believed to be influenced by local environmental conditions and landscape configuration, where exchanges of carbon may occur between habitats (Hyndes et al 2014). For example, (Walton et al 2014) demonstrated the tight coupling between arid mangroves and seagrass beds; they noted that the contribution of mangroves to seagrass sediment Corg stocks is often negligible in arid regions, yet there is Corg transfer from seagrass to mangrove, meaning seagrass beds are supporting mangroves stands. A recent study by Gullström et al (2018) observed that seagrass meadows covering a larger area with clearly defined limits tended to contain more Corg per area relative to a patchy seagrass landscape adjacent to mangrove stands. Corg stocks in each study area in this work exhibited low spatial variability i.e. within seagrass meadows of Safaniya, Uqair and Ecopark, although they did vary within the Abu-Ali region (83–127 Mg Corg ha−1). The low areal coverage of mangrove stands along the Gulf coast may also limit the capacity of Gulf seagrass sediments to store carbon, as pointed out in a recent study by (Chen et al 2017) who suggested that proximity to mangroves can enhance seagrass Corg stocks. These findings highlight the large variability in stocks which can occur within relatively small areas, which has important implications when we attempt to assess the relative risk of CO2 emissions if these habitats are destroyed (Lovelock et al 2017).
The variability of Corg stocks and % Corg, both spatially and within ecosystems, may be partially explained by their capability to successfully vertically accrete and bury carbon in sediments. Local Corg burial rates for blue carbon ecosystems in this work were around ten times lower than the global averages reported by (Duarte et al 2013) for mangroves, saltmarsh and seagrasses (163, 218 and 138 g Corg m−2 yr−1 respectively), and further differ in that mangrove ecosystems in our study sequester almost twice as much carbon as saltmarshes, in contrast to the global norm (Mcleod et al 2011). The SAR derived in this work reveal that accretion rates in the study area fall right at the lower end of the global ranges for mangrove (0.3–21 mm yr−1), saltmarsh (0.4–61 mm yr−1) and seagrass meadows (0.6–6 mm yr−1) (Duarte et al 2013). Breithaupt et al (2012) reported a median SAR in mangrove stands of 2.8 mm yr−1 based on 19 studies, which is comparable with our data (2.2 ± 0.3 mm yr−1), even though the study areas reported in (Breithaupt et al 2012) tended to receive riverine input or were at least in regions of high precipitation, unlike our study region. Other measurements of burial rates of Corg in arid regions are few. Almahasheer et al (2017) reported similar short-term (centennial) burial rates in mangroves to this study of 15 g Corg m−2 yr−1. Ezcurra et al (2016) reported a large range of Corg burial rates in Baja California of 10–260 g Corg m−2 yr−1. The low SAR and Corg burial rates observed across all ecosystems we sampled are most likely related to the restricted terrigenous inputs limited to aeolian dust deposition, as there are no permanent fluvial inputs anywhere along this stretch of coast. The higher mean SAR value for mangroves may be related to the efficiency of this habitat to trap both marine sediments and wind-borne dust amongst its aboveground biomass, in contrast to saltmarshes which are more exposed to wind removal processes, or removal by underwater currents such as in seagrass meadows. Furthermore, the mangrove stands in this study, except for Abu Ali, were surrounded by reclaimed land and urban development/infrastructure, which may increase natural sedimentation rates and deposition.
Short-term Corg accumulation rates, as determined by 210Pb dating, have been shown to be significantly higher than long-term accumulation rates, possibly due to the slow but continuous remineralisation of carbon in sediments over time (Choi and Wang 2004). Maher et al (2017) determined that carbon below an average depth of 40 cm (equivalent to 100 years of sediment accumulation) in mangrove sediments was susceptible to mineralisation and subsequent export. Baskaran et al (2017) further hypothesised that carbon mineralisation takes place over the sedimentary column resulting in significant losses of Corg in the long-term at deeper depths. Thus, our results on short-term Corg burial may overestimate the long-term burial capability of these ecosystems to sequester carbon. However, we found no consistent trend of decreasing Corg concentrations with depth, suggesting that mineralisation, if occurring, was masked by the variability in Corg over the past century.
The estimates of carbon stocks presented here highlight the importance of the protection of these threatened marine habitats. Whereas the carbon stocks currently held in mangrove sediments are modest, this only represents 10% of the historical coverage, as 90% of the mangrove cover has been lost. Hence, there is ample scope for mangrove restoration, as exemplified by replanting efforts along the Saudi coast of the Red Sea. Moreover, the comparison of Corg stocks in restored vs. undisturbed mangrove sediments in our survey shows that Corg stocks are rebuilt rapidly following restoration, as mangroves planted around 25 years ago have already developed carbon stocks that are only one third lower than nearby undisturbed mangroves forests (figure 2(a)).
4. Conclusions
This study offers a major advance in our understanding of Arabian Gulf coastal ecosystems and their capacity to sequester carbon. Furthermore, this work contributes to balance the global database on blue carbon habitat Corg storage by including vegetated coastal habitats in arid regions, underrepresented in current global assessments, such as that recently published by (Atwood et al 2017). Our results show that mangroves, seagrass and saltmarshes along the western coast of the Arabian Gulf are acting as active CO2 sinks, burying substantial amounts of carbon in their sediments on an annual basis, and contain moderate stocks of sequestered carbon, comparable per unit area among habitats, but largest at the regional scale in seagrass meadows. The destruction or disturbance of these habitats could result in the remineralisation of a fraction of the stored carbon, giving rise to significant CO2 emissions, while also making the ecosystems incapable of acting as carbon sinks in the future. Restoration of these habitats, particularly mangroves that have suffered the greatest losses, offer opportunities to contribute to mitigate climate change through CO2 sequestration, while also helping to protect the shorelines from sea level rise. The Middle East is especially vulnerable to future projected climate change, being an already extremely arid environment with very limited rainfall, few permanent fresh water sources and an increasing population. However, the results presented in this work indicate that despite the extreme environment, coastal blue carbon ecosystems store low to moderate levels of carbon and are successfully sequestering carbon on an annual basis. This study demonstrably shows for the first time the value of mangrove, saltmarsh and seagrass habitats as carbon sinks on the western coastline of the Arabian Gulf.
Acknowledgments
This work was supported by a grant from Saudi Aramco. Further funding was provided to PM by the Generalitat de Catalunya (MERS, 2017SGR 1588) and an Australian Research Council LIEF Project (LE170100219). This work is contributing to the ICTA 'Unit of Excellence' (MinECo, MDM2015-0552). The authors thank the staff at the Marine Studies department of the Centre for Environment and Water of King Fahd University of Petroleum and Minerals, for their support and expertise, especially R Lindo, R Magalles, P Bacquiran and M Lopez. We also thank I Schulz, N Geraldi, D Prabowo and R Diaz at KAUST and G Salgao at ECU for their technical support.