

Abstract
Vegetation has a substantial impact on the local climate. Land cover changes through afforestation or deforestation can amplify or mitigate climate warming by changes in biophysical and biogeochemical mechanisms. In the montane to subalpine area of the Eastern Alps in Europe, where forests have constantly expanded in the last four decades, data of meteorological stations show a consistent reduction in incoming global radiation for the period 2000–2015. To assess the potential role of forests in contributing to such a reduction, three site pairs in Central Europe with neighbouring forest and non-forest sites were analysed. In all the pairs, a lower amount of incoming radiation was recorded at the forest site. When biophysical mechanisms such as albedo, surface roughness and Bowen ratio changes were modelled together with changes in global radiation, the total radiative forcing accounted for a rate of change in air temperature was equal to 0.032 °C ± 0.01 °C per Wm−2. These results suggest that local climate is influenced by land cover change through afforestation both via albedo and radiation feedbacks but also by means of indirect biophysical and species-dependent mechanisms. The data obtained for the site pairs in Central Europe are finally discussed to infer the occurrence of similar forest-driven effects in the Eastern Alps which may explain part of the solar dimming observed in high elevation weather stations.
Export citation and abstract BibTeX RIS

Original content from this work may be used under the terms of the Creative Commons Attribution 3.0 licence.
Any further distribution of this work must maintain attribution to the author(s) and the title of the work, journal citation and DOI.
Corrections were made to this article on 14 May 2020. The versions of the article were made consistent.
1. Introduction
Mountain forests occupy approximately one fourth of the global forests (Price et al 2011) and represent the predominant land cover of European mountains, covering 41% of the total land area (www.eea.europa.eu). Mountain ecosystems are considered extremely vulnerable to climate change. Global warming threatens their biodiversity (Dulle et al 2016, Pauchard et al 2016), favours plant invasions (Petitpierre et al 2016) and can affect their hydrological cycle and even geomorphology (Beniston and Stoffel 2013, Stoffel and Tiranti 2014). At the same time, warming endangers the ecosystem services that they provide (Bugmann et al 2016, Mina et al 2017).
A recent review showed a faster warming at high compared to low elevations over the last decades in different mountain areas of the world (Pepin et al 2015). Modelling and observational studies investigating such elevation-dependent air warming trends showed, however, that this pattern is not universal. While modelling studies mostly showed a positive elevation-dependent warming (i.e Rangwala et al 2015, Kotlarski 2015, Wang et al 2016), a number of observational studies demonstrated that the recent rate of increase in air temperature measured by weather stations, can be higher at low compared to high elevations in different mountain ranges (Philipona 2013, Kirchner et al 2013, Zeng et al 2015, Tudoroiu et al 2016). Such negative elevation-dependent warming (EDW) was interpreted as a consequence of 'solar brightening' (increasing global radiation) at low elevations. This was probably triggered by an improved air quality in the most populated areas of the mountain regions (Philipona 2013, Zeng et al 2015, Tudoroiu et al 2016).
A comparative analysis of data from weather stations located at low and high elevations in the Eastern Alps (in the region of Trentino, Italy), indicated that low-elevation solar brightening was accompanied by a significant 'solar dimming' (a reduction of incoming global radiation) at high elevations in the montane to subalpine zone, below the tree line (for the period 2000–2010). This effect further amplified the negative EDW (Tudoroiu et al 2016). It was hypothesized therein, that the observed solar dimming at high elevations was associated to the recent expansion and growth of mountain forests, even if no specific quantitative validation of such a hypothesis could be made.
The study presented here was designed to further explore this complex aspect, i.e. local forest feedback on global radiation and, with this, on the local air temperature. The solar irradiance series previously analysed (Tudoroiu et al 2016) were extended until 2015 and corresponding forest inventory data were assessed. Despite the availability of solar irradiance and forest inventory data, in the mountainous region of the Eastern Alps (as in the case of Trentino), no data are available to compare adjacent forest and non-forest sites without disturbing effects of complex mountainous orography (e.g sites being at the same altitude and with similar slope, aspect and radiosity). Such conditions were instead found for three neighbouring forest/non-forest sites in Central Europe. Herein, (i) the effect of the presence/absence of the forests on the local climate (irradiance, air temperature and surface energy balance) was explored and (ii) a simple model was tested to estimate how land-cover change driven biophysical surface properties may impact the radiative forcing. The results are discussed in the light of the observed solar dimming in mountain areas and should stimulate novel investigations on the mechanisms of elevation-dependent warming.
2. Data and data analysis
2.1. Forest inventory data and global radiation data at high elevations in Trentino
Forest inventory data for Trentino was provided by the 'Servizio Foreste e Fauna' of the province and it comprised net surface of forest area and growing stock for the period 1977–2015.
Global radiation (G) data measured at high-elevation stations from Trentino (in the montane to subalpine zone) were obtained from www.meteotrentino.it/ and from the Fondazione Edmund Mach. They are briefly described in the online supplementary table 1 available at stacks.iop.org/ERL/13/064014/mmedia and their geographical distribution is shown in supplementary figure 1. Mean annual values were calculated for all the stations and the trend in irradiance was determined by means of GLM (General Linear Model) analysis. Years with less than 85% of available daily data were not included in the calculation. The monthly trends over the entire available period were also computed using only months with less than 15% missing data (5 days missing).
2.2. Forest and non-forest sites in Central Europe
FLUXNET site pairs consisting of a forest and a neighbouring cropland or grassland were selected for analysing differences in incoming radiation and air temperature between different ecosystems. The site pairs approach allows a direct evaluation of the differences between different land covers (Vanden Broucke et al 2015). The criteria for the site selection were:
- environmental and geographical location: the pair must be composed of one site located in a forest and the other one in agricultural land/grassland; the full ensemble of the pairs needs to be located in the mid-latitudes, where the net effect of afforestation is not precisely understood; the distance between the sites must not exceed the scale of mesoscale air masses circulation;
- data availability: common data availability for at least 5 years;
- areas located in flat terrain were preferred to avoid additional relief effect on the radiation balance.
The pairs which satisfied the above criteria are briefly described in table 1 and their location is shown in figure 1.
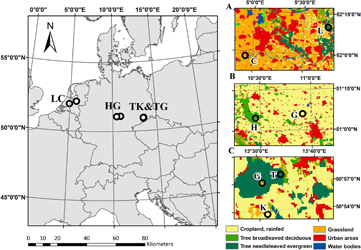
Figure 1. Location of the selected 3 FLUXNET site pairs (LC- Loobos/Cabauw, HG—Hainich/Gebesee,TK—Tharandt/Klingenberg, TG-Tharandt/Grillenburg). The right panels indicate the surrounding land cover of the individual FLUXNET sites (A: Loobos—L and Cabauw—C, B: Hainich—H, Gebesee—G and C: Tharandt—T, Klingenberg—K, and Grillenburg—G) with the background of ESACCI land cover map (http://maps.elie.ucl.ac.be/CCI/viewer/).
Download figure:
Standard image High-resolution imageThe level 2 product data (half-hourly data, quality checked by the PI of the site but not gap filled) for the indicated periods (table 1) were obtained from www.europe-fluxdata.eu/. In the case of the TK site pair, a third site was additionally selected (the grassland Grillenburg). The comparison between the measurements above the grassland Grillenburg (58 ha) and above the surrounding Tharandt forest (5800 ha), should help to illustrate the extent of forest's atmosphere feedbacks on adjacent ecosystems.
Table 1. Selected site pairs.
| Site pair (code) | Complete name of the site (FLUXNET code) | Altitude (m a.s.l), Latitude and Longitude (decimal degrees) | Analysed period | Vegetation type |
|---|---|---|---|---|
| HG | Hainich (DE-Hai) | 430, 51.0, 10.45 | 2004–2014 | Deciduous broadleaf forest |
| Gebesee (DE-Geb) | 161.5, 51.10, 10.91 | Cropland (cereal crop) | ||
| TK | Tharandt (DE-Tha) | 380, 50.96, 13.57 | 2005–2015 | Evergreen needle leaf forest |
| Klingenberg (DE-Kli) | 478, 50.8928, 13.52 | Cropland (mainly cereal crop) | ||
| Grillenburg (DE-Gri) | 380, 50.95, 13.51 | Grassland | ||
| LC | Loobos (NL-Loo) | 25, 52.17, 5.74 | 2003–2012 | Evergreen needle leaf forest |
| Cabauw (NL-Ca1) | 0.7, 51.97, 4.93 | Grassland |
In a pre-processing step, the influence of missing data was tested for each site separately by simulating data gaps in complete measuring series (the procedure is described in detail in the supplementary material). The aim was to minimize the effect of data gaps (due to temporary sensor removal for calibration, malfunction etc) on the analyses.
2.3. Site pairs—data analysis
The sites were analysed both, pairwise and aggregated to land use groups, to assess the existence and the significance of differences in incoming global solar radiation (G, 0.3–4.5 µm). Since each of the investigated forests was composed of different tree species, analysing the pairs individually provides an idea of the tree species influence on the mentioned parameters. On the other hand, grouping the sites by land use helps to identify patterns of the land cover influence.
A direct difference (forest minus cropland/grassland) between the half hourly measuring values was calculated for incoming global radiation (G) and air temperature (TA) for each site pair. Frequency distributions were calculated for the resulted differences using narrow difference classes (class width of 10 Wm−2 and 0.1 °C respectively). For each resulting frequency class (negative or positive) a mean difference in global radiation (forest minus non-forest) was calculated as:

where m is the centre of each frequency class, n is the number of differences in a frequency class and N is the total number of considered half hourly values.
The aim of this approach was to evaluate the magnitude of the net differences in irradiance over various classes of differences, or in other words to understand when the differences in irradiance were larger and when smaller and when they were positive or negative. Therefore a net difference was further computed for the absolute values of each class (i.e 0–10, 11–20, 21–30...) as
where ∆c(+) and ∆c(−) are the values obtained for the positive difference classes and for the corresponding negative difference classes respectively.
This procedure was applied on the entire study period, on an annual and monthly basis. The net effect for a specific time step was calculated as:
Δtot = ΣΔ(tot) = the net difference for the entire studied period
Δa = ΣΔnc(a) = the net difference for the entire studied period
Δm = ΣΔnc(m) = the net difference on monthly level.
A graphical example of the approach is shown in supplementary figure 3. In the following text ∆Ga, ∆Gm, ∆Gtot and ∆TAa ∆TAm, ∆TAtot stand for annual, monthly and total differences of global radiation and air temperatures, respectively.
The annual values were used to correlate ∆Ga (independent variable) to the annual differences in air temperature (∆TAa, dependent variable) for each site. The aim of this analysis was to obtain the individual trend for each pair but also to build a common trend over all the sites. To compensate for possible systematic bias in air temperature due to differences in site properties between the pairs, e.g. elevation, the intercept of each individual regression function (i.e. for each pair) was removed, therefore assuming that a change of 0 W m−2 in ∆Ga corresponds to a change in air temperature (∆TAa) of 0 °C at all sites. This procedure also set the common basis to analyse all site pairs together.
For other parameters like sensible heat flux (H), latent heat flux (LE) and albedo, mean annual courses were assembled from daily means.
In the specific case of the site pair Hainich-Gebesee (where the sites are separated by 270 m of elevation) additional analysis was made to account for the possible influence of elevation difference on the differences in irradiance. Air masses coefficients—defined as the direct optical path length of solar irradiance through the earth atmosphere—were computed for the elevation of the two stations (according to Kasten and Young 1989). Furthermore, a theoretical difference in clear sky irradiance (considering a 10% proportion of diffuse radiation) was calculated using the mean coefficients for polluted air according to Meinel and Meinel (1976).
2.4. Modelling
For each site pair, an afforestation effect was simulated adapting the modelling approach used by Lee et al (2011), which simulates a deforestation effect on the surface air temperature using site pairs consisting of forests (FLUXNET forest towers) and surface weather stations located in grasslands as a proxy for open land. The main assumptions made therein are: the two sites forming a pair receive the same amount of incoming shortwave (SWin) and incoming longwave radiation (LWin), air is sufficiently mixed at blending height h so that Tair is identical. Minor influences produced by differences in emissivity or soil heat flux are not considered.
The approach used in this paper attempts to assess the inverse effect (afforestation) by similar means: i.e. site pairs approach, making similar main assumptions, but accounting also for the observed change in incoming radiation.
This implied the calculation of a total forcing (∆TF) as a cumulative effect of the difference in incoming radiation (∆G) and the intrinsic biophysical mechanisms involved by land cover changes using the equation:
where
∆G = the difference in incoming global radiation (0.3–4.5 µm) forest-grassland/cropland
∆RF(albedo) = the radiative forcing due to albedo changes
∆ER(roughness) = energy redistribution caused by changes in roughness
∆ER(Bowen) = energy redistribution caused by changes in Bowen ration
ΔRF(albedo) = ΔS/1 + f where ∆S is the difference in absorptivity between the forest and the grassland
f is an energy redistribution factor (computed as explained in the supplementary material)
ΔER(roughness) = Rn × Δf1/(1 + f)2 where Rn is the net radiation, ∆f1 is the change in energy redistribution due to changes in roughness
ΔER(Bowen) = Rn × Δf2/(1 + f)2 where ∆f2 is the change in energy redistribution due to changes in Bowen ratio.
∆f1, ∆f2 (the changes in energy redistribution factor f) and f were computed according to the methodology of Lee et al (2011). A more detailed explanation of the equations that were used is presented in the supplementary material.
Daily mean values were used for all computations. Furthermore a common correlation ∆TF versus ∆TAa was build using the same procedure as for the correlation between ∆Ga and ∆TAa.
Above canopy data for the forests were only available for mature forest ecosystems and not for other development stages. Thus an additional assumption of our model is that the grass/cropland is replaced by a mature forest, ruling out the consideration of additional effects specific for earlier development stages, like for example elevated transpiration (Moore et al 2004), higher stomatal conductance, slightly higher albedo etc. Nonetheless, the calculated total forcing should exhibit the general implications of converting a grassland/cropland to a forest.
3. Results
3.1. Forest inventory data and global radiation trends at high elevation in Eastern Alps
The net forest area in Trentino increased by approximately 10% and by more than 50% in growing stock since 1977. During the last and a half decade the increase accounted for about 2% in net forest cover and approximately 20% in growing stock (figure 2(a)). Global radiation (G) measured at montane to sub-alpine zone stations in Trentino (supplementary figure 1) consistently decreased over the period 2000–2015 (figure 2(b)), thus confirming previous observations made for a shorter period of time by Tudoroiu et al (2016). Solar dimming was more pronounced in summer, particularly in June (supplementary figure 5).
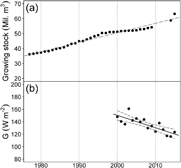
Figure 2. Trend in growing stock in Trentino for the period 1977–2015 (a) and mean global radiation (G) trend for the period 2000–2015 for high elevation weather stations (b). Both regressions are significant at p < 0.001; slopes of linear regressions are 0.64 ± 0.04 million m3 year−1 (R2 = 0.97) for panel (a) and −2.0 ± 0.86 Wm−2year −1 (R2 = 0.64) for panel (b). The annual means in global irradiance from panel (b) were obtained by averaging the records of the stations mentioned in supplementary table 1. The numerosity of stations with available data differed over the studied period as mentioned in supplementary table 1 and supplementary figure 4. The dashed lines indicate the 95% confidence interval.
Download figure:
Standard image High-resolution image3.2. Global radiation, air temperature and energy balance for the Central European site pairs
Global incoming radiation was generally less over forests than over the other land cover types (cropland and grassland) (figure 3(a), supplementary figures 7–9). Annual means of ∆Ga (computed as forest minus grassland/cropland) were mostly negative for all the sites (figure 3(b)). Mean values over the studied period are shown in table 2. The analysis of monthly data revealed that the HG and TK site pairs were different from the LC (figure 3(c)) site pair. The largest monthly differences in incoming global radiation (∆Gm) were observed in winter time for HG and TK, and in spring for LC (figure 3(c), supplementary figures 10–12). When all the site pairs were merged (figure 4), the differences in incoming global radiation ∆Ga were correlated to the corresponding observed differences in air temperature (∆TAa, p = 0.0002). A variation of one W m−2 of incoming radiation corresponded to a change of 0.030 ± 0.02 °C in air temperature. Only minor and non-significant mean differences in Ga were observed for the TG (Tharandt/Grillenburg) site pair (supplementary figure 6). The latent heat flux (LE) was on average slightly higher above the forest for all the site pairs (figure 5(a), table 2). The sensible heat flux (H) was on average always higher above the forest (figure 5(b), table 2). Surface albedo was lower over the forest (figure 5(c), table 2). The difference in air masses coefficients caused by the difference in elevation at the HG site pair was equivalent to 35 Wm−2 for clear sky irradiance.

Figure 3. Difference in global radiation calculated for different classes of differences in global radiation (∆ Gclass, (a)), mean annual global radiation differences (∆Ga, (b)), and mean monthly global radiation differences (∆Gm, (c)) for the site pairs Hainich-Gebesee (HG), Tharandt-Klingenberg (TK), Loobos-Cabauw (LC). In panel (a) each bar corresponds to the value computed for a 10 Wm−2 class in irradiance difference (i.e from 0–10, 11–20, 21–30 ... Wm−2). In panels (b) the encircled points represent the years with the biggest influence of missing data. The grey band ((b) and (c)) shows the 95% confidence interval.
Download figure:
Standard image High-resolution image
Figure 4. Correlation between the mean annual differences in air temperature (∆TAa) and annual global radiation differences (∆Ga) for the site pairs Hainich/Gebesee (filled points), Tharandt/Klingenberg (empty squares) and Loobos/Cabauw (empty circles). The y axis values were obtained by removing the intercept of the regression of each individual pair. Dashed lines indicate the 95% confidence interval. The correlation is significant at p = 0.0002, the slope of the linear regression is 0.03 ± 0.02 °C W−1 m−2 and the coefficient of determination R2 = 0.42. The red point represents the year 2004 in Hainich which was affected by an exceptional beech masting as well as unusual spring conditions resulting in xeromorphic leaves (not included in the regression, data not shown).
Download figure:
Standard image High-resolution image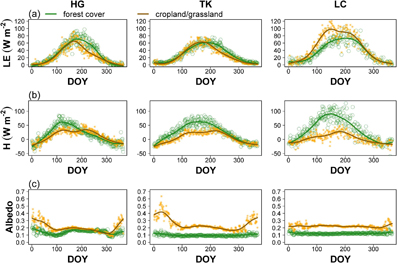
Figure 5. Mean annual courses for the 3 site pairs Hainich/Gebesee (HG), Tharandt-Klingenberg (TK) and Loobos/Cabauw (LC): (a) annual courses of latent heat flux (LE), (b) annual courses of sensible heat flux (H), (c) annual course of albedo. The green points (lines) represent the forest cover while orange points (brown lines) represent the grassland/cropland ecosystem. The lines represent a smoothing spline line fitted to the plot.
Download figure:
Standard image High-resolution image3.3. Total radiative forcing
The contribution of each term of equation 1 to the total forcing (∆TF) is shown in figure 6. ∆Ga is negative for all the site pairs (table 2). Albedo (∆RF(albedo)), and Bowen ratio (∆ER(Bowen)) forcings were always positive. The forcing caused by differences in surface roughness (∆ER(roughness)) was always negative. When the differences in the observed radiation are also considered, the mean ∆TF was negative for HG and TK but slightly positive for LC (figure 6, table 2). A significant correlation was found between ∆TAa and ∆TF (p < 0.00001). Air temperature changed by 0.032 ± 0.01 °C per Wm−2 of TF (figure 7). ∆TF was instead largely positive for the TG site pair, as in this case the difference in radiation ∆Ga was negligible (table 2).

Figure 6. Total Forcing (∆TF) components computed for each site pair. Error bars show the 95% confidence interval.
Download figure:
Standard image High-resolution image
Figure 7. Correlation between the mean annual difference forest-cropland/grassland in air temperature (∆TAa) and the annual modelled forcing of the afforestation (∆TF) for the site pairs Hainich/Gebesee (filled points), Tharandt/Klingenberg (empty squares) and Loobos/Cabauw (empty circles). The y axis values were obtained by removing the intercept of the regression of each individual pair. Dashed lines indicate the 95% confidence interval. The correlation is significant at p < 0.001, the slope of the linear regression is 0.032 ± 0.01 °C W−1 m−2. The regression was calculated by forcing the intercept to 0 (R2 = 0.75). The red point represents the year 2004 in Hainich which was affected by an exceptional beech masting as well as unusual spring conditions resulting in xeromorphic leaves (not included in the regression, data not shown).
Download figure:
Standard image High-resolution image
4. Discussion
Zeng et al (2017) recently showed that the global increase in terrestrial leaf area index over the last three decades caused a reduction in incoming shortwave radiation of 0.09 ± 0.02 Wm−2 per decade. This result was interpreted as a consequence of the increasing forest cover, leaf area and longer growing seasons, that overall led to higher evapotranspiration which increased the water vapour content in the atmosphere and reduced the incoming global radiation.
The observations made here confirmed this trend, but at a more local scale. Solar dimming was observed in the montane to subalpine zone of Trentino during the last one and a half decade (2000–2015) (figure 2(b)). Since 1977, the mountain range of Trentino went through a substantial land cover change associated to both an increase in forest cover and in growing stock (figure 2(a)) (Sitzia 2009, Provincia Autonoma di Trento (PAT) 2016). During the period 2000–2015, the increase in forest area in Trentino and the concomitant decrease in global radiation at high elevation (figure 2) led to a negative correlation (R = −0.74) and the 20% decrease in G corresponded to a 23% increase in growing stock, even if not necessarily reflecting causal relationships. Nevertheless, forest growth and expansion may, however, affect incoming global irradiance through a series of mechanisms:
- Forests emit larger amounts of biological volatile organic compounds (BVOCs) than other land cover types (Guenther et al 1995, Karl et al 2009) probably as a consequence of higher leaf area index that forests reach in more advanced development stages. Such volatiles can act as precursors of secondary organic aerosol (SOA) (Ehn et al 2014, Fuzzi et al 2015) leading to the formation of atmospheric nanoparticles (Jokinen et al 2015). Recent experimental studies confirmed that highly oxidized biogenic volatiles alone have nucleation activity, thus playing a role in the initial growth of cloud condensation nuclei precursor particles (CCN) (Kirkby et al 2016, Tröstl et al 2016). Light scattering aerosols such as CCNs may cause solar dimming with an associated decrease in the ratio between direct and diffuse radiation (Strada et al 2015). There are repeated observations that forests trigger indeed the formation of clouds and haze (Spracklen et al 2008, Teuling et al 2017).
- The presence/absence of a forest on the slope of a hilly/mountain area can affect the amount of incoming global irradiance which is reflected towards any receptor, such as for instance a global radiation sensor located in the proximity of that slope. This effect, which is defined as 'radiosity' may create additional radiative forcing at the receptor which can be negative or positive. Higher reflectance, which is generally associated with grasslands or crops, may lead to increased radiosity, but also to a decrease in the longwave thermal emission. Higher absorption, as in case of forests, may instead reduce the radiosity while potentially enhancing the longwave emissions. In both cases, however, turbulent exchange of sensible and latent heat may affect the spatial patterns and temporal dynamics of the net radiative forcing which is created by the contrasting land cover types on the mountain slopes.
4.1. Forests' feedback on global irradiance
The effects of afforestation or deforestation on local climate have been often assessed by comparing forests and neighbouring non-forest sites (i.e. Teuling et al 2010, Lee et al 2011, Baldocchi and Ma 2013, Zhang et al 2014, Luyssaert et al 2014, Vanden Broucke et al 2015). Paired forests and non-forests sites are hardly found in mountain areas where, for instance, the radiosity effects of the slopes are likely to play a role. This justifies the selection of paired sites in regions where orographic effects are negligible. The Central European site pairs that are analysed here strongly supported the view that forests may cause a consistent and significant dimming (figure 3). Since the two sites forming a pair are separated by a certain spatial distance, the chance that they were subject to different synoptic conditions cannot be totally excluded. Differences in half-hourly radiation can be largely negative or positive when the sky at one of the two sites is overcast while it is clear at the other one. Binning the half hourly radiation differences into classes showed that, the frequency of those conditions was mostly equivalent in all site pairs, while incoming radiation was significantly different mostly when the differences in irradiance between the two sites were 0–350 Wm−2 (figure 3, supplementary figures 7–9). The presence of thicker clouds over forest in the cloudy episodes, the occurrence of more haze over forest in the sunny episodes or more shallow clouds over forests might explain such differences.
The elevation difference between the forest and the cropland at the HG site pair (approximately 270 m, table 1) may have caused additional effects. Such a difference in elevation corresponded to 0.03–0.6 relative air masses for high and low sun heights, respectively. This would imply that, simply as an effect of elevation difference, the irradiance over the Hainich forest should be potentially 35 W m−2 higher. However, the comparison of the observed differences (forest minus cropland) for clear sky days (sun heights greater than 10 degrees) with the corresponding calculated theoretical differences, showed that the observed net difference reached on average only 37% of the expected 35 W m−2. This confirms the diminishing effect of the forest on the incoming radiation. It cannot be totally excluded that over the hills, where the Hainich forest is located, the overall cloud cover percentage was higher. On one hand, clouds passing through can persist due to the orographical barrier, but on the other hand, it can be exactly the postulated land use effect.
The examination of the 'special' additional site pair (TG, Tharandt/Grillenburg) reinforced the results obtained for the other three site pairs. Here, the advection of 'forest air' is likely prevalent also above the grassland area of Grillenburg which is entirely nested into the Tharandt forest. In this case, the mean difference in irradiance over the studied period for the two sites was nearly zero (supplementary figure 6). This indicates that the extent of the grassland was too small to have a feedback on the local irradiance climate.
In this line of arguments the forest expansion in Trentino, reflected in both, increase in area and growing stock and which went on for over three decades (figure 2(a)) can well have triggered the observed dimming, even if the two effects did not occur simultaneously.
The differences in incoming global radiation between forest and non-forest land were larger during winter for the site pairs HG and TK (figure 3(c), supplementary figures 10–12). This result is apparently surprising, since studies on secondary plant metabolism and on the temperature dependence of BVOCs emission by plants reported that their emissions are generally higher in the warm season (Guenther et al 1995, 2006). However, it has also been shown that leaf litter can be a significant emitter of monoterpenes (Faiola et al 2014) and that needle litter in the first stages of decomposition (up to 165 days) also emits monoterpenes at rates comparable to those emitted by attached needles (Isidorov et al 2010). Accordingly, emissions of BVOCs from forests do also occur during winter. Nevertheless, other confounding effects may come into play during summer: non-forest areas in the proximity of Gebesee and Klingenberg are croplands and it is well known that crop management, such as tillage and intensive mechanical soil cultivation, occurs mainly in spring and summer (i.e Funk et al 2008). Tillage operations inevitably release particulate matter (PM) (dust and bioparticles) which can be 5 times higher during summer months compared to spring (Funk et al 2008). Those anthropogenic particulate emissions are therefore likely to offset part of the BVOC-driven solar dimming effect of the forests, by attenuating incoming radiation where agricultural areas and roads prevail. Such an effect was not recorded at the site pair LC, where the land cover in the proximity of the Cabauw station (non-forest site) is mainly grassland, which is generally less intensively managed than croplands. In this case, the largest differences in irradiance between forest and non-forest land were observed during late spring and early summer. In this period of the year, the growth rates and monoterpene emissions of Scots pine (the dominant tree species of the Loobos forest) are expected to be the highest (Holzke et al 2006) and dust emission from less intensively managed land can hardly offset the forest-driven solar dimming effect. It must be outlined, however, that the Cabauw station is closer to the sea (60 km) than Loobos (figure 1). Wintertime storms often transport marine aerosol inland and light attenuation effects are often larger when the distance from the coastline is smaller. Therefore it cannot be excluded that the larger values of ∆Gm during summer for the site pair LC may be also influenced by the occurrence of periodic gradients of marine aerosols concentrations.
Table 2. Mean annual differences for various parameters (± standard errors) computed for the analysed site pairs.
| Forest-crop/grassland | HG | TK | LC | TG |
|---|---|---|---|---|
| Sensible heat flux (∆H [Wm−2]) | 5.38±3.55 | 16.85±3.62 | 33.03 ±5.00 | 19.99 ± 3.37 |
| Latent heat flux (∆LE [Wm−2]) | 5.21±3.71 | 3.27±3.17 | −13.27±5.48 | 1.24 ± 3.32 |
| Albedo (∆α [%]) | −24.08±2.19 | −57.64±0.0 | −44.13±0.03 | −60.24±0.05 |
| ∆Ga [Wm−2] | −5.5±2.25 | −6.11±3.54 | −6.81±1.35 | −0.25±2.56 |
| ∆RF(albedo) [Wm−2] | 1.08±0.52 | 2.71±0.56 | 1.75±0.12 | 2.36±0.34 |
| ∆ER(roughness) [Wm−2] | −6.37±0.45 | −5.9±0.79 | −5.54±0.44 | −5.79±0.42 |
| ∆ER(Bowen) [Wm−2] | 2.68±0.17 | 5.14±0.56 | 11.75±0.7 | 11.8±0.65 |
| ∆TF[Wm−2] | −8.12±2.47 | −4.16±3.73 | 1.16±1.64 | 8.12±2.73 |
In Trentino we observe a maximum reduction in global radiation in summer (June, supplementary figure 5) when BVOC emissions are expected to be the highest (Guenther et al 1995, 2006). Here, the lack of crop management activities and different phenology of high elevation forests can explain the different dimming seasonality compared to the Central European site pairs.
4.2. Solar dimming effects on air temperature
A lot of attention was paid to the question whether forests cool or warm the air or, in other terms, if forests mitigate or exacerbate global warming at the local and regional scales. There is a general consensus that afforestation exacerbates warming in snow-rich areas, as persisting snow cover over grasslands and other non-forest areas cause prolonged high-albedo conditions. On the contrary, the snow cover rapidly disappears in forests when the accumulated snow falls from the tree branches soon after a snow event (Schwaab et al 2015). Bonan (2008), among others, argued that afforestation may lead to substantial warming in Northern latitudes, but also to substantial cooling in the Tropics and uncertain effects in mid latitudes. Alkama and Cescatti (2016) showed instead that a decrease in forest area caused an increase in near-surface air temperature in all the regions of the world, especially in terms of maximum temperatures. The observation of an overall decrease in global incoming radiation above forests, as considered in this study, would suggest in a first instance that a decrease in incoming energy could somewhat translate into an overall cooling effect. Forests have a lower albedo and a higher surface roughness compared to other land covers (Baldocchi and Ma 2013). Lower albedo is the consequence of the absorption of more sunlight by the surface and such additional absorbed energy must be somewhat redistributed into sensible, latent and soil heat flux. On the other hand enhanced surface roughness facilitates turbulent heat dissipation either as sensible or latent heat flux (Rotenberg and Yakir 2010, Lee et al 2011). In the specific case of the three site pairs, the albedo was always lower in case of the forest and this translated on average into a higher longwave emission. The higher surface roughness of the forests resulted in generally higher sensible heat fluxes (figure 5).
These results are confirmed by the modelling approach employed here. The darker surface and the higher Bowen ratio of the forests led to a positive ∆RF(albedo) and ∆ER(Bowen) (figure 6, table 2). On the other hand, forests have a lower aerodynamic resistance compared to other ecosystems leading to a negative ∆ER(roughness). In the case of the site pairs HG and TK the dimming induced by the forests prevailed over the other terms causing a negative ∆TF (cooling effect). At the LC site, the ∆ER(Bowen) is higher compared to those at the HG and TK, showing the differences in latent and sensible heat between the grasslands (Cabauw) and croplands (Gebesee and Klingenberg). In this case, the dimming effect was balanced by the positive ∆RF(albedo) and ∆ER(Bowen) forcing and caused a small positive ∆TF (figure 6, table 2). Another interesting modelling result is that broadleaf forests, such as the European beech forest at Hainich, more likely produce a negative forcing than coniferous forests (Tharandt and Loobos forests), mainly as a result of a higher albedo and lower Bowen ratio.
The significant correlation found between ∆TF and the corresponding differences calculated for air temperature (∆Ta, figure 7) shows that, a one unit change in ∆TF (1 Wm−2) causes a change of 0.032 ± 0.01 °C in near-surface air temperature. This effect is comparable to what was found in a regression analysis between ∆G and ∆TAa (0.030 ± 0.02 °C). An indirect confirmation of the strong effect of forests on solar radiation is the positive ∆TF recorded at the TG site pair. The air quality over the small grassland patch embedded in a large forest complex is presumably the same than over the forest and thus almost no dimming effect was observed. The sum of the other biophysical mechanisms results in a positive ∆TF.
In a global scenario, where no land cover change is considered, the radiative forcing caused by changes in global radiation is assumed to be in the order of 0.2 °C/Wm−2 (Turnock et al 2016). Bearing this in mind we can assume that for the analysed site pairs, the modelled biogeophysical changes induced by afforestation (changes in albedo, roughness and Bowen ratio) reduced the predicted global radiation driven radiative forcing by approximately one order of magnitude. Nonetheless, based on this line of arguments, it may be concluded that modelled forest-driven solar dimming can lead to a small but detectable cooling of the air over the forest.
5. Conclusions
A robust indication of this study is that forest-driven dimming effects are detectable and hold for both, broadleaf (European beech at Hainich) and coniferous forests (Norway spruce at Tharandt and Scots pine at Loobos). All those species are known to be BVOC emitters (Karl et al 2009), which are precursors of SOAs and CCNs (Claeys et al 2004). This can imply that the feedback of forests on global radiation is likely mediated, among other factors, by their BVOC emissions. This assessment is only based on an inference and not on direct measurements and thus it certainly requires further verification and experiments. A second conclusion is that the hypothesis made by Tudoroiu et al (2016) that the expansion and growth of forests could have triggered the observed solar dimming at high elevations (within the tree line) in the Eastern Alps, is reinforced. The results presented in this paper do not allow to directly transfer the feedback observed at the site pairs in Central Europe to high elevations in the montane to subalpine region. But they strongly suggest that the continuous increase in forest cover and growing stock since mid '70 could be one major mechanism contributing to the consistent decreasing trend in global radiation, which was observed in the high montane forest belt of Trentino. A third conclusion of this paper, which also requires further validation, is that any decrease in global radiation above forest may translate into substantial cooling. If this holds true, solar dimming at high elevation in the Eastern Alps could be indeed the main contributor to the observed negative elevation-dependent warming which has been previously observed.
Acknowledgments
This study was realized within a PhD project realized in collaboration between FIRS>T (FEM International Research School), BOKU University and CNR-IBIMET. It contributes to the objectives of MountFor, a Project Centre of the European Forest Institute (EFI). We thank Meteotrentino (PAT), Centro Transferimento Tecnologico of Fondazione Edmund Mach, Emanuele Eccel, Gianantonio Battistel and 'Servizio Foreste e Fauna' of Provinicia Autonoma di Trento. The FLUXNET tower data sets used in this manuscript are available for download free of charge at the European Fluxes Database Cluster (www.europe-fluxdata.eu/). We thank all site investigators of the used site pairs, their funding agencies, and the various regional flux networks (ICOS and FLUXNET). We thank Frank Tiedemann, Lukas Siebicke and Jan Elbers for timely input. We thank the © ESA Climate Change Initiative—Land Cover project led by Université Catholique de Louvain (2017) for producing the land cover map which is used in figure 1.