

Abstract
Biochar amendment has been proposed as a strategy to improve acidic soils after overuse of nitrogen fertilizers. However, little is known of the role of biochar in soil microbial biomass carbon (MBC) and bacterial community structure and diversity after soil acidification induced by nitrogen (N) deposition. Using high-throughput sequencing of the 16S rRNA gene, we determined the effects of biochar amendment (BC0, 0 t bamboo biochar ha−1; BC20, 20 t bamboo biochar ha−1; and BC40, 40 t bamboo biochar ha−1) on the soil bacterial community structure and diversity in Moso bamboo plantations that had received simulated N deposition (N30, 30 kg N ha−1 yr−1; N60, 60 kg N ha−1 yr−1; N90, 90 kg N ha−1 yr−1; and N-free) for 21 months. After treatment of N-free plots, BC20 significantly increased soil MBC and bacterial diversity, while BC40 significantly decreased soil MBC but increased bacterial diversity. When used to amend N30 and N60 plots, biochar significantly decreased soil MBC and the reducing effect increased with biochar amendment amount. However, these significant effects were not observed in N90 plots. Under N deposition, biochar amendment largely increased soil bacterial diversity, and these effects depended on the rates of N deposition and biochar amendment. Soil bacterial diversity was significantly related to the soil C/N ratio, pH, and soil organic carbon content. These findings suggest an optimal approach for using biochar to offset the effects of N deposition in plantation soils and provide a new perspective for understanding the potential role of biochar amendments in plantation soil.
Export citation and abstract BibTeX RIS

Original content from this work may be used under the terms of the Creative Commons Attribution 3.0 licence.
Any further distribution of this work must maintain attribution to the author(s) and the title of the work, journal citation and DOI.
1. Introduction
Nitrogen (N) deposition in soil is a major concern around the world. In China, the average bulk deposition of N has increased from 13.2 kg N ha−1 yr−1 in the 1980s to 21.1 kg N ha−1 yr−1 in the 2000s (Liu et al 2013). Atmospheric N deposition in forest ecosystems, which is expected to increase further in the future, would significantly modify nutrient availability (Janssens et al 2015). N is generally considered the main element that controls plant productivity, species composition, and diversity (Weand et al 2010). The increases in N deposition are associated with an increase in both soil acidification (Guo et al 2010, Lu et al 2014) and greenhouse gas emission (IPCC 2007). Acidification can affect soil microorganisms, which are key drivers in ecological cycling (Xu et al 2014, Huang et al 2016). It is important for local and global economies to take actions to reduce N deposition and its negative impact (Zhang et al 2017). Although several methods (e.g. liming and plant material amendments) have been developed to remediate acidified soils, they have some drawbacks (e.g. unavailable in many areas and short-term effects) (Yuan and Xu 2015). A cost-effective soil amendment is required to solve this problem and biochar amendment has been proposed as one possible solution (Xu et al 2014).
Biochar has been reported to modify soil quality characteristics, thereby increasing crop yields (Novak et al 2014). Because it is usually alkaline, biochar can increase the pH of acidic soils (Khan et al 2013, Rees et al 2014). Furthermore, biochar application has also been suggested to contribute to climate change mitigation by reducing soil N2O emissions and increasing the sequestration of carbon (Cayuela et al 2013, Nelissen et al 2014, Song et al 2016a). In particular, biochar amendment can change soil biological community composition and its abundance (Kim et al 2007, O'Neill et al 2009, Grossman et al 2010, Liang et al 2010) and enhance systemic resistance to pathogens and diseases (Lu et al 2015). However, even after a sustained research effort, we still do not have a comprehensive understanding on how soil microbial communities in subtropical plantations respond to biochar amendment and biochar combined with N deposition, especially in Moso bamboo (Phyllostachys edulis) plantations. This information is needed to improve soil quality and develop sustainable forestry by using proper soil amendments, given the increasing deposition of atmospheric N.
Moso bamboo grows rapidly (Li et al 1998, Zhou et al 2010, Song et al 2016b) and is the most important source of non-wood forest products in China. The area covered by Moso bamboo plantations has expanded rapidly in subtropical China owing to their substantial ecological and socioeconomic benefits and to sustainable forest development policies (Song et al 2011). The area with the greatest distribution of Moso bamboo plantations coincides with the center of the region with the greatest current N deposition in China; this rate of N deposition is predicted to remain high in the future (Reay et al 2008, Song et al 2015). Our previous studies of Moso bamboo plantations showed that N deposition decreased both soil pH and microbial diversity but increased soil microbial biomass carbon (MBC) (Li et al 2016). To offset the negative effects of N deposition on Moso bamboo plantations, biochar was applied to Moso bamboo plantations that had received simulated N deposition for 21 months. We examined the interaction of biochar amendment and N deposition on soil microbial quantity, community composition, and diversity. The aim of this study was to test three hypotheses: (1) biochar amendment increases soil MBC and bacterial diversity; (2) biochar amendment mitigates the effects of N deposition on soil MBC and bacterial diversity; and (3) mitigation depends on the level of biochar amendment.
2. Materials and methods
2.1. Biochar characterization
Biochar was produced by pyrolysis of Moso bamboo chips at 600 °C (Yaoshi charcoal industry Company, Hangzhou, China). The main characteristics of the biochar were: pH (H2O) = 9.67; bulk density = 0.53 g cm−3; cation exchange capacity (CEC) = 14.9 cmol kg−1; carbon content = 81.73%; N content = 0.57%; and C/N ratio = 143.4.
2.2. Study site
The study site was in Qingshan Town, Lin'an City (30°14'N, 119°42'E), Zhejiang Province, China, which has a monsoonal subtropical climate. The mean annual precipitation is 1 420 mm, and the mean annual temperature is 15.6 °C, with maximum and minimum temperatures of 41.7 °C and −13.3 °C, respectively. The area receives an average of approximately 1 847 h of sunshine per year and an average of 230 frost-free days per year.
The Moso bamboo plantations in the study site are intensively managed, and are subjected to annual fertilization (67.5 kg N, 11.8 kg P, and 74.7 kg K ha−1), artificial ploughing, and weeding. There are 11 understory plant species, dominated by Viola prionantha, with a mean height of 0.1 m, forest floor coverage of 5%, and total herbal biomass of 14.6 kg ha−1. The soils are classified as Ferrisols derived from granite (Song et al 2015).
Table 1. Original surface soil (0–20 cm) characteristics of study plots in the Moso bamboo plantation (mean ± SD, n = 3).
| Treatment | SBD (g cm−3) | SOM (mg g−1) | TN (mg g−1) | TP (mg g−1) | pH |
|---|---|---|---|---|---|
| Control | 0.97 ± 0.07 | 23.73 ± 0.24 | 1.11 ± 0.04 | 0.52 ± 0.01 | 4.46 ± 0.01 |
| N30 | 0.98 ± 0.04 | 22.56 ± 1.17 | 1.17 ± 0.09 | 0.57 ± 0.05 | 4.43 ± 0.04 |
| N60 | 1.00 ± 0.05 | 23.15 ± 1.74 | 1.21 ± 0.12 | 0.54 ± 0.03 | 4.48 ± 0.08 |
| N90 | 0.94 ± 0.03 | 25.34 ± 2.16 | 1.13 ± 0.06 | 0.56 ± 0.03 | 4.42 ± 0.06 |
SBD, soil bulk density; SOM, soil organic matter; TN, total N; TP, total P.
2.3. Experimental design and soil sampling
In November 2012, 12 plots of 20 × 20 m were established in the Moso bamboo plantations. In accordance with the local background N deposition of 30–37 kg N ha−1 yr−1 (Xie et al 2008, Cui et al 2014) and the widely used method to double and triple the local deposition rate, to simulate additional N deposition (Song et al 2015), these treatments included (1) low N, 30 kg N ha−1 yr−1 (N30); (2) medium N, 60 kg N ha−1 yr−1 (N60); (3) high N, 90 kg N ha−1 yr−1 (N90); and (4) N-free condition (control). Three replicate plots per treatment were established. The original surface soil characteristics of the study plots are shown in table 1. Beginning in January 2013 and each month thereafter, quantitative NH4NO3 was dissolved into 10 L of water and then sprayed evenly onto the ground of each plot for a total of 12 equal applications over the entire year. A more detailed description of the N treatment is given in Song et al (2015). In September 2014, (at 21 months of N addition treatment), two subplots of 10 × 10 m were established in each N deposition plot and the control plot. Each subplot was isolated using a plastic panel with a depth of 1 m, to avoid disturbing the nearby area. The two subplots were amended once with either 20 t ha−1 biochar (BC20) or 40 t ha−1 biochar (BC40). Biochar was applied via top soil incorporation (Verheijen et al 2009): biochar was homogenously spread across the plot and then ploughed in, to mix well with the top 30 cm of soil. All plots still received the quantitative N addition monthly as described above.
In July 2015, ten soil cores (0–20 cm depth) were collected randomly using a soil auger (3.5 cm) from each subplot, mixed until homogenized, and transported to the laboratory in an incubator. The samples were sieved through a 2 mm sieve, and subsamples were stored at -80 °C until further molecular analysis. The remaining subsamples were used to determine the MBC and the physicochemical properties of the soil.
2.4. Soil physiochemical properties and microbial biomass determination
Soil pH was measured using a pH meter (FE20, Mettler Toledo, Switzerland) after preparing a soil:water (1:2.5 w v−1) suspension by shaking for 30 min (Bao 2008). The soil organic carbon (SOC) and total nitrogen (TN) in the extracts was determined using an elemental analyzer (ElementarVario EL III, Germany). Available phosphorus (AP) was analyzed using the molybdenum blue method (Watanabe and Olsen 1965). NO3− and NH4+ were extracted using 2 M KCl, steam distillation, and titration (Mulvaney 1996). MBC was estimated using the chloroform fumigation-extraction method (Vance et al 1987).
2.5. DNA extraction and library construction
High-throughput sequencing of DNA from the soil samples was used to identify the species present and the functional diversity of microbial populations; this method provides a more detailed description of microbial communities than traditional methods, such as cloning libraries (Roesch et al 2007).
Total DNA was extracted from 0.25 g of soil using the Ezup Column Soil DNA Purification Kit (Sangon Biotech, Shanghai, China) according to the manufacturer's instructions. DNA concentrations were then determined using a Nano Drop ND-1000 UV-Vis spectrophotometer (Thermo Scientific, Rockwood, TN, USA).
2.6. 16S rRNA gene amplification, sequencing, and bioinformatics analysis
The V4 hypervariable regions of bacterial 16S rRNA genes were selected for amplification using the primer pair 515 f/806r (Zhou et al 2015). PCR conditions and products were as described previously (Li et al 2016). The 16S rRNA amplicons were sequenced using the Illumina Miseq platform at Novogene (Beijing, China).
Sequence analysis was carried out using the software QIIME (Quantitative Insights into Microbial Ecology) as described by Fadrosh et al (2014). Briefly, sequence reads were extracted, primers were removed, and the sequences were trimmed to remove low quality sequences. The trimmed and unique sequences were used to define the number of operational taxonomic units (OTUs) at the 97% similarity level. Shannon and Simpson diversity indices and Chao1 and ACE richness estimators were calculated using the open-source software mothur (Schloss et al 2009) to estimate bacterial diversity and richness.
2.7. Statistical analysis
Differences in the concentrations of MBC and in the Shannon index among treatments were tested using one-way analysis of variance (ANOVA) and post-hoc multiple comparisons were conducted using the Bonferroni method. The combined effect of N deposition and biochar amendment on MBC and diversity was examined using two-way ANOVA and the Bonferroni test. The relationship between soil properties and α-diversity was investigated using Pearson correlation coefficients. Data analyses were conducted using SPSS v 18.0 for Windows (SPSS Inc., Chicago, Illinois).
Principal coordinate analysis and the unweighted pair group method with arithmetic mean (UPGMA) clustering were conducted on the weighted UniFrac based on a previously published protocol (Kuczynski et al 2012). In addition, multiple correlations between environmental variables (SOC, TN, C/N rate, AP, NO3−, NH4+, and pH) and community composition were analyzed using a redundancy analysis in Rv.2.8.1 with the vegan package.
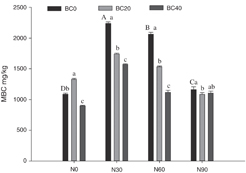
Figure 1. Contents of soil microbial biomass carbon (MBC) under biochar amendment (BC0, 0 t biochar ha−1; BC20, 20 t biochar ha−1; BC40, 40 t biochar ha−1) and N addition treatments (N0, 0 kg N ha−1 yr−1; N30, 30 kg N ha−1 yr−1; N60, 60 kg N ha−1 yr−1; N90, 90 kg N ha−1 yr−1) (mean ± standard deviation, n = 3). Different capital letters indicate significant differences among N addition rates under BC0. Different lowercase letters indicate significant differences among biochar amendments at identical N addition rate.
Download figure:
Standard image High-resolution image3. Results
3.1. Soil microbial biomass carbon
Compared with the control, soil MBC was 22.3% higher in the BC20 treatment and 17.5% lower in the BC40 treatment (P < 0.05) (figure 1). In plots without biochar amendment, MBC was significantly higher in the N addition (N30, N60, and N90) treatments than in the control. Soil MBC was significantly lower in the combined N addition (N30 and N60) and biochar amendment (BC20 and BC40) treatments than in the N addition treatments alone (P < 0.05). MBC did not significantly change in the combined N90 and BC20 or BC40 treatments compared with that in N90 treatment alone (P > 0.05). Soil MBC was significantly higher in the combined BC20 and N30 or N60 treatments than in the combined BC40 and N30 or N60 treatment (P < 0.01). A two-way ANOVA showed biochar amendment and N addition significantly affected soil MBC, both independently and in combination (P < 0.001) (table S1 available at stacks.iop.org/ERL/13/044029/mmedia).
3.2. Soil microbial community composition
More than 38 000 valid reads were obtained for each replicate treatment. The median sequence length of each read was 253 bp. A total of 59 352 OTUs was detected using 97% identity as the cutoff, representing 45 phyla and 470 genera. At the phylum level, the dominant phyla were Proteobacteria (38.6%), Acidobacteria (23.4%), Actinobacteria (8.3%), and Verrucomicrobia (7.6%) (figure 2). Twenty-six phyla occurred with relatively low abundance and accounted for less than 1% of the total. At the genus level, the dominant genera were Acidibacter (3.6%), Candidatus Nitrosotalea (2.6%), Acidothermus (2.6%), Rhizomicrobium (2.3%), and Sphingomonas (2.2%).
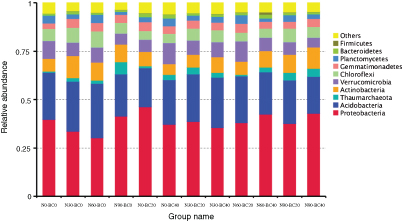
Figure 2. Comparison of the soil bacterial communities at the phylum level in the Moso bamboo plantations under all treatments. The relative abundance of the dominant bacterial groups in the soil differed depending on the N addition and biochar amendment. Relative abundance values are based on the proportional frequencies of DNA sequences that could be classified. N0, 0 kg N ha−1 yr−1; N30, 30 kg N ha−1 yr−1; N60, 60 kg N ha−1 yr−1; N90, 90 kg N ha−1 yr−1; N0-BC20, 0 kg N ha−1 yr−1 with 20 t biochar ha−1; N0-BC40, 0 kg N ha−1 yr−1 with 40 t biochar ha−1; N30-BC20, 30 kg N ha−1 yr−1 with 20 t biochar ha−1; N30-BC40, 30 kg N ha−1 yr−1 with 40 t biochar ha−1; N60-BC20, 60 kg N ha−1 yr−1 with 20 t biochar ha−1; N60-BC40, 60 kg N ha−1 yr−1 with 40 t biochar ha−1; N90-BC20, 90 kg N ha−1 yr−1 with 20 t biochar ha−1; N90-BC40, 90 kg N ha−1 yr−1 with 40 t biochar ha−1.
Download figure:
Standard image High-resolution imageIn the N-free conditions, the relative abundance of Acidobacteria and Chloroflexi was lower in the BC20 and BC40 treatments than in the control, whereas Gemmatimonadetes and Thaumarchaeota exhibited the opposite trends. The relative abundance of Proteobacteria and Actinobacteria was higher in the BC20 treatment than in the control, but was lower in the BC40 treatment. In the no-biochar-amendment condition, N addition increased the relative abundance of Crenarchaeota and Actinobacteria but decreased the relative abundance of Proteobacteria.
The relative abundance of Proteobacteria was higher in the combined N addition (N30 and N60) and biochar amendment (BC20 and BC40) treatments than in the N addition treatments alone, whereas Actinobacteria and Gemmatimonadetes exhibited the opposite trends. The relative abundance of Proteobacteria and Verrucomicrobia was higher in the combined N90 and BC20 than in the N90 treatment alone, whereas it was lower in the combined N90 and BC40 treatment. The relative abundance of Actinobacteria was higher in the combined N90 and BC20 or BC40 treatments than in the N90 treatment alone, whereas Gemmatimonadetes exhibited the opposite trend. The relative abundance of Acidobacteria in combined N addition (N30, N60, and N90) and biochar amendment (BC20 and BC40) treatments was different from that in the N addition treatments alone.
The relative abundance of Proteobacteria was higher in the combined BC20 and N-free or N30 treatments than in the combined BC40 and N-free or N30 treatments, whereas Acidobacteria abundance showed the opposite trend. The relative abundance of Acidobacteria was higher in the combined BC20 and N60 or N90 treatments than in the combined BC40 and N60 or N90 treatments, whereas Proteobacteria abundance showed the opposite trend. The relative abundance of Actinobacteria was lower in the combined BC20 and N addition treatments than in the combined BC40 and N addition treatments.
3.3. Soil bacterial diversity
The Shannon index in the BC20 and BC40 treatment was significantly higher than in the control (P < 0.05). In the no-biochar-amendment condition, N addition significantly decreased the Shannon index (P < 0.05), particularly in the N60 treatment. The Shannon index was significantly higher in the combined N addition (N30, N60, and N90) and biochar amendments (BC20 and BC40) treatments than in the N addition treatments alone (figure 3).
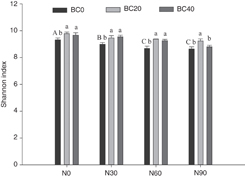
Figure 3. Shannon index of soil microbial diversity under different biochar amendments (BC0, 0 t biochar ha−1; BC20, 20 t biochar ha−1; BC40, 40 t biochar ha−1) and N addition treatments (N0, 0 kg N ha−1 yr−1; N30, 30 kg N ha−1 yr−1; N60, 60 kg N ha−1 yr−1; N90, 90 kg N ha−1 yr−1) (mean ± standard deviation, n = 3). Different capital letters indicate significant differences among N addition rates under BC0. Different lowercase letters indicate significant differences among biochar amendments at identical N addition rate.
Download figure:
Standard image High-resolution imageA cluster analysis of the similarity of the soil microbial communities showed two groups of bacterial communities (figure 4). N60-BC20, N0-BC40, N60-BC0, N30-BC0 and N0-BC0 treatments clustered into group I, and the other N addition treatments clustered into group II, irrespective of biochar amendment. This clustering was further confirmed by a principal coordinate analysis (figure S2). The combination of N addition and biochar amendment accounted for 46.73% of the variation in microbial community structure; N addition accounted for 28.56% of the variation, and biochar amendment accounted for 18.17%. Two-way ANOVA showed biochar amendment and N addition significantly affected soil bacterial diversity independently and in combination (P < 0.05) (table S1).
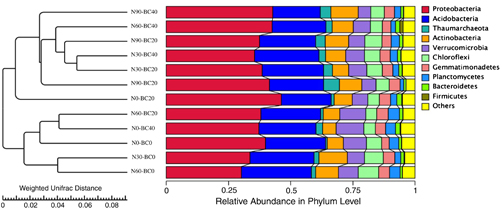
Figure 4. UniFrac UPGMA cluster analysis of microbial communities in different soil samples from Moso bamboo plantations under different N addition and biochar amendment treatments. The figure was constructed based on Illumina sequencing data.
Download figure:
Standard image High-resolution image3.4. Relationships between bacterial diversity and soil properties
Soil properties are provided in figure S1. The relationships between the α-diversity of the soil microbes and soil properties are shown in table 2. The Shannon index was significantly, positively correlated with pH, and significantly and negatively correlated NH4+ concentrations (P < 0.05). The Shannon and Chao1 indices were significantly and negatively correlated with SOC, C/N ratio and AP concentrations (P < 0.05). The soil MBC was significantly and positively correlated with C/N ratio and AP concentrations (P < 0.05).
Table 2. Pearson correlation coefficients between soil properties and soil microbial biomass carbon (MBC) and bacterial diversity.
| pH | SOC | TN | C/N | AP | NO3− | NH4+ | |
|---|---|---|---|---|---|---|---|
| Shannon | 0.484b | −0.329a | 0.275 | −0.403a | −0.49a | −0.141 | −0.422a |
| Chao1 | 0.27 | −0.345a | 0.383a | −0.448a | −0.553b | 0.059 | −0.236 |
| MBC | −0.305 | 0.251 | −0.325 | 0.403a | 0.367a | −0.113 | −0.018 |
SOC, soil organic carbon; TN, total nitrogen; AP, available phosphorus. aP < 0.05 bP < 0.01.
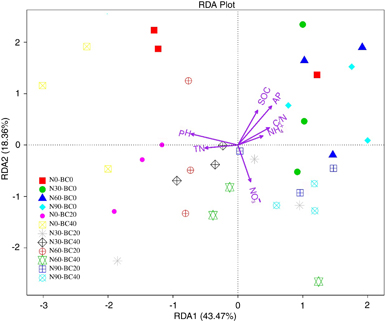
A redundancy analysis was used to analyze the correlation of the main soil properties and the microbial community (figure 5). Of the evaluated attributes, AP, pH, and NO3−concentrations were significant conditional effects, while NH4+, C/N ratio, TN, and SOC concentrations had indicative effects on the community.
Figure 5. Redundancy analysis of the relative abundance of dominant microbial and soil environmental factors. The soil factors indicated in red text include pH, SOC (soil organic carbon), TN (total nitrogen), AP (available phosphorus), NH4+, NO3−, and C/N ratio. The length of a soil property arrow indicates the strength of the relationship between the soil property and the overall microbial community.
Download figure:
Standard image High-resolution image
4. Discussion
4.1. Effects of biochar amendment
Our results demonstrated that biochar amendment significantly increased microbial diversity, moderate biochar amendment (20 kg ha−1) significantly increased the soil MBC, but higher levels of biochar amendment (40 kg ha−1) significantly decreased MBC. These results partially support our first hypothesis that biochar amendment increases soil MBC and bacterial diversity. Some studies have reported that soil microbial diversity is closely correlated to soil pH (Nicol et al 2008, Lauber et al 2009). Our results here also suggested that pH was significantly and positively correlated with soil bacterial diversity, which was higher after biochar amendment relative to the control (figure S1(g)). This conclusion is supported by previous studies that Anthrosols typically have higher pH and microbial diversity relative to adjacent soils in the Brazilian Amazon (O'Neill et al 2009). Some studies found that SOC was significantly and positively correlated with soil MBC (Chen et al 2011, Zhou et al 2014). However, a Pearson correlation analysis showed that MBC was not significantly or positively correlated with SOC (P > 0.05) but was significantly and positively correlated with C/N ratio. We found that SOC and C/N ratio significantly decreased after biochar amendment relative to the control (P < 0.05) (figures S1(a) and (c)), which supported the interpretation that BC40 significantly decreased MBC. It has also been reported that biochar amendment can decrease soil MBC (Lehmann et al 2011, Dempster et al 2012). For example, Dempster et al (2012) found that soil MBC decreased with increasing rate of addition of jarrah (Eucalyptus marginata) wood biochar, possibly as biochar input decreased the mineralization rate of the SOC. However, our results did not explain why BC20 increased soil MBC. We speculate that addition of soil MBC is related to other physiochemical properties of soil and unique properties of biochar. For example, the nutrients in the biochar components (abundant K) may have provided an energy source for microorganisms (Pietikäinen et al 2000, Watzinger et al 2014). Previous studies also indicated that the large surface area and porous structure of biochar create a favorable habitat for microbial colonization (Pietikäinen et al 2000, Ezawa et al 2002, Saito and Marumoto 2002, Luo et al 2013). Kolb et al (2009) found that charcoal addition improved the soil surface area, promoted soil microbial growth, and thus significantly increased soil microbial biomass and activity. Zavalloni et al (2011) also observed that biochar absorbed toxic and harmful substances in the soil, indirectly increasing soil MBC. In addition, biochar also improved the water holding capacity and CEC (Warnock et al 2007, Wang et al 2012, Maestrini et al 2014, Perry et al 2015). These alterations to soil biochemical reaction conditions stimulated soil enzyme activities, produced more chemicals (Lee et al 2010), and promoted the growth and reproduction of soil microorganisms, thereby improving soil MBC (Wu et al 2015). This suggests that the effects of biochar amendment on soil microbes are controlled by multiple environmental factors and that the direction and magnitude of the effects depend on the biochar amendment rate.
The relative abundance of Proteobacteria and Actinobacteria was higher in the BC20 treatment than in the control and BC40, whereas Acidobacteria had a lower abundance. This demonstrated that biochar amendment altered soil microbial composition in Moso bamboo forests, which concurs with Khodadad et al (2011) and Perry et al (2015). Jaiswal et al (2017) observed a significant decrease in Acidobacteria abundance in the biochar-enriched soil rhizosphere. Acidobacteria generally prefer oligotrophic environments and lower pH soils; therefore, it is possible that the reduction in Acidobacteria was a response to the biochar-related shift to a more neutral and copiotrophic environment (Jaiswal et al 2017). Xu et al (2014) found that biochar amendment in an acidic soil (pH 4.48) changed the relative abundance of some microbes that are related to C and N cycling. Sun et al (2016) showed that the relative abundance of Actinobacteria in biochar pellets was higher than that in adjacent control soils. In general, Actinobacteria (especially Actinomycetales) can depolymerize polyphenols in leaf litter, converting them into small soluble molecules; thus, they play an important role in the decomposition of organic matter (Zhao et al 2015, Dai et al 2017). The effects of biochar amendment on soil microbial community structures are complex and variable, and are closely related to time, and types and rates of biochar amendment and soil properties (Wu et al 2015, Dai et al 2017).
4.2. Interaction of biochar amendment and N deposition
N addition alone (30, 60, or 90 kg N ha−1 yr−1) significantly increased soil MBC but significantly decreased soil bacterial diversity (figures 1 and 3). After BC20 and BC40 amendment, MBC decreased by 6.9%–25.7% and 5.1%–45.8%, respectively, compared with N addition treatments alone. Moreover, the significant positive effects of N addition on MBC disappeared after biochar amendment of N90 plots. This could be explained by a decreased C/N ratio and SOC in the combined N addition (N30 and N60) and biochar amendment (BC20 and BC40) treatments relative to the N addition treatments alone (figure S1(a) and (c)). In addition, biochar amendment reversed the reduction in soil microbial diversity caused by N addition (figure 3). One possible explanation may be that biochar created a favorable habitat for microbial colonization due to the large surface area and porous structure of biochar and its physicochemical properties, such as alkalinity, which might improve pH, water holding capacity and CEC (Jaafar et al 2015). These results support our second hypothesis by suggesting that biochar amendment could offset the positive effects of N deposition on MBC and the negative effects on bacterial diversity. Biochar amendment of N addition plots did not significantly change the dominant microbial phyla. The reason for this may be that N addition had a greater effect on soil microbial composition than biochar amendment, which had been ongoing at the study site for 21 months prior to the biochar amendment experiment, whereas the biochar amendment was conducted only for 10 months. The cumulative effects of biochar amendment on soil microbes may not have been evident in the short duration of the experiment.
MBC was significantly higher after BC20 amendment of N30 and N60 soils compared to the BC40 amendment of these soils, indicating that the higher biochar amendment rate resulted in a stronger mitigating effect. This finding supports our third hypothesis. One possible reason for this effect is that biochar amendment changes the soil environment in a dose-dependent manner (Dempster et al 2012). Although the microbial components varied under the combined biochar and N treatments, external characteristics were less variable compared with MBC.
4.3. Relationship between microbial diversity and soil properties
Previous studies observed that soil microbial community structure and microbial diversity were closely correlated to soil pH (Nicol et al 2008, Lauber et al 2009, Kuang et al 2013). Our results here also demonstrated that the bacterial diversity and community composition were correlated with soil pH. The bacterial community composition was mainly correlated with AP and NO3− concentrations. Zhao et al (2014) also observed that Betaproteobacteria and Chloroflexi are positively correlated with soil AP content. Belén et al (2014) reported that the bacterial community structure is closely correlated with the NO3− concentration, whereas Zhou et al (2015) found that nitrate concentration might shape microbial communities in cultivated black soils.
Changes in microbial community structure might influence microbial diversity (Fang and Mo 2006). In this study, the C/N ratio affected microbial community structure and, thus, were significantly correlated with bacterial diversity. A similar result was reported by Zhou et al (2015). Chu et al (2010) observed that the C/N ratio is significantly correlated with the relative abundance of dominant phyla in Arctic tundra soils, consistent with the abundance and composition of soil bacterial communities in the Changbai Mountains (Shen et al 2013). Our results indicate that C/N ratio and AP concentration are the key controlling factors for MBC, while pH, C/N ratio, and AP concentration are the key controlling factors for diversity and composition of microbial communities in Moso bamboo forest.
5. Conclusions
In the N-free treatment, biochar amendment at a low dose (20 t ha−1) significantly increased soil MBC and bacterial diversity, while a high dose amendment (40 t ha−1) significantly decreased soil MBC but significantly increased bacterial diversity in Moso bamboo plantations. In the N-deposition treatments, low-dose biochar amendment combined with N addition significantly decreased soil MBC and increased soil bacterial diversity compared with the N-only treatment, and the high dose biochar amendment combined with N addition. Biochar amendment largely offset the positive effects of N deposition on soil MBC and the negative effects on soil microbial diversity, although the effect depended on N deposition and biochar amendment rates. Soil bacterial diversity was significantly related to soil C/N ratio, pH, and AP content. Our study provides support for the use of biochar as a soil amendment to mitigate the effects of N deposition on soil microbial biomass and diversity in Moso bamboo plantations. The effects of biochar amendment on fungal community structure and diversity under atmospheric N deposition need further study.
Acknowledgments
This study was funded by the National Natural Science Foundation of China (grant numbers 31470529 and 31270517).