

Abstract
The equatorial island of Borneo is a deforestation hotspot. However, the influence of forest loss on the island's climate remains largely unexplored. Here, we examine how forest loss is related to changes in ground-based records of temperature (1961–2007) and precipitation (1951–2007), and MODIS data for temperature (2002–2016). Analyses were performed for the entire island, lowland areas (<200 m ASL), and nine selected watersheds. We found a strong island-wide relationship between forest loss and increases in daily temperature and reductions in daily precipitation. The relationship between deforestation and changes in local climate was most pronounced for watersheds in southeast Borneo, which have lost 40%–75% of their forests since 1973. These watersheds also had a significantly higher frequency of temperatures above 31 °C. Watersheds in north and northwest Borneo, which have lost 5%–25% of their forest cover, maintained a more stable climate with a similar distribution of mean and extreme warm temperatures between forest and modified forest areas. Watersheds with >15% forest loss had a >15% reduction in rainfall. We conclude that loss of forest in Borneo has increased local daily temperatures and temperature extremes, and reduced daily precipitation.
Export citation and abstract BibTeX RIS

Original content from this work may be used under the terms of the Creative Commons Attribution 3.0 licence.
Any further distribution of this work must maintain attribution to the author(s) and the title of the work, journal citation and DOI.
1. Introduction
To date, most of the climate change discourse has focused on the warming effects of carbon dioxide and other greenhouse gases released into the atmosphere (IPCC 2014). However, in many regions, the climate-related impact of forest loss may be of a similar magnitude to the warming effects of greenhouse gases (McAlpine et al 2010, Pielke et al 2011, Pielke et al 2016). Forest cover influences land-surface processes, including evapotranspiration, albedo and surface roughness, which affect the magnitude and form of energy transfer to the atmosphere (Bonan 2008, Jackson et al 2008). By altering the fluxes of heat, momentum and moisture exchanges between the land surface and the lower atmosphere, forests affect the regional climate (Syktus and McAlpine 2016). In tropical regions, forests increase the ratio of latent heat to sensible, which increases moisture recycling, cloud formation and convective precipitation. In recent decades, tropical deforestation in the Amazon Basin, Congo Basin and Southeast Asia has been has been of global concern (Hansen et al 2013).
The South-east Asian island of Borneo is a deforestation hotspot (Hansen et al 2013). Over the past century, human activities have dramatically changed the landscape of Borneo. In the 1930s, an estimated 75% of Borneo was covered in tropical forests (van Steenis 1935); however, the remaining forest cover is now estimated at approximately half of the original extent (Brookfield and Byron 1990, Curran et al 2004, Langner et al 2007, Gaveau et al 2014b). These changes have been fuelled by the global demand for timber, expanding oil palm and rubber industries, growth in small-holder agriculture and repeated forest fires (Gaveau et al 2014a). Industrial oil palm and timber plantations are now estimated to cover at least 10% of Borneo (Gaveau et al 2014b, Gaveau et al 2016), with Indonesia as a whole accounting for ∼54% of total global oil palm production (Smit et al 2013). From the mid-1970s to the 1990s, at least half the world's total exports of tropical hardwoods were from Borneo (Brookfield and Byron 1990). Furthermore, the extensive drainage of Borneo's peat swamp forests for plantation development increases their susceptibility to fire (Page et al 2002, Gaveau et al 2009), with important implications for regional air quality (Gaveau et al 2014a).
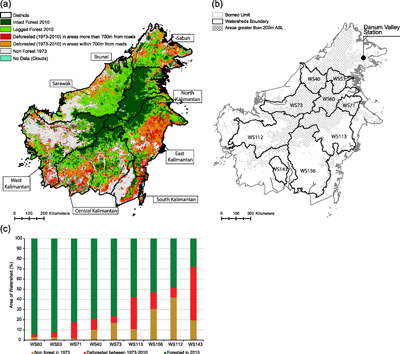
Figure 1. Study region of the island of Borneo showing: (a) Land use and land cover changes for Borneo between 1973 and 2010 (Gaveau et al 2014b) and names of administrative districts; (b) boundaries of the watersheds used in the analysis; and (c) proportional forest cover of study watersheds showing non-forest areas 1973 (orange color), intact forest cover in 2010 (green colour); and areas which were deforested between 1973–2010 (calculations based on Gaveau et al 2014b).
Download figure:
Standard image High-resolution imagePrecipitation and temperature data indicate that Borneo's climate has changed over recent decades (Kumagai et al 2013). Analyses of maximum and minimum temperatures from 1980–2002 for 33 weather stations across Indonesia found a significant rise in maximum and minimum temperatures in most stations (MoE 2007). A study in Sabah, Malaysia, found primary forest was up to 2.5 °C cooler than selectively logged production forest and up to 6.5 °C cooler than oil palm plantations (Hardwick et al 2015). Kumagai and Porporato (2012) postulated a relationship between Borneo's forest loss, temperature increase and precipitation decline. However, the spatial and temporal nature of this relationship deserves more detailed attention.
Here, we examined the relationship between changes in forest cover and observed changes in daily temperature and precipitation over Borneo. We investigated how the conversion of forest has influenced daily temperature and precipitation and their variability. We addressed this question using interpolated historical gridded (0.25° spatial resolution) daily temperature (1961–2007) and precipitation (1951–2007) data. The analysis focus was on the entire island and for nine selected watersheds (figure 1). In addition, we also analysed land surface temperature from satellite observations derived from MODIS for the period 2002–2016 for lowland areas <200 m ASL.
2. Data and methods
2.1. Study area
Borneo (743 000 km2) is governed by three countries: Malaysia (Sarawak and Sabah), Indonesia (West, Central, South, East, and North Kalimantan), and the sovereign state of Brunei 'Negara Brunei Darussalam' (figure 1(a)). Borneo had 558 000 km2 of natural and near natural forest cover in 1973 (Gaveau et al 2014b). By 2010, 168 500 km2 had been cleared or degraded. This represents a decrease in total forest cover from 75.7% in 1973 to 52.8% in 2010. Between 2010 and 2015, an additional 18 500 km2 of forest was lost (Gaveau et al 2016). The majority of deforestation has occurred in the coastal lowlands (<200 m ASL) largely due to greater accessibility and the suitability of the land for agriculture and industrial plantations. Logging is also an important driver of land cover change that has progressed inland from the lowlands into higher elevations over recent decades (Gaveau et al 2016). In 2015, only 27.8% of Borneo's land cover was classified as intact forest (i.e. without any commercial timber removal) while approximately 12.5% consisted of industrial plantations (Gaveau et al 2016).
2.2. Land cover change data
Land cover maps for the period of 1973–2010 were derived from Gaveau et al (2014b) who developed a baseline map of forest cover for 1973 using LANDSAT multi-spectral imagery and a forest cover map for 2010 derived from ALOS PALSAR (Advanced Land Observing Satellite, Phased Array type L-band Synthetic Aperture Radar) radar satellite imagery. LANDSAT imagery also captured areas of forest conversion to industrial oil palm and timber plantations. For our analyses, land cover categories based on Gaveau et al (2014b) were aggregated to determine the total area of predominantly intact forest cover and modified forest cover (table 1) for the whole of Borneo. This analyses was repeated for nine selected watersheds (figure 1(b)) distributed across the Indonesian provinces of East Kalimantan (N = 4), Central Kalimantan (N = 2), West Kalimantan (N = 1) and Sarawak–Brunei (N = 2).
Table 1. Description of intact forest and modified forest land cover classes used in the analyses. Classes are derived from Gaveau et al (2014b) and Miettinen et al (2016).
| Class | Description |
|---|---|
| Intact forest | Peat swamp forest, mangrove forest, nipah mangrove forest, lowland evergreen forest, lower montane evergreen forest, upper montane evergreen forest, riverine forest, closed and pole forest |
| Modified forest | Regrowth/secondary forests with <60% canopy cover, logged forests, industrial timber plantations, oil palm plantations, agricultural areas, urban |
2.3. Gridded datasets
2.3.1. Climate data sources
Weather observation stations in Borneo are sparsely distributed. For this reason, we used climate data sourced from the APHRODITE (Asian Precipitation—Highly Resolved Observational Data Integration Towards Evaluation of Water Resources) precipitation (V1101) and temperature (V120R2) interpolated data products (Yatagai et al 2012). APHRODITE provides a gridded dataset of daily precipitation (1950–2007) and daily temperature (1961–2007) at a 0.25° resolution for monsoonal Asia (60°E–155°E, 15°S–55°N). The APRHODITE project ceased in December 2007.
The station data used in constructing the gridded APHRODITE dataset were screened by Hamada et al (2011) to identify and remove errors in: metadata, repetition of constant values that are unlikely to have occurred naturally, contamination with different weather elements, values exceeding national and regional records, duplication of monthly and sub-monthly records, outliers, inhomogeneity within the time series, errors in the units of measurement, and ambiguous time sampling information. Many of the Borneo's weather stations used to derive the interpolated dataset were located in lowland areas that had undergone deforestation (appendix 1 available at stacks.iop.org/ERL/13/044009/mmedia). For example, 79% of the weather stations (i.e. 50 out of 63 stations) that were included in the interpolation of the APHRODITE precipitation product were located in grid cells that had <50% forest cover in 2010.
The APHRODITE gridded climate data were designed to be used in hydrological modelling and the validation of high-resolution climate simulations (Kumagai et al 2013, Yatagai et al 2012). The complex procedure in developing the data paid special attention to the impact of topographic features such as leeward of high ridge and slope-aspect on interpolated rainfall and temperature. APHRODITE applied the Sheremap (Willmott et al 1985) and Mountain Mapper (Schaake et al 2004) interpolation procedures to increase that accuracy of the interpolation. Unlike many interpolated climatological products, APHRODITE products apply daily weightings that vary according to rainfall distribution, which better reflects the orographic patterns of a landscape. They employ an interpolation method for precipitation based on the ratio between daily precipitation and the daily climatology. This approach is considered to improve the quantitative estimation of monthly rain gauge-based precipitation products (Yatagai et al 2012). The interpolation of daily temperatures adopted a similar approach with a distance weighting function based on the Sheremap algorithm employed to interpolate the corrected temperature onto a 0.05 decimal degrees grid. The mean daily precipitation and temperature values were then calculated for each 0.5 decimal degree grid cell, and then averaged across all the grid cells within a watershed for the different periods.
2.3.2. Comparison of APHRODITE Data with Danum Valley station
To assess the accuracy of the APHRODITE products within Borneo (sensu Ali et al 2012), we used linear regression to assess the relationship with a long-term station records from the Danum Valley Field Research Station (figure 1(b)). The coefficient of determination was calculated for both the mean monthly daily temperature and mean monthly precipitation data. In general, the APHRODITE data closely replicated the general trends observed in the Danum Valley time series data (appendix 2), although the absolute values were consistently lower for the APHRODITE data set. The mean monthly daily temperature values were closely correlated (R2 = 0.955) while the mean monthly precipitation also showed a strong linear relationship (R2 = 0.615).
2.3.3. MODIS land surface temperature dataset
We used the MODIS MYD11A1 and MOD16 datasets from July 2002 to December 2016 to estimate the differences in monthly mean surface temperature for forest and modified forest areas. The comparison was undertaken for all lowland areas of Borneo (identified from the digital elevation model as below 200 m ASL), where most of the historical and contemporary deforestation has occurred (Gaveau et al 2016). MODIS data was aggregated for the land cover classes based on the Miettinen et al (2016) land cover mapping. All analyses were performed for MODIS data for cloud-free days at 1 km spatial resolution. For the 2002–2016 period, on average 26% of all observed pixels below 200 m ASL were cloud-free for the dry season (JASO) and on average 28% for the El Niño years. For this reason, we included all MODIS temperature values and not just high-quality values. The analysis focused on characterizing the temperature contrast between intact forest and modified forest over the whole lowland area of Borneo and for the nine watersheds (figure 1(b)). We show the results for the temperature contrast for the dry season months of July–October (JASO, Fernandes et al 2017) and for El Niño years (2002, 2004, 2009, 2015 and 2016) which are typically associated with dry and hot climate conditions in Borneo.
2.4. Statistical analyses
We analysed the interpolated historical climate data at two scales: the entire island, and for the nine selected watersheds (figure 1(b)). The APHRODITE grid cell data were assigned to a watershed based on the location of the centre point of each grid cell. We accounted for the impact of El Niño events (which typically cause a reduction in precipitation in Borneo (Mason and Goddard 2001)) using the Ocean Niño Index (ONI), which measures the El Niño-Southern Oscillation (ENSO) in the east-central equatorial Pacific Ocean (Aldrian and Dwi Susanto 2003, Hendon 2003). The running three-month mean sea surface temperature (SST) anomaly for the El Niño 3.4 region (i.e. 5°N–5°S, 120°W–170°W) was used. We define El Niño events as five consecutive overlapping three-month periods at or above a positive 0.5 °C SST anomaly. A second analysis was run excluding years where a moderate (with a 1.0 °C–1.4 °C SST anomaly) or strong (1.5 °C–2 °C SST) event occurred. This exclusion aimed to reduce the influence of the ENSO phenomena on the observed climate trends for Borneo.
The time-series analyses were designed to test for differences in trends for daily precipitation between the 1951–1972 and 1973–2007 periods, and for daily temperature between 1961–1972 and 1973–2007. The division of the time series into these periods corresponded with the mapping of natural forest loss for the period 1973–2010 for the entire island of Borneo (Gaveau et al 2014b). That study estimated forest area had declined by 168 493 km2 or 30.2% from 1973–2010 (figure 1(a)). Our analyses aimed to test if the forest loss after 1973 coincided with changes in daily precipitation and temperature records for each watershed using the gridded APHRODITE datasets.
We conducted linear regression analyses of the daily temperature and precipitation variables for the two periods (for the whole of Borneo and the watersheds) in order to obtain regression coefficients and standard errors. Paternoster et al (1998) proposed the following equation in order to test for a significant difference between the regression coefficients of two slopes:
where b1 is the regression coefficient in the first period and b2 is the regression coefficient in the second period, SEb1 is the standard error of b1 and SEb2 is the standard error of b2. This equation provides a Z score that can be used to determine significance of the difference between two slopes. Based on this analysis, we tested if the rate of change of the climate variable in the first time period is equal to the rate of change of the climate variable in the second time period.
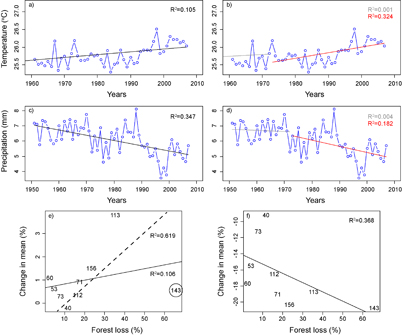
Figure 2. Annually averaged climate trends for Borneo: (a) mean daily temperature for the period of 1961–2007; (b) mean daily temperature comparing two time periods (1961–1972 and 1973–2007); (c) mean daily precipitation for the period of 1951–2007; and (d) mean daily precipitation comparing two time periods (1951–1972 and 1973–2007). Watershed-scale relationships between the percentage changes in annual mean temperature and precipitation before and after 1973 and forest loss (%) for: (e) average daily temperature average (note the dotted line represents the regression with Watershed 143 removed); and (f) mean daily precipitation. Numbers in graphs (e) and (f) correspond to watershed ID.
Download figure:
Standard image High-resolution image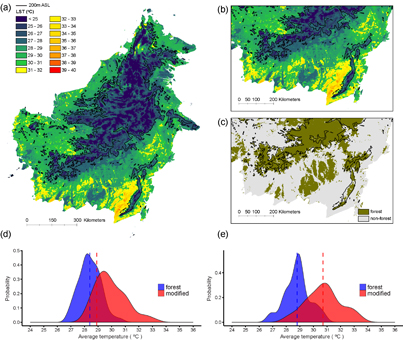
Figure 3. (a) Map of MODIS-derived land surface temperature (LST) for Borneo during the dry season for El Niño years 2002, 2004, 2009 and 2015; (b) more detailed LST map for southern Borneo for the same period; (c) map of the distribution of forest and non-forest land cover for southern Borneo; (d) PDF of the daily temperatures for lowland (<200 m ASL) forest and modified areas during the dry season; (e) PDF of the forest/modified during the El Niño years. Lines on the maps show the 200 m elevation contour. Dashed lines represent mean temperature for each distribution.
Download figure:
Standard image High-resolution imageLinear regression analyses were applied to identify the relationship between forest loss and changes in temperature and precipitation between the two periods at the different spatial scales of analyses. The change in climate means between the two periods (percentage of increase or decrease in values) was tested against the overall proportion of forest loss. This analysis compared the proportion of forest loss with associated changes in temperature and precipitation.
For the MODIS land surface temperature, we calculated the probability density function (PDF) for forest and modified forest areas across Borneo land areas (below 200 m ASL) and for each selected watershed (below 200 m ASL) using the R statistical analysis software (www.r-project.org/). PDF allowed us to investigate the differences in the temperature range distribution between forest and modified areas.
3. Results
3.1. Daily mean temperature changes
Annually averaged daily mean temperature for the whole of Borneo increased at an average of 0.083 °C yr−1 between 1961 and 2007 (figure 2(a), R2 = 0.105, p = 0.026. A reduced, but still significant, increase of 0.009 °C yr−1 (R2 = 0.117, p = 0.045) was observed when El Niño periods were excluded. Mean daily temperature rose significantly faster after 1973 (figure 2(b), R2 = 0.324, p = 0.001) compared to the 1961–1972 period (R2 = 0.001, p = 0.918). The annual average daily mean temperature increase from 1961–1973 to after 1973 was dominated by increases in January to March (∼0.40 °C) (appendix 3(a)) while there was a non-significant decrease in June, July and September (0.02 °C–0.13 °C).
At the watershed scale, there was a general increase in the average daily temperature during the 1973–2007 period relative to 1961–1972 for each month in all watersheds. Watersheds in eastern Borneo yielded the largest and most consistent increase in monthly temperature (WS113, WS156, WS60 and WS71, see appendix 4, all results statistically significant). Watersheds WS40, WS73, WS112 and WS143 (all results not statistically significant) showed a less consistent pattern with smaller monthly increases and some months indicating a small temperature decrease.
Annually averaged mean daily temperature increase for 1973–2007 compared to 1961–1972 is associated with forest loss for the selected watersheds (R2 = 0.106, p = 0.393; figure 2(e)). An exception to the general relationship is WS143 in southern central Borneo, which has lost much of its forest but showed a smaller temperature increase. When this watershed was removed from the analysis, the daily temperature showed a strong linear relationship with (R2 = 0.619, p = 0.021). Watershed 143 is the smallest watershed (14 280 km2) with only one temperature observation station (appendix 1).
3.2. MODIS-derived temperature changes
The PDF for monthly temperatures of the forest and modified land cover classes for lowland areas of Borneo (figure 3) and selected watersheds (figure 4) were derived. Deforested areas of Borneo had higher temperatures than forest areas (figure 3(a)), with the highest temperatures concentrated in southern Borneo (figure 3(b)). We found a marked dry season (JASO) temperature contrast averaging ∼1.7 °C higher for modified forest versus forest while the difference between the tails of the high temperatures was ∼3.0 °C (figure 3(d)). In general, the temperature in forests varied less than in modified land cover areas (figure 3(a)). During El Niño conditions, the temperature differences were greater with averages ∼2.0 °C higher for modified versus forest areas (figure 3(e)). In addition, the PDF for modified land covers had a wider distribution with a higher frequency of temperatures above 31 °C.
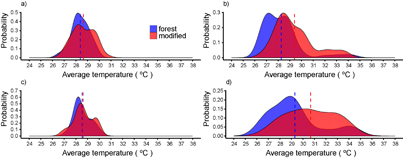
Figure 4. Comparison of the probability distribution of MODIS temperature for the 2002–2016 period. Results are for all lowland areas (<200 m ASL) of watersheds WS40 (low deforestation) and WS143 (high deforestation): dry season (a) WS40 and (b) WS143; El Niño years (c) WS40 and (d) WS143. Dotted lines represent the mean of the distribution.
Download figure:
Standard image High-resolution image
The role of the forest in moderating temperature extremes was further illustrated by comparing watersheds WS40 and WS143 with contrasting levels of forest loss (figure 4). The PDF of the dry-season temperatures over the still largely forested WS40 was similar for forested and modified forested areas, whereas the PDF for the largely deforested WS143 showed a marked temperature contrast (figures 4(a) and (b)). For WS143, the temperature was warmer on average by ∼1.2 °C and with a much higher frequency of monthly temperatures above 30 °C. For the El Niño years (figures 4(c) and (d)), WS40 showed a very small difference in the PDFs for forested and modified areas. In contrast, the highly deforested WS143 with large areas of oil palm plantations had a very broad temperature PDF for modified areas with half the values above 31 °C. Forested areas in this watershed were cooler on average by ∼1.4 °C with more than half the PDF values below 29 °C. The impact of forest cover on monthly temperatures was further illustrated by the dry season PDFs for the other watersheds (appendix 5) and for El Niño years (appendix 6). In general, the more heavily deforested watersheds showed broader PDFs with a greater frequency of extreme temperatures in modified areas. These values were particularly marked during El Niño events (appendix 6).
3.3. Mean daily precipitation changes
Annually averaged mean daily precipitation for the whole of Borneo revealed an average decline of 0.036 mm yr−1 between 1951 and 2007 (figure 2(c), R2 = 0.347, p = 0.004). When ENSO periods were excluded, the precipitation still declined but at a lower rate of 0.009 mm yr−1 (R2 = 0.117, p = 0.095). The analysis showed the mean daily precipitation during the 1951–1972 period was 6.7 mm day−1 and showed little change beside inter-annual variability (figure 2(d), R2 = 0.004, p = 0.91). From 1973–2007, mean annual daily precipitation declined by 0.04 mm yr−1 (figure 2(d), R2 = 0.182, p = 0.011). During this period, the average daily precipitation was 5.68 mm day−1. The analysis of the annual cycle of precipitation difference between the two periods showed a decline for all months, with a reduction of ∼1 mm day−1, except for April (appendix 3(b)). At the watershed scale, there was a general decrease in mean daily precipitation during 1973–2007 relative to 1951–1972 for all months (appendix 7). The strongest and most consistent decrease in monthly precipitation occurred in watersheds in the southeast (WS113, WS143, WS156, WS60 and WS71). Northern and northwestern watersheds had a smaller and less consistent reduction.
Percentage forest loss and annually averaged mean daily precipitation for 1973–2007 compared to 1951–1972 for the selected watersheds showed a robust relationship (figure 3(b), R2 = 0.368, p = 0.083). In general, the watersheds with >15% forest loss had a rainfall decline of >15%. The four watersheds (WS71, WS113, WS143 and WS156) with the greatest loss of forested area had the greatest decrease in mean precipitation between the two periods.
4. Discussion and conclusion
In this study, we have demonstrated a relationship between forest cover change and local climate change in Borneo. Our analyses of the historical interpolated climate data demonstrates that the loss of Borneo's forests is associated with increased daily temperatures and reduced daily precipitation. Highly deforested watersheds with >15% forest loss had a significant (>15%) reduction in rainfall. The impact of deforestation on climate was most pronounced in the southeast of Borneo which has experienced extensive deforestation since 1973 (Hansen et al 2013, Gaveau et al 2014b, Miettinen et al 2016). Northern watersheds which have retained substantial forest cover had a more stable climate.
A separate analysis using MODIS-derived land surface temperature confirms that the loss of Borneo's lowlands forests is resulting in significant temperature differences between forested and human-modified landscapes. These differences were most pronounced for watersheds with a high degree of clearing and extensive oil palm plantations. This analysis showed a strong relationship between the extent of deforestation and mean monthly temperature. For the lowland areas of Borneo, deforested areas were warmer by 1.7 °C than forested areas. At the watershed-scale, modified forests are hotter and have a higher frequency of extreme temperatures (>31 °C mean monthly) than forested areas. The temperature contrast between forest and modified forest areas was most pronounced during the dry season and El Niño years. These results show that forest loss results in hotter temperatures with a significant increase in the frequency of hot temperature extremes. These extremes are most pronounced in watersheds in southeast Borneo (East Kalimantan and Central Kalimantan), whereas watersheds in north and northwest Borneo (Sarawak and Brunei) have a significantly lower extent of forest loss and have a more stable climate with similar differences in the distribution of mean and extreme warm temperatures.
A number of recent studies demonstrate that deforestation has a significant impact on local and regional temperatures (Alkama and Cescatti 2016, Schultz et al 2017). Schultz et al (2017) showed that the impact of deforestation on temperature was strongest in the tropics, where the daytime warming is on average 4.4 K. The loss of tropical forest cover results in decreased evaporative cooling resulting in temperature increases. Numerous studies describing the climate impacts of large-scale deforestation of the Amazon show reduced evapotranspiration and evapotranspiration and moisture convergence (Pires and Costa 2013), decreasing rainfall, increasing surface temperature and even affecting meso-scale circulation patterns (Lejeune et al 2015, Spracklen and Garcia-Carreras 2015, Wu et al 2017). There is recent evidence showing that these changes can also impact the length of the dry season and forest resilience, which can lead to permanent forest loss (Zemp et al 2017). Theory and evidence indicate that tropical forests may also contribute to the low atmospheric pressures that draw winds into these regions (Sheil and Murdiyarso 2009, Makarieva et al 2013, Makarieva et al 2014). However, the impact is likely to be more pronounced over large continental regions compared to tropical maritime region of Southeast Asia (Ellison et al 2017, Lawrence and Vandecar 2015).
Tropical rainforests play a critical role in regulating regional temperatures by maintaining the optimal range of temperatures. This optimal range is maintained by the evaporative cooling from the extensive, intact forest canopy (Bonan 2008). The clearing of tropical forest cover disrupts the climate regulation function of forests and results in a different frequency distribution of daily temperatures, characterised by hotter and more extreme temperatures (Thirumalai et al 2017). This effect is especially pronounced in the South-East Asian region (including Borneo) during El Niño events which are associated with abnormally hot and dry conditions compared to the long-term average (Bowman 2017, Taufik et al 2017).
We acknowledge the patchy climate station coverage is a problem in constructing and interpreting the gridded climate data for Borneo which has a mountainous interior. For many locations, including the mountainous interior, available records are not accessible, have poor quality control and assurance including significant missing data values, and do not cover sufficient temporal periods. As a result, stations are more representative of the lowland modified forest cover and consequently the interpolated signals may be stronger there than for Borneo's interior. In a recent study, Supari et al (2017) used data from 88 weather stations from Indonesia and showed significant and spatially coherent trends in temperature indices. Their results are consistent with our findings. Our analysis of the climate data for the selected catchments show robust a impact of the level of deforestation on the climate signal (figures 2(e) and (f)). Furthermore our analysis of the MODIS land surface temperature shows impact of deforestation on the frequency of extreme warm temperatures. The agreement between the results of the interpolation and station-based analyses give us confidence the results are robust. However, there is a need to further disentangle the relative contribution of global warming and deforestation on regional climate signals over Borneo.
The high rate of deforestation in combination with projected increases in temperature and the likelihood of more extreme El Niño events (Thirumalai et al 2017) will have far reaching impacts on the environment, agricultural productivity and human livelihoods in Borneo in coming decades (Paterson et al 2015, Mora et al 2017). Further, Becek and Horwath (2017) postulate that increased frequency of high temperatures and droughts in Borneo are increasing the risk of forest degradation through reduced net primary productivity with reduced soil moisture leading to canopy thinning and reduced leaf area index. If these changes are realised, it is likely that this tropical ecosystem will collapse and result in a substantially altered bioclimatic regime (see figure 2 in McAlpine et al 2010).
The expansion of oil palm plantations is the major driver of forest loss and fragmentation in Borneo. An analysis using microclimate sensors shows temperature differences of 2.8 °C–6.5 °C for oil palm plantations compared to rainforests (Luskin and Potts 2011, Ramdani et al 2014, Hardwick et al 2015). A recent study from the neighbouring region of Sumatra assessed the impact of deforestation on local warming for seven different land cover types (forest, urban areas, clear cut land, young and mature oil palm plantations, acacia and rubber plantations) (Sabajo et al 2017). Using MODIS and Landsat LSTs, they showed that local warming resulting from the conversion of forest to clear cut land was up to 10 °C (Sabajo et al 2017). In addition, temperatures below 20 °C and above 36 °C are unsuitable for growth of oil palm (Paterson et al 2015). Yields decrease by approximately 30% with an increase of 2 °C above optimum.
Between 1973 and 2015, 186 507 km2 of Borneo's forest were lost, leaving just 373 347 km2 of forest (205 318 km2 of intact old growth) (Gaveau et al 2016). Forest loss and degradation has continued with the subsequent fires of 2015 (Field et al 2016, Purnomo et al 2017). Aside from the larger scale consequences of greenhouse gas emissions, smoke pollution and the reduced atmospheric moisture resulting from these forest losses, there are also more localized impacts. As we have shown, these include higher temperatures, reduced rainfall and greater climatic variation. We note that the previously rare combinations of conditions that allow tropical rain forests to burn (Van Nieuwstadt and Sheil 2005) may become more common with increased frequencies and intensities of drought, along with the degradation and higher risk of ignition that comes with human activities (Siegert et al 2001).
Acknowledgments
ARC Discovery Projects grant DP160102107 and the Australian Research Council Centre of Excellence for Environmental Decisions (CE11001000104). We thank Jessie Wells, Malcolm Nunn and Simon Blomberg for their assistance with the historical daily temperature and precipitation data. We are especially grateful to David Gaveau for the forest cover data, and Srivatsan Vijayaraghavan for providing advice on the APHRODITE data. We also thank Royal Society South East Asia Rainforest Research Programme for providing the climatic data at Danum Valley Field Centre used in this paper (www.searrp.org).