

Abstract
Oceanic and atmospheric patterns play a crucial role in modulating climate variability from interannual to multi-decadal timescales by causing large-scale co-varying climate changes. The brevity of the existing instrumental records hinders the ability to recognize climate patterns before the industrial era, which can be alleviated using proxies. Unfortunately, proxy based reconstructions of oceanic and atmospheric modes of the past millennia often have modest agreements with each other before the instrumental period, raising questions about the robustness of the reconstructions. To ensure the stability of climate signals in proxy data through time, we first identified tree-ring datasets from distant regions containing coherent variations in Asia and North America, and then interpreted their climate information. We found that the multi-decadal covarying climate patterns of the middle and high latitudinal regions around the northern Pacific Ocean agreed quite well with the climate reconstructions of the tropical and southern Pacific areas. This indicates a synchronous variability at the multi-decadal timescale of the past 430 years for the entire Pacific Ocean. This pattern is closely linked to the dominant mode of the Pacific sea surface temperature (SST) after removing the warming trend. This Pacific multi-decadal SST variability resembles the Interdecadal Pacific Oscillation.
Export citation and abstract BibTeX RIS

Original content from this work may be used under the terms of the Creative Commons Attribution 3.0 licence.
Any further distribution of this work must maintain attribution to the author(s) and the title of the work, journal citation and DOI.
1. Introduction

Figure 1. Locations of the 375 tree-ring chronologies and the 12 chronologies showing coherent multi-decadal variations in Asia and North America. Much of the northern Pacific Ocean without tree-ring data were not shown in this map.
Download figure:
Standard image High-resolution imageNatural and anthropogenic forcings often indirectly influence interannual (f < 0.1) and interdecadal (0.1 < f < 0.01) climate variations by modulating oceanic and atmospheric oscillations [1–4]. These oscillations can often influence the climate of remote areas, leading to large-scale co-varying climate patterns. For example, the El Niño-Southern Oscillation (ENSO) and the Interdecadal Pacific Oscillation (IPO) have strong impacts on interannual and interdecadal climate variability of the Pacific and even the globe [5–10]. However, instrumental records are limited to the past several decades e.g. after the 1950s, in most regions of Asia [11], which hinders our ability to comprehend the evolution of the oceanic and atmospheric oscillations and their linkages with large-scale climate anomalies [12–15]. Accordingly, proxy data, such as tree rings, have been widely used to reconstruct oceanic and atmospheric oscillations over the past millennia [5–7, 12, 14, 15]. However, unlike the relatively coherent variations among different temperature reconstructions, tree-ring based reconstructions of the same climatic oscillations using proxy data from different regions often show limited similarities before the instrumental period [1, 14], raising questions about the robustness of such reconstructions.
To address this challenge, this study will first confirm the proxies have coherent variations for the whole periods across large areas. This ensures that the large-scale climate signals in tree rings are stable through the entire period. Then we interprete their relationships with the oceanic and atmospheric oscillations [16]. The rationale for such an approach is that coherent variations in tree-rings from different regions—if found—are indicative for large-scale modes of climate variability, which are likely related to oceanic and atmospheric oscillations [5]. Large-scale climate patterns often differ on different timescales [17, 18]. This study focuses on the coherence of dominant tree-growth patterns on multi-decadal scales (f < 0.02). Correspondingly, our main objectives are to detect the multi-decadal coherent tree-ring variations that dominate North America and Asia (figure 1), and to study their relationships with the oceanic and atmospheric oscillations. Climate signals in tree rings are evaluated by comparing tree rings with instrumental data. In addition, we explored the linkages between oceanic and atmospheric oscillations inferred from tree rings and external forcings prior to the industrial era.
2. Data and methods
2.1. Tree-ring and climate data
The tree-ring dataset was compiled spanning at least 400 years in the areas around the northern Pacific Ocean, including 231 chronologies in Asia and 144 in North America (figure 1). Although some regions are far from the coast, they are potentially influenced by the Pacific Ocean, such as central Asia [5]. Most of these tree-ring chronologies were taken from the Past Global Changes (PAGES) 2 k project [19] and the International Tree-Ring Data Bank (ITRDB), and the others were contributed personally (table S1 available at stacks.iop.org/ERL/13/024016/mmedia). Most of the tree-ring proxies are the total ring width, with only a few sites having additional proxies of earlywood (2 series), latewood (2) density, maximum (3) and minimum (2) density. Spatial patterns revealed by tree rings may be biased due to their uneven distributions. For example, some regions with denser coverage of tree-ring chronologies may have overweight loadings over the dominant tree-ring signals. Thus, the tree-ring chronologies within 0.5° in latitude or longitude with significant (p < 0.001) correlations were merged by their means, which condensed the tree-ring network to 335 chronologies with 196 in Asia and 139 from North America (figure 1 and table S1).
The tree-ring chronologies were developed after removing the age-related growth trends by fitting in growth curves (a negative exponential curve, straight line or a spline cure with a 50% frequency cutoff of 2/3 of the length of the series) [20]. The centennial variations in different tree-ring chronologies can be different due to their changing segment lengths, which may cause biases in detecting large-scale common variations. Thus, this study only focused on multi-decadal variations by removing the centennial (f < 0.01) variations of the tree-ring chronologies. We only used the reliable portion of the chronologies with at least six cores available. This is an efficient way to treat for datasets of a large number of chronologies [11, 21]. For the selected chronologies as detailed below, we used the statistic of the expressed population signal (EPS) over 0.85 to determine their reliable portions. Over 90% of the tree rings are hydroclimate sensitive as indicated by previous studies [11, 19, 22]. This fits well with our purpose to study oceanic and atmospheric oscillations that are often related to both the temperature and precipitation.
This study employed the long instrumental sea surface temperature (SST) since 1871 from the HadISST with a 1° × 1° spatial resolution [23], which was developed by the Met Office Hadley Centre for Climate Prediction and Research. The SST data were reconstructed using a two-stage reduced space optimal interpolation procedure. This method combines data-reduction and the least squares optimal estimation. The reduction of the original data was conducted via employing the leading modes from the empirical orthogonal analysis, which makes the interpolation computationally cheaper than using the original data. The two stages of the interpolation processes are to construct the long-term changes of the SST first and then to construct the variability on interannual scales. For high-latitude regions with short and sparse SST observations, the SST data were reconstructed from sea ice data based on the statistical relationships with the SST data from observations and satellite images in modern periods. The sea ice records of different sources are heterogeneous, which were inter-calibrated to remove as much as possible their spurious trends. This SST dataset captures well the trends from global to regional scales revealed in other SST datasets and shows more uniform variance through time than the global sea ice and sea surface temperature (GISST) dataset [23].
2.2. Methods
To extract the multi-decadal variations in tree rings, we used the Butterworth filter [24, 25] to separate the raw data into low- and high-passed series by a cutoff frequency of 0.02. All the tree-ring chronologies (figure 1 and table S1) in eastern Asia and North America were subjected to the PC analysis based on their cross-correlations during their common period of 1600–1979. The PC analysis was also applied to multi-decadal variations of tree-ring chronologies. We herein only extracted the PC1 of the tree-ring chronologies in Asia and North America, which represented their dominant patterns for a large-scale area around the northern Pacific Ocean.
3. Results
3.1. Coherent growth variations between Asia and North America
The PC1 of the multi-decadal variations of the tree-ring chronologies in Asia and North America accounted for 18.1% of the total variance. Coherent variations among the multi-decadal tree-ring series were found over various regions, such as the western and northeastern boundaries of Tibetan Plateau and Japan, and the western and central United States (figure 2). The explained variance is not high because the tree rings were distributed within a large area containing diverse regional climate patterns. To better retain the dominant signals between Asia and North America from disparate regions, we only used the tree-ring data with high loadings on the PC1. Accordingly, we selected 12 chronologies from Asia and North America tree-ring network with exceptionally high loadings (>0.8) on PC1 (figure 1). The high loadings on PC1 indicated that the multi-decadal variations of the 12 chronologies were sensitive to common environmental variability, such as the large-scale climate mode over the Pacific Ocean. The mean of these tree-ring chronologies with coherent variations (figure 3) are expected to reflect the dominate climate pattern of the areas surrounding the northern Pacific Ocean over the past 430 years. This mean time series shows significant periodicities centered at ∼60 years (figure S1), which agrees with previous findings of the presence of dominant multi-decadal periodicities at 50–70 years for the northern Pacific Ocean [2]. High loadings on the tree-ring chronologies near the 12 sites were also found, suggesting synchronous variations between the multi-decadal climate variations of these regions.

Figure 2. Loadings of the multi-decadal (f < 0.02) variations of the tree-ring chronologies in (a) eastern Asia and (b) North America on their first principal component (PC1).
Download figure:
Standard image High-resolution image
Figure 3. The (a) multi-decadal (0.01 < f < 0.02) variations of the selected tree-ring chronologies in Asia and North America, and the (b) mean and the standard deviations (std) of these tree-ring series. The codes of these chronologies are shown in table S1.
Download figure:
Standard image High-resolution image3.2. Synchronous tree-ring patterns for the entire Pacific Ocean
The dominant coherent climate pattern of the northern Pacific as represented by the PC1 and the 12 chronologies with the highest loadings was compared with the climate patterns of the tropical and southern Pacific areas. In the southern Pacific, the Antarctica Oscillation (AAO) plays a dominant role in shaping the climate variability from interannual to centennial scales [26]. We thus compared our multi-decadal climate variability for northern Pacific area with an AAO reconstruction from over 3000 trees covering the most of the middle and high latitudes in Southern Hemisphere [12]. This AAO reconstruction has no overlapping proxy data with our tree-ring data surrounding the northern Pacific Ocean. As shown in figure 4(a), we found an excellent match between our data and this AAO reconstruction. Although the robustness of this AAO reconstruction is not fully conclusive, as it has many mismatches with the other AAO reconstruction [27] (figure S2), it is at least safe to conclude that this AAO reconstruction at least reflects the climate variability of the southern Pacific Areas where the proxy data are located. Therefore, close matches between our data and the AAO reconstruction indicate the presence of coherent multi-decadal climate patterns between the middle and high latitudes of Pacific areas in both hemispheres.
As for the tropical Pacific area, it is widely accepted that ENSO plays a dominant role on climate variability on various timescales. There are numerous ENSO reconstructions. However, most of these ENSO reconstructions are poorly matched before the instrumental period [6, 7]. This study selected two robust ENSO reconstructions with close matches on the multi-decadal scales (figure 4(b)). The two reconstructions are based on largely independent proxies with only common coral records from the western equatorial Pacific Ocean [6, 7]. Our tree-ring data shared six tree-ring chronologies in the southwestern North America with the ENSO reconstruction by Stahle et al [7]. But the 12 chronologies used to produce the IPO were totally independent from that used in this ENSO reconstruction [7]. That is, the comparisons between the means of the 12 chronologies and the ENSO reconstruction by Stahle et al [7] were based on completely independent data. In addition, our tree-ring data were completely independent from the other ENSO reconstruction by Wilson et al [6], which is based on coral records from the teleconnected regions in western equatorial Pacific Ocean. As shown in figure 4(b), we found that the indices of the multi-decadal variations of our tree-ring data are very close to that of the two ENSO reconstructions [6, 7]. Close matches between multi-decadal climate variations of the surrounding regions in the northern, equatorial and southern Pacific Oceans suggested that the coherent multi-decadal climate variations for the areas near the entire Pacific Ocean over the past 430 years.
4. Discussion
4.1. Pacific multi-decadal climate variability and SST patterns
Synchronous climate variability on multi-decadal scales over the entire Pacific suggests the presence of a large-scale climate pattern that dominates the whole Pacific. Temperature variations often show coherent variations over large areas. However, we did not find any close matches between our tree-ring data and the temperature changes (figure S3). This may be due to the fact that most of the proxies used mentioned herein are moisture-sensitive.

Figure 4. Comparisons between the coherent multi-decadal variations of this study and the reconstructions of the (a) Antarctic oscillation (AAO) by Villalba et al [12] and the (b) El Niño-Southern oscillation (ENSO) by Wilson et al [6] and by Stahle et al [7]. Our tree-ring data and the AAO reconstruction were reverted (by multiplying −1) to facilitate comparisons.
Download figure:
Standard image High-resolution image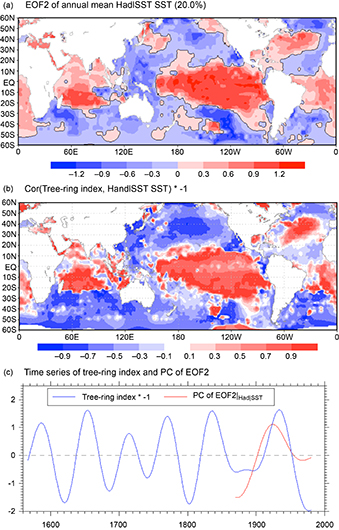
Figure 5. (a) The second EOF2 pattern of the low-passed annual mean sea surface temperature (SST) from the HadISST dataset, (b) map of correlations between the mean of the tree-ring chronologies with coherent multi-decadal variations and low-passed SST, and (c) the time-series comparisons between the tree-ring data and the EOF2. The tree-ring indices are negatively correlated with SST of eastern Pacific Ocean and the tree-ring data are thus reversed (by multiplying −1) to facilitate comparisons.
Download figure:
Standard image High-resolution image
Figure 6. Comparisons between the Pacific multi-decadal climate variability inferred from our tree rings, a reconstructed AMO [34] and a reconstructed time series of solar irradiance [41].
Download figure:
Standard image High-resolution image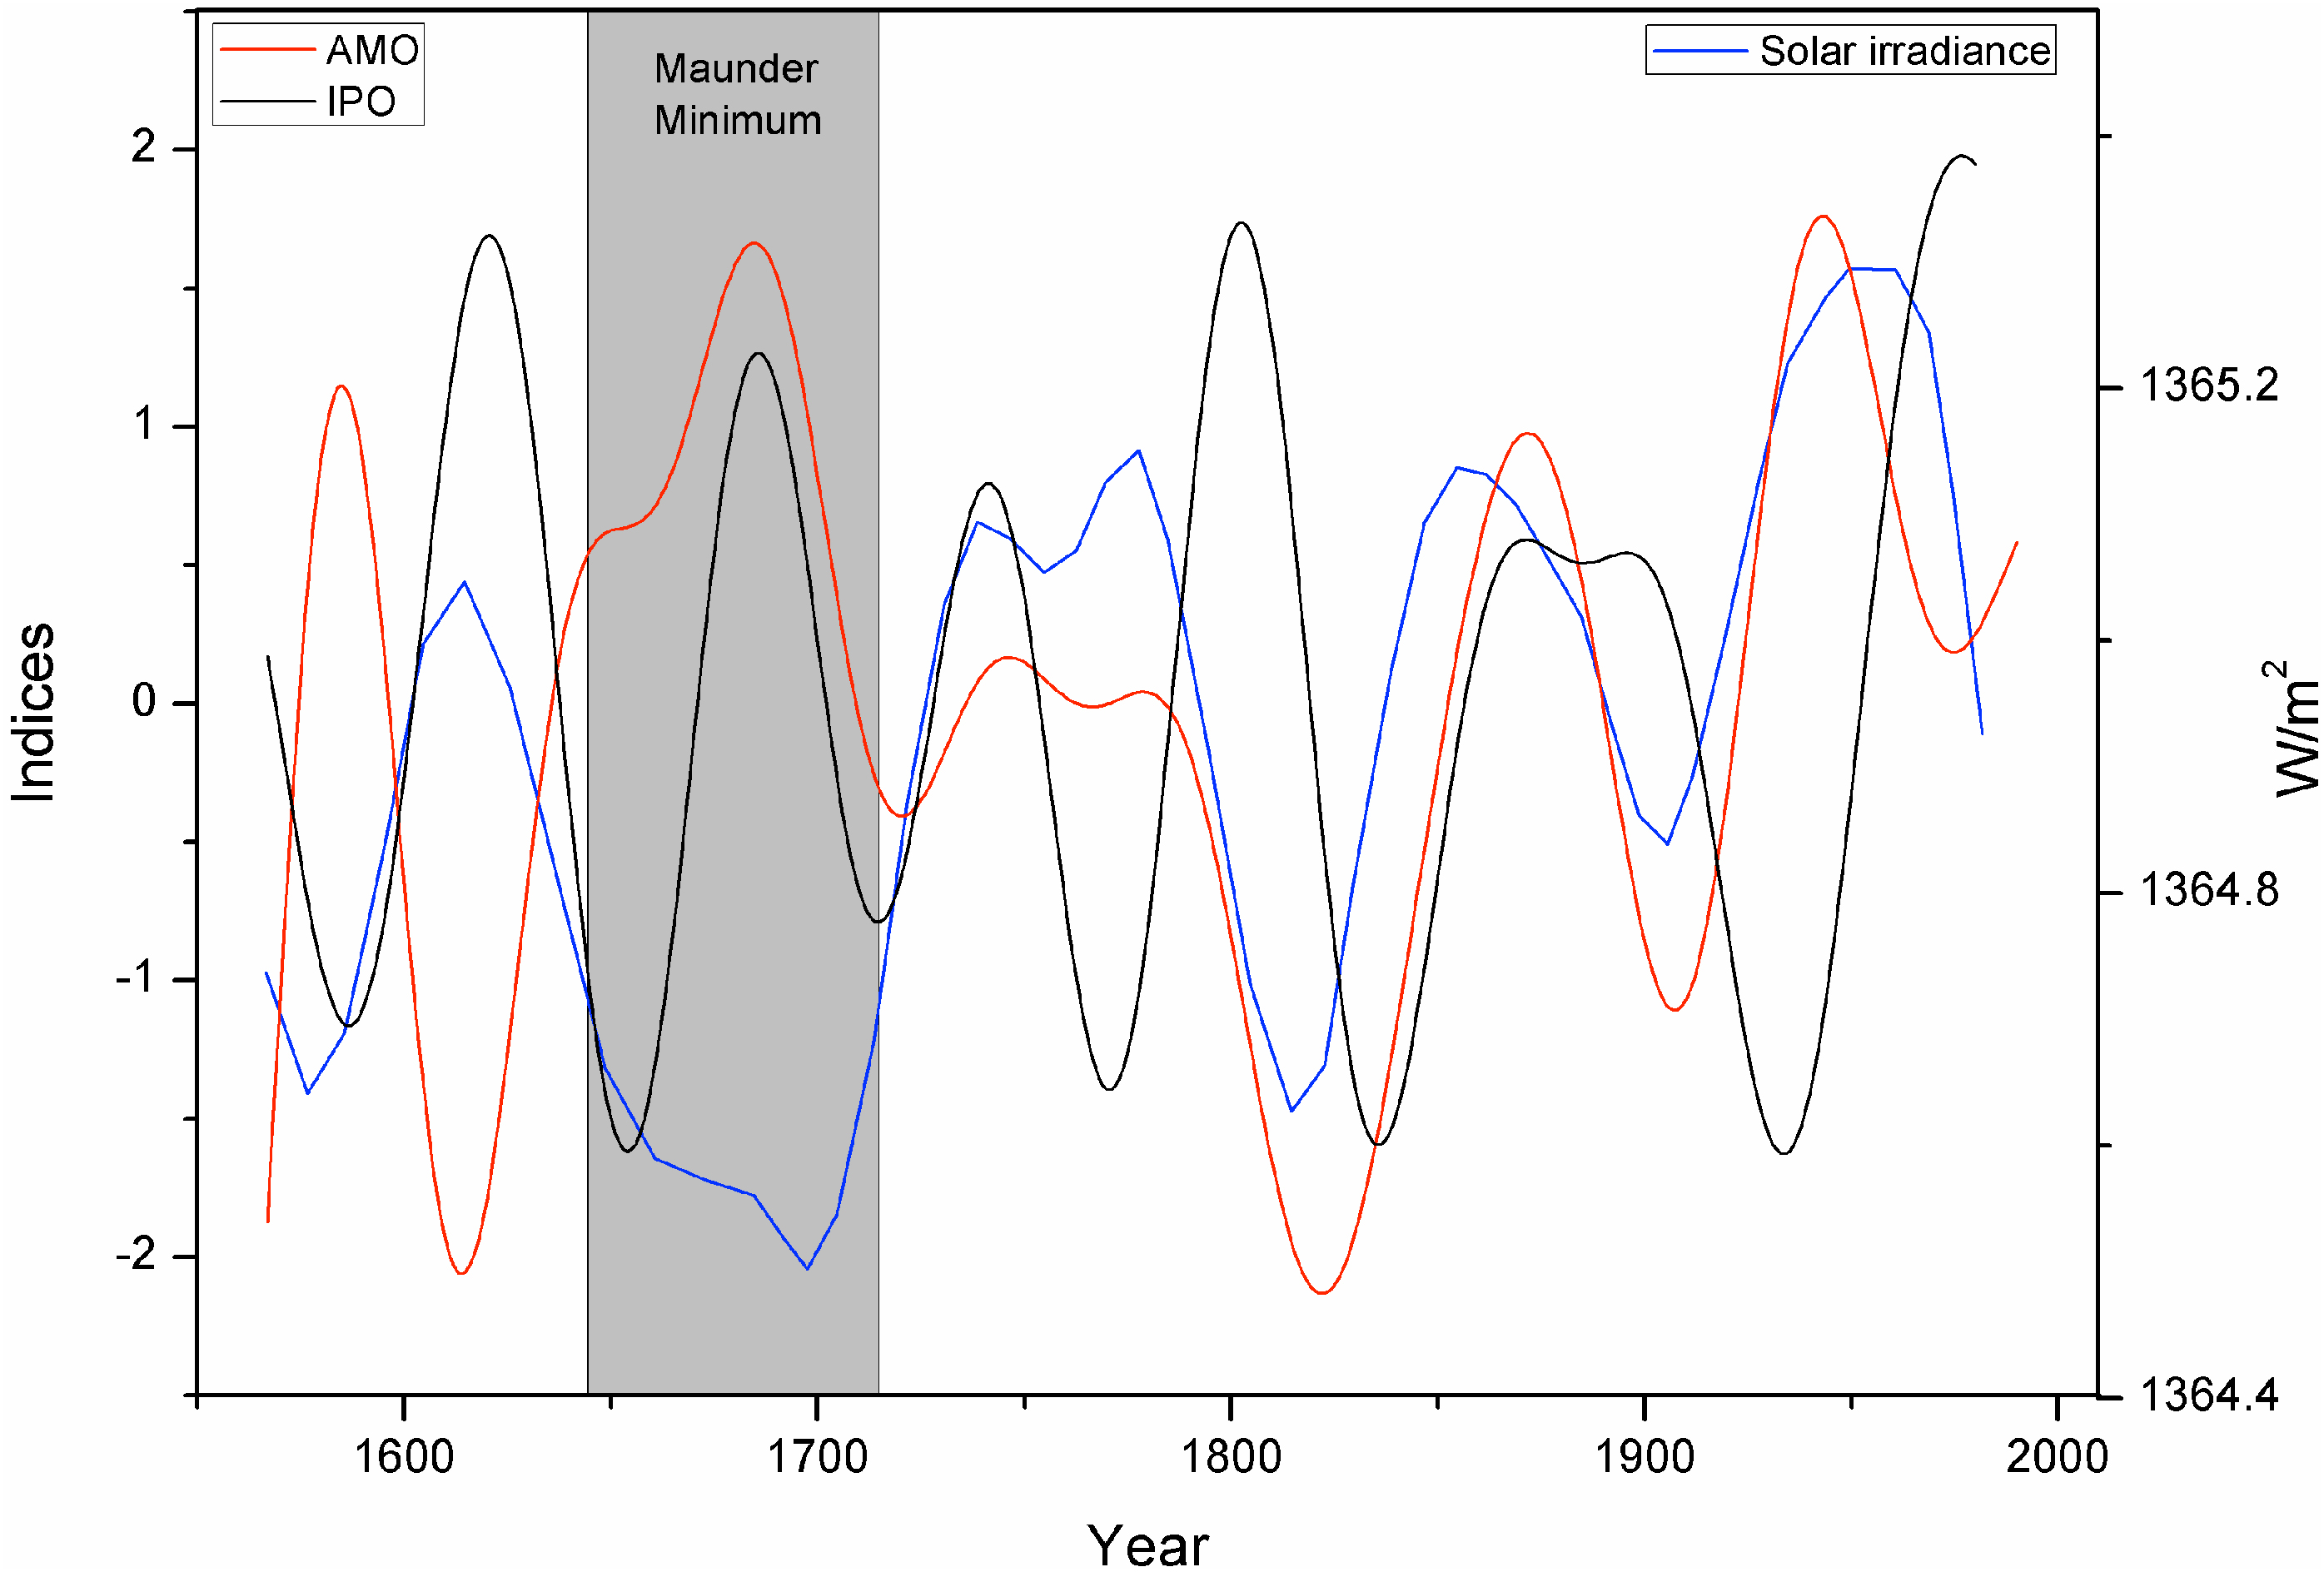
Coherent climate variability of the large areas can also be produced by an oceanic and atmospheric pattern. We thus correlated the multi-decadal variations of our tree-ring data with the SST modes. As shown in figure 5, correlations between our data and the SST resembles well with the second empirical orthogonal function (EOF2) of the multi-decadal variation of the SST. Both show high loadings over the eastern parts of tropical and southern Pacific Ocean. This is very similar to the EOF2 pattern of the unfiltered Pacific SST, i.e. the IPO pattern [9]. Therefore, we consider the revealed EOF pattern as reasonable, although the freedom of the data for the significance test is not high due to the low-pass filtering processes to extract the multi-decadal variability. The first EOF1 pattern of the SST represents the global warming trend (figure S4). Hence, the EOF2 pattern of the Pacific SST can be considered as the dominant multi-decadal SST variability without the warming trend. The EOF2 SST pattern is very similar to the correlation map between our tree-ring data and HadISST (figure 5(b)). It is readily understood that the dominant multi-decadal climate pattern revealed in tree rings most resembles the dominant Pacific multi-decadal SST pattern.
We think our tree-ring data show better representation of the multi-decadal variability of IPO than ENSO. The SST pattern responsible for the multi-decadal Pacific climate variability has showed more similarities with the SST pattern of the IPO than the ENSO. For example, ENSO does not show high loadings over the middle latitudes of the Pacific Ocean. Close matches between our tree-ring data and the ENSO reconstruction in figure 4 may be because the IPO and the ENSO are highly correlated from interannual to interdecadal scales as revealed previously [28]. It is reasonable to assume that the multi-decadal variability of our tree-ring data is more closely linked to the IPO with more interdecadal variability than that of the ENSO. However, it should be noted that the SST pattern associated with our tree-ring data also has differences from the IPO pattern. For example, the SST pattern of the IPO has high loadings over south central Pacific Ocean, which is not significant for the correlation with Pacific multi-decadal climate variability. As shown in figure S5, apart from some mismatches in the instrumental period, there are considerable mismatches between our tree-ring data and the reconstructed IPO [29]. These differences may be because of the shorter timescales of the IPO compared to the multi-decadal variability. Taken together, our tree-ring data reflect the Pacific multi-decadal variability, which resembles the existing oceanic mode of the IPO but with some differences.
We did not interpret our tree-ring data to represent AAO variations as they do not have similar correlations with pressures as AAO does. Close matches between our tree-ring data and the AAO reconstruction [12] may be because that both the tree-ring data in our study and in the AAO reconstruction [12] were also modulated by the SST of southern Pacific Ocean. As shown in figure S6, compared to the instrumental AAO, the tree-ring based AAO reconstruction showed higher correlation with the SST in the Southern Pacific Ocean. This may because that the SST often has variability at lower frequencies than the atmospheric process, such as the AAO, and the tree rings also tend to retain more low-frequency variability than instrumental data because of the autocorrelation in tree growths [30]. In addition, on interdecadal scales, the AAO is often in its negative phase during the positive phase of ENSO and vice versa. This can also explain the negative correlations between the AAO and ENSO and that with IPO in the reconstruction periods (figure 5).
4.2. Potential regimes of the Pacific multi-decadal climate variability
The IPO-like mode can cause large-scale synchronous climate anomalies in different areas surrounding the Pacific Ocean via modulating the atmospheric circulations. Such large-scale atmospheric circulations include the meridional circulations of the monsoon and the latitudinal circulations of the Walker circulation and westerlies. During the positive (negative) phase of the IPO, the Asian summer monsoon is often weakened (enhanced) [31], which accounts for the dry (wet) conditions over the core areas of the monsoonal regions in southern Himalaya, southern China and southeastern Asia (figure 2). On the other hand, the IPO is negatively associated with the strength of the Walker circulation and is thus positively correlated with the precipitation in southwestern USA [31, 32]. The IPO/ENSO is negatively associated with the precipitation in the western coastal areas of Canada, which can explain the positive loadings over these regions (figure 2).
A positive (negative) phase of the IPO is coupled with a low (high) subtropical High of both hemispheres, causing weak (strong) westerlies [33]. This mechanism may behind the negative associations between the ENSO and the AAO reconstructions. A positive (negative) AAO and the associated westerlies can enhance (weaken) the Peru circulation. This may cause cold (warm) SST anomalies in the eastern equatorial Pacific Ocean and thus a negative (positive) phase of the ENSO. In addition, the ENSO and AAO can be linked via the Hadley circulation. Climate regimes linking the large-scale climate anomalies between Pacific SST and the areas surrounding the Pacific Ocean require further exploration by modeling studies.
4.3. Linkages between Pacific and Atlantic multi-decadal climate variability
We further compared the Pacific multi-decadal variability and the solar irradiance and the Atlantic multi-decadal oscillation (AMO), another multi-decadal climate mode. We believe that the three overlapping chronologies in southeastern USA between our data and the AMO reconstruction [34] have minor influence on the data independence due to two factors. Firstly, the three overlapping chronologies had low loadings on the PC1 of the 375 chronologies (figure 2), which indicates that they have limited contribution to the Pacific multi-decadal variability. Secondly, the 12 selected chronologies used to generate the Pacific multi-decadal variability have no overlap with the chronologies used for AMO reconstruction. This AMO reconstruction is robust because its multi-decadal variations agree with other two AMO reconstructions [35, 36] derived from completely independent proxies (figure S7).
In contrast to the rapid response of the AMO to solar irradiance since the termination of the Maunder Minimum period (1645–1715) [37] as reported previously [4], the Pacific multi-decadal climate variability does not match well with the solar activity after the Maunder Minimum period (figure 6). There seemed to be a lagged response of the Pacific multi-decadal climate variability to solar irradiance and AMO by about 20 years during the 19th and 20th centuries. However, before the Maunder Minimum, the Pacific multi-decadal climate variability showed a rapid response to solar irradiance, while the close matches between AMO and solar irradiance disappeared.
It appears that the couplings between solar irradiance and the Pacific and Atlantic multi-decadal climate variability have shifted since the Maunder Minimum. Previous studies have revealed a generally weak Atlantic Meridional Overturning Circulation (AMOC) during and before the Maunder Minimum [38]. This may cause a cool North Atlantic SST and an ambiguous response to solar irradiance of the AMO for this period [4]. In addition, an El Niño-like condition during and before the Maunder Minimum [39, 40] can enhance a meridional energy transport, which may facilitate a prompt response of the Pacific SST to solar irradiance. It should be kept in mind that conclusions on temporal instability in the responses of Pacific multi-decadal climate variability to solar irradiance require future proxy- and modeling-based investigations.
5. Conclusions
This study first identified the tree-ring chronologies with coherent multi-decadal climate variations for the areas near the northern Pacific Ocean over the past 430 years and then interpreted their climate significance. This method confirms that the climate signals in tree rings are stable through the entire period. We found that the coherent multi-decadal tree-ring variations surrounding the northern Pacific Ocean agree quite well with the multi-decadal climate variability of the areas in and around the tropical and southern Pacific Ocean. This indicates that the multi-decadal variations for the entire Pacific Ocean are coherent over the past 430 years. The dominant Pacific multi-decadal climate variability resembles the existing oceanic and atmospheric mode of the IPO, which reflects the dominant climate variability of the whole Pacific areas without the warming trend. This suggests the linkages between the Pacific multi-decadal climate variability and the IPO-like oceanic and atmospheric anomalies. Further proxy and modeling based studies are needed to investigate the regimes of this Pacific multi-decadal climate variability.
Acknowledgments
Constructive comments and suggestions from the two anonymous reviewers are highly appreciated. This research is funded by the National Science Foundation of China (41471172 and U1405231), the non-profit research funds of Fujian province (2014R1034-2), the National Science Foundation of Fujan Province (2015J01123). The Swedish Research Council VR and Formas (Future Research Leaders) and BECC projects.