

Abstract
Urban areas have broad ecological footprints with complex impacts on natural systems. In coastal areas, growing populations are advancing their urban footprint into the ocean through the construction of seawalls and other built infrastructure. While we have some understanding of how urbanisation might drive functional change in terrestrial ecosystems, coastal systems have been largely overlooked. This study is one of the first to directly assess how changes in diversity relate to changes in ecosystem properties and functions (e.g. productivity, filtration rates) of artificial and natural habitats in one of the largest urbanised estuaries in the world, Sydney Harbour. We complemented our surveys with an extensive literature search. We found large and important differences in the community structure and function between artificial and natural coastal habitats. However, differences in diversity and abundance of organisms do not necessarily match observed functional changes. The abundance and composition of important functional groups differed among habitats with rocky shores having 40% and 70% more grazers than seawalls or pilings, respectively. In contrast, scavengers were approximately 8 times more abundant on seawalls than on pilings or rocky shores and algae were more diverse on natural rocky shores and seawalls than on pilings. Our results confirm previous findings in the literature. Oysters were more abundant on pilings than on rocky shores, but were also smaller. Interestingly, these differences in oyster populations did not affect in situ filtration rates between habitats. Seawalls were the most invaded habitats while pilings supported greater secondary productivity than other habitats. This study highlights the complexity of the diversity-function relationship and responses to ocean sprawl in coastal systems. Importantly, we showed that functional properties should be considered independently from structural change if we are to design and manage artificial habitats in ways to maximise the services provided by urban coastal systems and minimise their ecological impacts.
Export citation and abstract BibTeX RIS

Original content from this work may be used under the terms of the Creative Commons Attribution 3.0 licence.
Any further distribution of this work must maintain attribution to the author(s) and the title of the work, journal citation and DOI.
Introduction
Humans have profoundly altered Earth's ecosystems through myriad activities, including modification and degradation of natural habitats [1–3]. Urbanisation drives local extinction rates and alters natural habitats and species composition, homogenises communities, and modifies energy flow and nutrient cycles [2, 4–6]. While impacts of urbanisation have been well-studied on land, with demonstrated impacts on ecological structure and function [e.g. 5, 7, 8–11]; the effects are still largely overlooked in coastal systems [12]. This is despite the rapid increase in urban infrastructure being built in coastal areas (rates ranging from 3.7% year−1—merchant ships requiring harbour space; to 28.3% year−1 [offshore wind energy; 13]. Where impacts are considered, they are usually limited to assessments of biodiversity and community structure [e.g. 14–16], assessments of species interactions [e.g. 17–19], their influence on the spread and settlement of non-indigenous species [20–22] or are modelled estimates [23]. Consequently, there remains a lack of understanding of how structural changes to ecological communities translate to the functional properties of marine systems.
Urban infrastructure modifies the geomorphology and ecology of occupied and adjacent habitats, impacting their biodiversity and functioning [24–26]. For example, roads cause habitat fragmentation, animal mortality and behavioural changes, and alter the physical and chemical environment [e.g. 27]. Further, the matrix of roads and buildings is relatively impermeable to many organisms (e.g. small invertebrates), causing substantial impacts on the ecological connectivity of organisms and/or resources [e.g. 28, 29]. Similarly, marine infrastructure, such as seawalls and pilings, provide unique habitats that support ecological communities different to natural rocky shores or soft-sediments. These communities are often characterized by reduced diversity and increased abundances of opportunistic species [4, 22, 30–32]. Furthermore, urban infrastructure often support greater abundances of non-indigenous species (NIS) than natural habitats and have been posited to facilitate the establishment and spread of NIS, while not providing suitable substrata for native species [20–22]. Marine structures may also have medium to large-scale impacts on the environment, affecting adjacent habitats by altering e.g. light availability, flow, wave energy, sediment and resource transport [reviewed by 33–35]. These changes are likely to affect important functional aspects of urbanised coastal systems, with consequences for the provision of services. Nevertheless, direct assessments of the potential impacts of artificial structures on ecosystem functioning are rarely done [35, 36].
Healthy functioning ecosystems underpin the provision of services upon which societies largely depend [37, 38]. It is often inferred that changes in biodiversity directly translate into changes in functioning. However different stressors tend to affect different target organisms, thus changes in biodiversity per se cannot be assumed as 'evidence' of changes in functioning. Therefore, although it is generally accepted that greater diversity is strongly linked to improved ecosystem functioning [e.g. 39–41], the impacts of stressors on this relationship is not well understood [42]. The magnitude of the impacts of species loss on functioning is dependent, among other things, on the functional role(s) played by the species, whether there are functional redundancies within the system, or whether native species losses are offset by gains of new species [e.g. non-indigenous species; 43–45]. For example, certain physiological functions of habitat-formers, such as filtration rates of bivalves, or primary productivity of kelps, contribute directly to the overall functioning of ecosystems [see 46]. Therefore, in addition to direct effects on diversity, sub-lethal effects of stressors on these key species, i.e. that would not affect diversity per se, might have important consequences for the overall functioning of systems. Stressors such as urbanization, that might not necessarily alter the total number of species in a habitat or system, might change their identity, e.g. from communities dominated by native species to invasive dominated ones [e.g. 20, 47], potentially altering ecosystem functioning [e.g. 48, 49]. A direct assessment of both structural and functional aspects of natural systems is therefore crucial for better understanding, and consequently, better management of stressors.
Here, we evaluated the potential for pilings and seawalls to influence service provision via differences in the structural and functional aspects of the communities they support compared with natural rocky reef. We established the study in Sydney Harbour, one of the largest urbanised harbours in the world, and home to ~5 million people [50]. We measured the diversity of epifaunal species (sessile and mobile) and algae in artificial and natural habitats, including population abundance and size-structure of one of the main habitat-forming species in the intertidal area of the Harbour [50, 51], the Sydney rock oyster Saccostrea glomerata, and how these changes translate into ecosystem properties and/or functions, such as secondary productivity (via biomass accumulation), filtration rates, and the extent to which habitats supported non-indigenous species.
Filtration capacity of highly abundant species may have profound effects on water quality, which in turn affects primary productivity and contaminant concentrations [e.g. 52]. Natural rocky shores have been shown to support greater diversity than pilings or seawalls. Therefore, we predicted that ecosystem functions (in terms of filtration capacity of oysters, secondary productivity, and invasion resistance) would be greater in natural habitats compared to artificial structures.
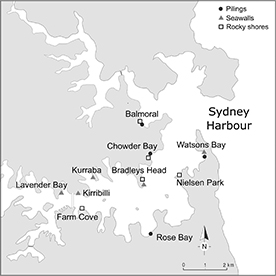
Figure 1. Map of the Sydney Harbour, Australia showing all locations where pilings, rocky shores and seawalls were sampled at both times sampling was done. At Time 1, pilings were sampled at Balmoral, Chowder Bay and Watsons Bay; seawalls at Kirribilly, Kurraba and Lavender Bay and rocky shores at Balmoral, Chowder and Bradley's Head. At Time 2, the sampled locations for pilings were: Balmoral, Chowder Bay, Watsons Bay and Rose Bay, for seawalls, Bradley's Head, Kurraba, Kirribilli and Watsons Bay and for rocky shores sampling was done at Farm Cove, Chowder Bay, Nielsen Park and Bradley's Head.
Download figure:
Standard image High-resolution imageMethods
Structural measurements: community composition and standing stock
Intertidal epibenthic assemblages were sampled at 3 locations of each type of habitat or structure (pilings, seawalls and rocky shores) in Sydney Harbour, Australia in January 2014 (figure 1). Locations were between 1 km and 7 km apart. Sampling was undertaken during low tide and sampling effort focused on mid to low-shore intertidal assemblages (0.2–0.8 m above low water spring tides). At each location, six quadrats (10 × 10 cm) were photographed and all organisms within the quadrat were collected and transported to the laboratory. In the laboratory, each sample was rinsed with ethanol over a 500 μm mesh to remove excess detritus. Organisms were preserved in 80% ethanol and then counted and identified, under a dissection microscope, to the lowest possible taxonomic level. Colonial organisms and algae were recorded as present or absent in each sample. All identified species were then classified according to their feeding mode [functional groups; 53], e.g. filter-feeders, predators, scavengers, etc The biomass (ash-free dry weight (AFDW)) of each replicate quadrat at each location and type of habitat was calculated for each broad taxonomic group (e.g. polychaetes, gastropods), with the exception of the oyster Saccostrea glomerata Gould, which was measured separately due to its large size. Organisms were air dried for 24 hours in a fume cupboard with airflow and weighed. Dry samples were then transferred into a crucible and ashed in a muffle furnace for 3 hours at 500 °C. AFDW was calculated by subtracting ash weight from dry weight.
We also reviewed the relevant literature from Sydney Harbour to (1) contextualise rather than directly compare our findings (because of methodological differences), (2) investigate if general patterns were consistent regardless of sampling effort, and (3) ensure that sampling done here was representative of the assemblages present without major omissions. The review included all papers and reports that involved sampling intertidal benthic assemblages on at least one of the habitats studied here (i.e. rocky shore, seawalls or pilings). Only papers done in Sydney Harbour [see 50, 56] and that reported organisms identified to species level were included in the literature review. A list of species reported on each type of habitat in the Harbour was compiled, and these species were then classified as native, non-indigenous or of unknown origin (for comparison with our survey assessment of invasibility in each habitat, see below) according to the literature.
Filtration rates
Filtration rates of the habitat-former Saccostrea glomerata were measured in situ, using a methodology adapted from Browne et al [54] and Cole et al [55]. Filtration rates and oysters dimensions were measured twice, following the same procedure, in January and June 2014. On the first occasion, measurements were taken at 3 locations of each type of habitat, while on the second occasion measurements were taken at 4 locations of each type of habitat. Sampling was done two times to assess whether differences among type of habitats, if any, were consistent through time. Filtration chambers (of approximately 4 l volume each) were placed, inverted, on top of clusters of oysters (minimum of 5 oysters per cluster and maximum of 40) for 30 min. Each cluster was then considered a replicate, n = 5 replicates per location. Chambers were made using polypropylene containers, with a 100 mm diameter hole cut to allow access when attached to the substrata. The edge of the chamber was lined with a strip of flexible self-adhesive foam tape (12 mm thick, 19 mm wide, open cell polyurethane foam), to form a tight seal with the rocky substratum. Oysters around the selected cluster, which could prevent a proper water-tight seal, were carefully scraped using a paint scraper and/or a chisel. A tight seal along the edges of the filtration chamber was maintained over each patch by ensuring the substrata were naturally smooth and by tightly securing the chamber using eye-bolts and cable-ties (see figure S1). On pilings, chambers were secured using a ratchet strap (figure S1). Each chamber was carefully monitored throughout the filtration period to ensure no leaks were occurring. In the few occasions that water leaks were detected, the replicate in question was discarded and another cluster of oyster was chosen. Each filtration chamber was filled with 4 l of water from the location. The water was well-mixed at regular intervals (~ every 5 min, for 15 seconds) with an electric whisk. At the beginning of the experiment and after 30 min, 100 ml of water was sampled with a syringe. The samples were preserved with glutaraldehyde and stored in a −4 °C freezer. They were later slowly defrosted in a 38 °C waterbath, and particles were counted in 10 μm size classes between 10 and 100 μm (Lepesteur, Martin et al 1993). The number of particles per sample was determined and filtration rates calculated as the reduction in the number of particles over 30 min. All oysters present within each replicate were carefully removed and preserved with ethanol 70%. Oysters were then counted, measured (height and length) and weighed (wet and dry weight of the flesh). Dry weight of oyster flesh was weighed after drying each sample at 500 °C for 24 hours.
Invasibility
To investigate the role of artificial and natural habitats as habitat for NIS, all collected intertidal organisms were classified as native, non-indigenous or of unknown origin according to the literature. We then calculated the proportion of NIS on each structure.
Production rates
To compare the secondary productivity of assemblages (i.e. biomass accumulation) among habitats, 6 quadrats (10 × 10 cm) were cleared on each habitat (i.e. pilings, seawalls and natural reefs) at each location, using a paint scraper and a metal brush. Quadrats were marked using 6.5 mm rawl plugs drilled at two opposing corners of each quadrat. This was done in January 2015. After 6 months, a new set of quadrats was cleared, following the methodology described above. After a further 6 months, all organisms within both sets of quadrats were collected and transported to the laboratory. Samples were stored at −20 °C until processed. Total biomass (AFDW, g m−1) was determined for the standing-stock.
Statistical analyses
Univariate tests for differences in response variables according to Habitat and Location were tested with generalized linear mixed models (GLMMs) using the lme4 package [57] in R v.3.0.1. Habitat was a fixed factor, and Location was random. Locations were nested within Habitat. We assumed Poisson distributions for all measurements of count, but when there was significant overdispersion, we used negative binomial. We assumed gamma distributions for measurements of size of oysters. P-values were obtained with Likelihood Ratio Test (LRT) [58]. For biomass measurements, we used the Tweedie distribution in the cplm package. All post-hoc tests were done using the package multcomp in R v.3.0.1.
For comparisons of filtration rates among habitats, we assumed Poisson distributions (i.e. number of particles consumed by the oysters). We did two different analyses to test for differences in filtration rates among habitats. In the first analysis, we accounted for influences of initial number of particles in the water and biomass of oysters on filtration rates within each chamber when comparing habitats and locations by including these variables in the GLMMs. That way, we were considering the 'net' filtration rate in each habitat. In the second analysis done, we compared filtration rates of oysters without taking into account any other variables (e.g. initial number of particles and biomass of oysters). This was done because oyster biomass and the initial number of particles in the water were correlated to habitat (see Results section). Therefore, in this analysis, we are considering the total amount of particles filtered per habitat. The abundance of oysters at each location and habitat was standardised by the total area (m2) of the container. Containers had an area of 0.025 m2 for seawalls and rocky shores and 0.021 m2 for pilings.
To determine any significant differences between treatments regarding relative abundance and composition of assemblages, multivariate analyses were done using PERMANOVA in PRIMER 6 [59]. Analyses were run using two different similarity matrices: Bray-Curtis on untransformed data and Jaccard dissimilarities. When run on untransformed data, Bray-Curtis gives more weight to changes in species abundances, whereas Jaccard is based on changes in species composition (e.g. presence-absence) and does not take into account changes in species relative abundances [60]. When used in combination, these two measures of similarity allow the relative importance of changes in species abundances or composition to be assessed. For all analysis, we used 9999 permutations under a reduced model [59].
Results
Comparing diversity, functional groups and standing stock among habitats
A total of 16 361 specimens from 112 taxa were sampled from 54 quadrats during surveys (January 2014) to compare assemblage structure among habitats (table 1). During our surveys, we found a total of 88 taxa in rocky reefs compared with 70 taxa found on pilings and 60 on seawalls (table 1). Differences were not, however, significant (supplementary table 1 available at stacks.iop.org/ERL/13/014009/mmedia).
Table 1. List of the taxa found in the intertidal epibenthic assemblages in Sydney Harbour during our survey and from the literature at each type of habitat (pilings, seawalls or natural reefs) and their classification status as Native (N), Non-Indigenous Species (NIS) and Unknown origin (U).
| Taxa | Pilings | Seawalls | Rocky shore | Reference |
|---|---|---|---|---|
| Polychaetes | ||||
| Capitella sp. | U | Cole et al 2007 | ||
| Capitellid 1 | U | Survey | ||
| Chrysopetalum debile | N | Cole et al 2007, 2009 | ||
| Cirratulid 1 | U | U | Survey, Bugnot et al 2015 | |
| Cirriforma sp. | U | Cole et al 2007 | ||
| Exogone gambiae | N | Cole et al 2009 | ||
| Galeolaria caespitosa | N | N | Survey, Chapman and Bulleri 2003, Blockley and Chapman, 2007, Blockley and Chapman, 2008, Blockley 2007, Bulleri 2005a, Bulleri et al 2005, Cole et al 2009, Archambault et al 2001 | |
| Hydroides elegans | NIS | NIS | Survey, Blockley and Chapman 2007 | |
| Lepidonotus melanogrammus | N | Cole et al 2007 | ||
| Neanthes biseriata | N | Cole et al 2007, 2009 | ||
| Nereid 1 | U | U | U | Survey |
| Nereid 2 | U | U | U | Survey |
| Nereid 3 | U | U | Survey | |
| Onuphid 1 | U | U | Survey | |
| Orbinid 1 | U | U | U | Survey |
| Perinereis amblyodonta | N | Cole et al 2007, 2009 | ||
| Polycirris rosea | N | Cole et al 2007 | ||
| Polynoid 1 | U | U | U | Survey |
| Polynoid 2 | U | Survey | ||
| Polynoid 3 | U | Survey | ||
| Polyophtalmus pictus | N | Cole et al 2007 | ||
| Sphaerosyllis hirsuta | N | Cole et al 2007, 2009 | ||
| Erinaceusyllis serratosetosa | N | Cole et al 2009 | ||
| Spirobid aggregation | N | N | Survey, Chapman and Bulleri 2003, Bugnot et al 2014 | |
| Syllid 1 | U | U | U | Survey |
| Syllid 2 | U | U | U | Survey |
| Syllid 3 | U | Survey | ||
| Syllis prolifera | N | Cole et al 2007, 2009 | ||
| Syllis variegata | N | Cole et al 2007, 2009 | ||
| Terebellid 1 | U | U | U | Survey |
| Terebellid 2 | U | U | Survey | |
| Sipunculida | ||||
| Phascolosoma noduliferum | N | N | Survey | |
| Thermiste sp | U | U | U | Survey |
| Ascidiacea | ||||
| Pyura praeputialis | N | N | N | Survey, Chapman and Bulleri 2003, Goodsell 2009, Chapman et al 2005 |
| Pycnogonida | ||||
| Pycnogonid 1 | U | Survey | ||
| Cirripedia | ||||
| Ibla quadrivalvis | N | N | N | Survey, Blockley and Chapman 2006, Blockley and Chapman, 2008 |
| Tesseropora rosea | N | N | N | Survey, Chapman and Bulleri 2003, Blockley and Chapman 2006, Blockley and Chapman, 2008, Bulleri et al 2005, Archambault et al 2001 |
| Chamaesipho tasmanica | N | N | Survey | |
| Chthamalus antennatus | N | N | Survey, Chapman and Bulleri 2003, Blockley and Chapman 2006, Browne and Chapman 2014 | |
| Tetraclitella purpurascens | N | N | N | Survey, Blockley and Chapman 2006, Blockley and Chapman, 2008, Blockley 2007 |
| Balanus trigonus | N | N | Survey | |
| Elminius modestus | N | Survey | ||
| Austrobalanus imperator | N | N | Survey, Blockley and Chapman 2006, Blockley and Chapman, 2008, Blockley 2007 | |
| Balanus variegatus | N | N | Survey, Chapman and Bulleri 2003 | |
| Catomerus polymerus | N | Survey | ||
| Balanus amphitrite | N | Chapman and Bulleri 2003 | ||
| Hexaminius sp. | U | Chapman and Bulleri 2003 | ||
| Malacostraca | ||||
| Ampithoe sp 1 | U | Survey | ||
| Ampithoe sp 2 | U | U | Survey | |
| Cirolana harfordi | NIS | NIS | NIS | Survey, Bugnot et al 2014, Bugnot et al 2015 |
| Corophium sp | U | U | Survey, Bugnot et al 2015 | |
| Dynoides barnardii | N | N | Survey, Bugnot et al 2014, Bugnot et al 2015 | |
| Gnathiid 1 | U | Survey | ||
| Gnathiid 2 | U | U | Survey | |
| Halicarcinus ovatus | N | Survey | ||
| Hyalidae 1 | U | U | U | Survey |
| Hyalidae 2 | U | U | Survey | |
| Isopod 1 | U | U | Survey | |
| Isopod 2 | U | Survey | ||
| Nebaliid 1 | U | U | U | Survey |
| Ostracod 1 | U | U | Survey | |
| Ostracod 2 | U | Survey | ||
| Ostracod 3 | U | U | Survey | |
| Pachygrapsus laevimanus | N | N | Survey | |
| Paracerceis sculpta | NIS | NIS | NIS | Survey |
| Pilumnus tomentosus | N | Survey | ||
| Sesarma erythrodactyla | N | Bugnot et al 2015 | ||
| Tanaid 1 | U | U | Survey | |
| Tanaid 2 | U | U | U | Survey |
| Insects | ||||
| Chironimidae larvae | U | U | Bugnot et al 2014, Bugnot et al 2015 | |
| Bivalvia | ||||
| Cardita aviculina | N | Survey | ||
| Cassostrea gigas | NIS | NIS | Chapman and Bulleri 2003, Blockley and Chapman 2006, Chapman 2006 | |
| Glycymeris sp | U | Survey, Bugnot et al 2015 | ||
| Hiatella australis | N | N | Survey | |
| Irus sp | N | Bugnot et al 2015 | ||
| Irus crenatus | N | Chapman et al 2005 | ||
| Lasaea australis | N | N | N | Survey, Chapman 2006, Bugnot et al 2014, Bugnot et al 2015, Chapman et al 2005 |
| Musculus varicosus | N | Chapman et al 2005 | ||
| Musculus sp | N | N | Survey | |
| Mytilus galloprovincialis planulatus | N | N | N | Survey, Blockley and Chapman 2006, Blockley 2007, Browne and Chapman 2014, Chapman 2006, Chapman et al 2005 |
| Saccostrea glomerata | N | N | N | Survey, Chapman and Bulleri 2003, Blockley and Chapman 2006, Blockley and Chapman, 2008, Blockley 2007, Browne and Chapman 2014, Bulleri et al 2005, Chapman 2006, Cole et al 2009, Jackson et al 2008, Goodsell 2009 |
| Tapes dorsatus | N | Bugnot et al 2015 | ||
| Trichomya hirsuta | N | N | N | Survey, Bugnot et al 2015 |
| Venerupis galactites | N | Survey | ||
| Xenostrobus securis | N | Chapman et al 2005 | ||
| Gastropoda | ||||
| Afrolittorina acutispira | N | N | N | Survey, Chapman and Bulleri 2003, Chapman 2006, Bugnot et al 2015 |
| Alaba opinosa | N | Survey | ||
| Amphitalamus incidatus | N | Chapman et al 2005 | ||
| Astralium tentiformis | N | Chapman 2006 | ||
| Austochoclea juvenile | N | Survey | ||
| Austrocochlea porcata | N | N | Survey, Chapman and Bulleri 2003, Chapman 2006, Goodsell 2009, Chapman et al 2005 | |
| Austrocochleas concamerata | N | Bugnot et al 2015 | ||
| Bedeva hanleyi | N | N | Chapman 2003, Chapman 2006, Bugnot et al 2015, Chapman et al 2005 | |
| Bembicium nanum | N | N | Survey, Chapman and Bulleri 2003, Chapman 2006, Goodsell 2009 | |
| Bembicium sp | N | N | Survey, Bugnot et al 2015 | |
| Cabestana spengleri | N | N | Bulleri et al 2005, Chapman 2003, Chapman 2006 | |
| Cacozeliana granaria | N | Survey | ||
| Cellana tramoserica | N | N | Survey, Bulleri et al 2004, Chapman 2006, Archambault et al 2001, Klein et al 2011 | |
| Cantharidella picturata | N | Chapman 2006 | ||
| Cominella sp | U | Survey | ||
| Cypraeidae juvenile | U | Survey | ||
| Eatoniella atropurpurea | N | Chapman et al 2005 | ||
| Epitonium sp | N | Survey, Bugnot et al 2015 | ||
| Gastropoda: 'Tiny Spiral Shell' | U | Survey | ||
| Stomatella impertusa | N | Chapman 2003 | ||
| Hyatella australis | N | Bugnot et al 2015 | ||
| Herpetopoma aspersa | N | Survey | ||
| Littorina unifasciata | N | Archambault et al 2001 | ||
| Mitrella semiconvexa | N | Chapman 2006 | ||
| Mitrella sp | N | Survey | ||
| Montfortula rugosa | N | N | N | Survey, Blockley and Chapman 2006, Bulleri et al 2005, Chapman 2006, Archambault et al 2001, Bugnot et al 2015, Chapman et al 2005 |
| Morula marginalba | N | N | N | Survey, Chapman 2006, Jackson et al 2008, Bugnot et al 2015 |
| Nerita atamentosa | N | Survey, Bulleri et al 2005, Bugnot et al 2015 | ||
| Notoacmea flammea | N | N | N | Survey, Chapman 2006, Bugnot et al 2015, Chapman et al 2005 |
| Nudibranch 1 | U | Survey | ||
| Onchidella nigricans | N | N | N | Survey, Bulleri et al 2005, Bugnot et al 2015 |
| Onchidium deamelii | N | Chapman 2003 | ||
| Patelloida alticostata | N | Chapman 2006 | ||
| Patelloida latistrigata | N | N | Bulleri et al 2005, Chapman 2006, Archambault et al 2001, Klein et al 2011 | |
| Patelloidea mimula | N | N | N | Survey, Chapman and Bulleri 2003, Chapman 2006, Chapman et al 2005 |
| Patelloidea mufria | N | N | N | Survey, Chapman 2006, Chapman et al 2005 |
| Piramidellidae | U | U | Survey, Bugnot et al 2015 | |
| Pseudopisinna gregaria | N | Survey | ||
| Rissoella micra | N | Chapman et al 2005 | ||
| Scutellastra chapmani | N | N | Survey | |
| Scutus antipodes | N | Borowitzka 1972 | ||
| Siphonaria denticulata | N | N | N | Survey, Chapman and Bulleri 2003, Blockley and Chapman 2006, Blockley and Chapman, 2008, Blockley 2007, Bulleri et al 2005, Chapman 2006, Archambault et al 2001, Chapman et al 2005 |
| Siphonaria funiculata | N | N | Survey, Chapman and Bulleri 2003, Chapman 2006, Archambault et al 2001 | |
| Siphonaria juvenile | N | N | Survey, Chapman and Bulleri 2003 | |
| Thais orbita | N | N | Chapman and Bulleri 2003, Chapman 2006 | |
| Tugali cicatricosa | N | Chapman 2003 | ||
| Zeacumantus subcarinatus | NIS | Andrews et al 2010 | ||
| Polyplacophora | ||||
| Acanthochitona sp | N | N | N | Survey, Chapman 2006, Bugnot et al 2015, Chapman et al 2005 |
| Acanthochitona granostriata | N | Chapman and Bulleri 2003 | ||
| Acanthochitona retrojecta | N | Blockley et al 2007 | ||
| Chiton pelliserpentis | N | N | N | Survey, Blockley and Chapman 2006, Blockley and Chapman, 2008, Blockley 2007, Bulleri et al 2005, Chapman 2006, Bugnot et al 2015, Chapman et al 2005, Moreira et al 2007 |
| Ischnochiton (Haploplax) lentiginosus | N | Survey | ||
| Plaxiphora albida | N | Bugnot et al 2015 | ||
| Platyhelminthes | ||||
| Notoplana australis | N | N | N | Survey, Bugnot et al 2014, Bugnot et al 2015 |
| Flatworm 1 | U | U | Survey | |
| Echinodermata | ||||
| Parvulastra exigua | N | N | Survey, Chapman and Bulleri 2003, Chapman et al 2005 | |
| Patiriella calcar | N | Chapman 2003 | ||
| Coscinasterias calamaria | N | Chapman 2003 | ||
| Brittle Star 1 | U | Survey | ||
| Brittle Star 2 | U | Survey | ||
| Brittle Star 3 | U | Survey | ||
| Heliocidaris erythrogramma | N | Chapman 2003, Borowitzka 1972 | ||
| Cnidaria | ||||
| Actinia tenebrosa | N | N | Survey, Chapman and Bulleri 2003, Chapman 2003 | |
| Oulactis mucosa | N | N | Chapman and Bulleri 2003, Chapman 2003 | |
| Cnidopus verater | N | Chapman 2003 | ||
| Anthothose albocincta | N | Chapman 2003 | ||
| Corynactis australis | N | Chapman 2003 | ||
| Ectoprota | ||||
| Watersipora subtorquata | NIS | NIS | NIS | Survey, Chapman et al 2005 |
| Cryptosula pallasiana | NIS | NIS | Survey, Chapman et al 2005 | |
| Branched bryozoa | U | Survey | ||
| Conopeum seurati | NIS | Chapman et al 2005 | ||
| Fenestrulina mutabilis | N | Chapman et al 2005 | ||
| Beania sp | U | Chapman et al 2005 | ||
| Porifera | ||||
| Porifera spp | U | U | U | Survey, Chapman and Bulleri 2003 |
| Chlorophyta | ||||
| Ulva australis | N | N | N | Survey |
| Ulva compressa | N | N | N | Survey |
| Ulva lactuca | NIS | NIS | Blockley and Chapman 2006, Blockley 2007, Chapman and Blockley, 2009, Archambault et al 2001, Chapman et al 2005 | |
| Ulva intestinalis | N | Blockley and Chapman 2006, Blockley 2007, Chapman and Blockley, 2009, Chapman et al 2005 | ||
| Chaetomorpha aurea | U | Archambault et al 2001, Glasby et al 2007 | ||
| Chaetomorpha spp | U | U | Chapman and Bulleri 2003, Blockley 2007, Chapman et al 2005 | |
| Caulerpa filiformis | N | Chapman and Bulleri 2003 | ||
| Codium fragile | U | U | Chapman and Bulleri 2003, Chapman et al 2005 | |
| Cladophora sp. | U | U | Blockley 2007, Chapman and Blockley, 2009, Archambault et al 2001, Chapman et al 2005 | |
| Bryopsis sp. | U | Blockley 2007, Chapman et al 2005 | ||
| Green mat | U | U | Survey | |
| Rhodophyta | ||||
| Antithamnion sp. | U | Chapman et al 2005 | ||
| Capreolia implexa | N | Chapman and Bulleri 2003 | ||
| Ceramium sp. | U | U | Archambault et al 2001, Chapman et al 2005 | |
| Champia compressa | N | Chapman and Bulleri 2003 | ||
| Champia sp | U | Chapman et al 2005 | ||
| Corallina officinalis | N | N | Survey, Blockley and Chapman 2006, Blockley and Chapman, 2008, Blockley 2007, Chapman and Blockley, 2009, Cole et al 2009, Archambault et al 2001, Chapman et al 2005 | |
| Dasya sp | U | Chapman et al 2005 | ||
| Dictyothamnion sp. | U | Archambault et al 2001 | ||
| Gelidium pusillum | N | N | N | Survey, Chapman and Bulleri 2003, Bulleri et al 2005, Chapman and Blockley, 2009, Archambault et al 2001, Chapman et al 2005 |
| Gigartina sp. | U | Archambault et al 2001 | ||
| Gracilaria sp. | U | U | Archambault et al 2001, Chapman et al 2005 | |
| Grateloupia filicina | N | Chapman and Bulleri 2003 | ||
| Grateloupia sp | U | Chapman et al 2005 | ||
| Griffithsia monilis | N | Chapman et al 2005 | ||
| Herposiphonia calva | N | Coleman 2002 | ||
| Herposiphonia sp | U | Chapman et al 2005 | ||
| Hildenbrandia rubra | N | N | N | Survey, Chapman and Bulleri 2003, Blockley and Chapman 2006, Blockley 2007, Browne and Chapman 2014, Bulleri 2005a, 2005b, Bulleri et al 2005, Archambault et al 2001, Goodsell 2009 |
| Hypnea sp | U | Chapman et al 2005 | ||
| Laurencia botryoides | N | Archambault et al 2001 | ||
| Laurencia pannosa | N | Archambault et al 2001 | ||
| Laurencia sp | U | Chapman and Bulleri 2003, Chapman et al 2005 | ||
| Lomentaria sp | U | Chapman et al 2005 | ||
| Polysiphonia spp | U | U | Archambault et al 2001, Chapman et al 2005 | |
| Porphyra columbina | N | N | Chapman and Bulleri 2003, Chapman and Blockley, 2009, Chapman et al 2005 | |
| Pterocladiella capillacea | N | Chapman and Bulleri 2003, Archambault et al 2001 | ||
| Red leaf | U | Survey | ||
| Rhodymenia australis | N | N | Chapman and Bulleri 2003 | |
| Phaeophyta | ||||
| Colpomenia sinuosa | NIS | NIS | Chapman and Bulleri 2003, Coleman 2002, Archambault et al 2001, Chapman et al 2005 | |
| Ectocarpus sp. | N | N | Archambault et al 2001, Chapman et al 2005 | |
| Endarachne binghamiae | N | N | Browne and Chapman 2014, Bulleri 2005a, 2005b, Chapman and Blockley, 2009, Chapman et al 2005 | |
| Hormosira banksii | N | Bulleri et al 2005 | ||
| Padina fraseri | N | Chapman and Bulleri 2003 | ||
| Petalonia fascia | N | Borowitzka 1972, Archambault et al 2001 | ||
| Ralfsia verrucosa | N | N | Browne and Chapman 2014, Bulleri 2005a, 2005b, Bulleri et al 2005, Chapman and Blockley, 2009, Archambault et al 2001 | |
| Sargassum spp | U | U | Archambault et al 2001, Chapman et al 2005 | |
| Zonaria sp | N | N | Survey, Bulleri et al 2005 | |
| Dictyota sp | U | Chapman et al 2005 | ||
| Total Number of taxa | 70 | 113 | 162 | |
| Total number of unique taxa | 5 | 33 | 70 | |
| Total number of NIS taxa | 4 | 9 | 8 | |
| Percentage of NIS taxa | 5.7 | 8.0 | 4.9 | |
| Total number of native taxa | 38 | 64 | 107 | |
| Percentage of native taxa | 54.3 | 56.6 | 66.0 |
⁎⁎Note, Blockley, 2007; Chapman and Blockley 2006, 2008, Blockley et al 2007, Browne and Chapman, 2014, Chapman and Blockely 2009, Chapman et al 2005, Klein et al 2011 only sampled seawalls. ⁎⁎⁎⁎Note Borowitzka 1972, Cole et al 2007, 2009, Coleman 2002, Archambault et al 2001, Andrews et al 2010 only sampled rocky shores
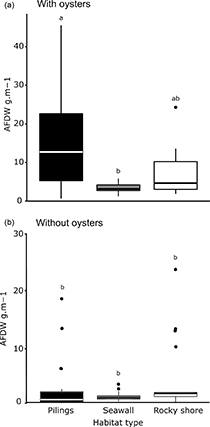
Figure 2. Box plot of the total biomass of organisms (AFDW), including (a) and excluding (b) oysters, found in each type of habitat. Small letters denote significant differences. The box plots show the median value of the variable measured, the second and third quartiles (horizontal lines) and the minimum and maximum values of data found (vertical lines).
Download figure:
Standard image High-resolution image
Figure 3. Box plots of the abundance of main functional groups in each type of habitat (pilings, seawalls, rocky shores). (a) Grazers; (b) scavengers; (c) filter-feeders and (d) predators. Small letters denote significant differences.
Download figure:
Standard image High-resolution image
Figure 4. nMDS of the relative abundance (left) and presence and absence (right) of species of intertidal epibenthic assemblages on pilings (black), seawalls (grey) and rocky shores (white). Different symbols represent different locations within each type of habitat.
Download figure:
Standard image High-resolution image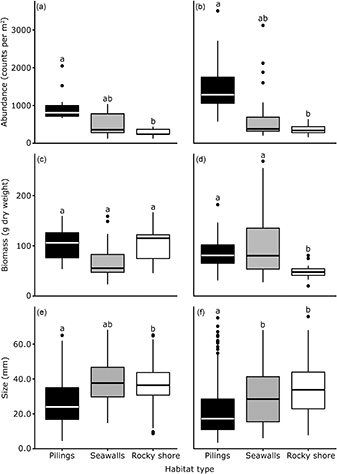
Figure 5. Box plots of the abundance (a) and (b), biomass (c) and (d) and size (e) and (f) of oysters at each type of habitat at two sampling times. Small letters (above the box plots) denote significant differences.
Download figure:
Standard image High-resolution image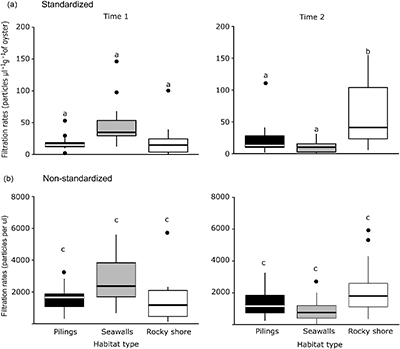
Figure 6. Box plots of the filtration rates of oysters, standardised by oysters' biomass (dry wt/m2) and initial number of particles in the water (a), and non-standardised (b), per m2 at each type of habitat and sampling time. Small letters denote significant differences.
Download figure:
Standard image High-resolution image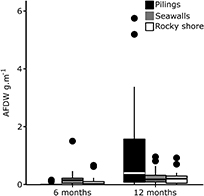
Figure 7. Box plot of the secondary productivity at each type of habitat. Ash-free dry weight (AFDW; g. m−1) on the scraped plots after 6 and 12 months at each type of habitat.
Download figure:
Standard image High-resolution image
We found 25 papers in our literature review done in intertidal areas of Sydney Harbour, spanning from 1972−2015 (table 1). Studies varied greatly regarding their sampling effort and methodology. Furthermore, our study was the first to sample intertidal pilings within Sydney Harbour. Although total taxa numbers differed, patterns from the literature review were similar to our surveys and showed that rocky reefs are generally more diverse than artificial habitats, with 162 taxa, followed by seawalls, with 113 taxa. Differences in the total number of taxa found between our survey and the literature review are likely related to the overall greater sampling effort represented by the literature review and in differences regarding the target assemblages sampled [e.g. 30, 61]. For instance, Chapman [30] sampled a total of 800 non-destructive quadrats in seawalls and rocky reefs of Sydney Harbour, compared to 36 quadrats destructively sampled here on these habitats. In contrast, Bugnot et al [62] specifically targeted biogenic habitats (e.g. oyster and mussel beds) in their sampling efforts on rocky shores and seawalls (n ~ 27 per type of biogenic habitat). Despite these differences in the methodology used and sampling intensity, results from our surveys reflect the general patterns found in the literature review, indicating that surveys done here accurately reflect patterns in the assemblages found on artificial and natural habitats in Sydney Harbour.
In our surveys, we found that intertidal rocky shores harboured 26 unique taxa (≈ 30%) while 5 and 9 taxa were exclusive to pilings and seawalls, respectively (≈ 7% and 13%, respectively; table 1). These patterns were supported by the literature review, with 70 unique taxa (or 43%) exclusive to rocky shores compared to 33 (or 29%) on seawalls (table 1).
Pilings supported a greater total biomass (1510 g m−2 on average) than rocky shores (676 g m−2) and seawalls (289 g m−2) (LRT Chisq = 8.45; df = 2; p < 0.05; supplementary table 1, figure 2(a)), which was mainly driven by oyster abundance. When these organisms were excluded from the analyses, there were no differences in biomass among habitats (LRT = 4.66; df = 2; p > 0.05; figure 2(b)).
Abundances of dominant taxonomic groups also differed in surveys of different habitats. Specifically, intertidal mobile species such as gastropods and polychaetes were significantly more abundant on rocky shores than on pilings or seawalls (LRT Chisq = 10.33 and 8.64, respectively; df = 2; p < 0.01; supplementary table 1, figure S2). Similar patterns were found for the biomass of these animals (figure S3); with rocky shores supporting more gastropod and polychaete biomass (69 g m−2 and 7.5 g m−2 on average, respectively) than seawalls (15 g m−2 and 3.2 g m−2, respectively), and pilings (8 g m−2 and 0.5 g m−2). In contrast, barnacles were most abundant and accounted for more biomass on seawalls, followed by pilings and rocky shores (LRT Chisq = 8.47; df = 2; p < 0.01; supplementary table 1, figures S2 and S3). We found a total of 7 algal species in natural rocky shores and 5 species in seawalls and pilings (table 1). There were no differences in the algal biomass found in each habitat (supplementary table 1; figure S3).
Abundances of surveyed functional groups also differed among habitats (supplementary table 1; figure 3). Grazers were, on average, at least 40% more abundant on rocky shores than on artificial habitats (figure 3(a)). Pilings had the least amount of grazers (LRT Chisq = 30.41; df = 2; p < 0.001; figure 3(a)), while scavengers, e.g. isopods, were most abundant on seawalls (LRT Chisq = 11.71; df = 2; p < 0.01; supplementary table 1; figure 3(c)). This reflected results from our literature review (table 1). Grazers, for example, were at least 50% more diverse, in terms of number of species, on rocky shores than on artificial habitats (table 1). There were no differences in the abundance (LRT Chisq = 0.42; df = 2; p > 0.05; supplementary table 1, figure 3(b)) or number of species of filter-feeders among habitats found in our survey—with 19, 20 and 17 species found on pilings, rocky shores and seawalls, respectively (table 1).
There were major differences in species assemblages among habitats, regardless of differences in locations. The relative abundance of species (Bray-Curtis; pseudo-F2,6 = 2.5; p < 0.01) and composition (presence/absence; Jaccard; pseudo-F2,6 = 2.1; p < 0.05) of intertidal seawall assemblages differed significantly from pilings or reefs (figure 4). Dispersion analyses (PERMDISP) showed that abundances of species on seawalls were also more homogeneous than on rocky shores or pilings (F2, 51 = 25, p < 0.01).
Density, biomass and size of oysters
Oysters were significantly more abundant on pilings (952 ind m−2, on average) than on rocky shores (271 ind m−2) or seawalls (512 ind m−2) (supplementary table 2; figures 5(a) and (b)). However, these animals were significantly smaller on pilings than on the other habitats (LTR Chisq = 23; df = 2; p < 0.001; figures 5(e) and (f); figure S4). Dry weight of oyster flesh on seawalls was approximately 30% less than on rocky shores and pilings at the first time of sampling (although no significant differences were found), while rocky shores had significantly less dry weight of oysters during the second time of sampling (LTR Chisq = 6.4; df = 2; p < 0.05; figures 5(c) and (d)).
Filtration rates
Oyster filtration rates increased in relation to particulate matter in the water column (F1, 37 = 59.2; p < 0.05; R2 = 0.6, figure S5). The number of particles in the water varied with time and type of habitat, with more particles in the water around seawalls when compared to other habitats at the first time of sampling (LRT Chisq = 10.8; df = 2; p < 0.01). No differences in the number of particles among the different habitats were found for the second sampling time (LTR Chisq = 3.5; df = 2; p > 0.05).
The total amount of particles filtered by oysters did not differ among habitats (supplementary table 2; figure 6). However, when analyses were done after accounting for initial number of particles in the water and oyster biomass, filtration rates varied in time and per type of habitat. Filtration rates were greater on seawalls than on pilings or rocky shores at the first time of sampling (supplementary table 2; figure 6). In contrast, at the second time of sampling, rocky shores had significantly higher filtration rates than seawalls or pilings (supplementary table 2; figure 6).
Invasibility
In our survey, we found 9 non-indigenous species (NIS) in total (≈ 8% of the total number of species found). Results of the literature review found the proportion of total NIS was slightly lower, ≈ 4%, with 9 NIS, out of 209 taxa (table 1). Results from the literature review revealed that seawalls had almost twice the proportion of NIS (8%), compared to natural rocky reefs (4.9%) and pilings were intermediate (5.7% of species richness). Most NIS were colonial bryozoans (Watersipora subtorquata, Conopeum seurati, and Cryptosula pallasiana), but also included a polychaete (Hydroides elegans), the isopod Cirolana harfordi, the gastropod Zeacumantus subcarinatus, and the algae Colpomenia sinuosa and Ulva lactuca (table 1).
Secondary productivity
The secondary productivity of pilings, represented here by total biomass accumulated (as AFDW), was significantly greater than rocky shores or seawalls, but only after 12 months (LTR Chisq = 34.35; df = 2; p > 0.001; figure 7). This is probably due to the high recruitment of oysters to these habitats (figure S4).
Discussion
We showed that although natural rocky shores had 25% more taxa than pilings, pilings supported greater overall secondary productivity than the other habitats after 12 months. In addition, differences observed in the size and abundance of oysters among habitats were not reflected by the filtration rates of these organisms. This study further highlights the complexity of the diversity-function relationship as the magnitude, direction and type of function affected cannot be directly inferred from structural measurements (i.e. diversity and abundance). We stress, therefore, the importance of directly measuring functional properties of systems, instead of simply inferring functional consequences based solely on structural measurements [42].
Water quality in coastal systems is supported by functional groups such as bivalves that have the capacity to filter particulate matter from the water column [63, 64]. Oysters are one of the main filter-feeding bivalves in the intertidal zones of Sydney Harbour [50, 51] and we found that their filtration capacity was not related to changes in their structural traits (i.e. size and abundance) between natural rocky shores and urban structures. Specifically, oysters were consistently more abundant on pilings than on rocky shores, but were also smaller. In contrast, in situ filtration rates did not vary among habitats. It is likely therefore that the highest abundance of oysters on pilings are compensating for the smaller size of animals on these structures, so no net changes were observed in the community filtration rates among habitats. This disjunct between structural and functional properties may be occurring because of differential responses to drivers associated with the habitats [e.g. 65]. Observed differences in oyster size could be due to differing recruitment, age and slope of habitats, competition for space among habitats or work maintenance of these artificial structures, e.g. regular cleaning would mean only young, small, oysters could persist [66] and can vary according to the studied place. Theuerkauf et al [67], for instance, found 3 to 8 times more oysters on natural reefs when compared to hardened shorelines, while Drexler et al [68] found that mean oyster density was greater on seawalls than on natural reefs. Filtration rates, on the other hand, could be more closely linked to water flow and wave exposure since wave energy and water circulation around pilings, seawalls and rocky reefs are likely to differ [69, 70], influencing the amount and quality of particles in the water and the filtration efficiency of the animals. Although the drivers require further investigation, our results highlight that impacts of ocean sprawl can manifest differentially through both structural and functional changes with the potential to affect the provision of services, e.g. clean water.
Primary production is another important supporting service provided by natural systems that is closely linked to local abundance and identity of local functional groups. Surveys in Sydney Harbour revealed that algae were more diverse on natural rocky shores and seawalls than on pilings. This could have consequences for the primary production capacity of the system, but will depend, among other things, on the identity of grazers and algal species as well as their photosynthetic efficiency. Total productivity, for instance, might not change with changes in diversity, due to compensatory mechanisms of the system [e.g. 71]. One species might compensate for the loss or decreased abundance of another species with similar functional role(s) (i.e. 'insurance hypothesis') [72]. Nevertheless, such changes might have other functional consequences that are not necessarily productivity. For example, the loss of algal diversity might have impacts on the trophic web, which, in turn, can have a series of further impacts on the system. Airoldi and Bulleri [66] found that frequent maintenance work on breakwalls in the Mediterranean was favouring the abundance of opportunistic macro-algae to the detriment of mussels, which could result in increases of particular functions of these habitats (e.g. the primary productivity) and a decrease of others (e.g. filtration capacity).
Apart from having bottom-up effects on natural communities through changes to autotrophs such as algae, urban structures can also influence top-down pressures if functionally important groups of grazers and scavengers are affected [e.g. 73]. We found that rocky shores had, on average, 40% and 70% more grazers than seawalls and pilings, respectively. Scavengers, on the other hand, were approximately 8 times more abundant on seawalls than on pilings or rocky shores. Grazers were 2 times more diverse on rocky shores (with 32 species) when compared to seawalls (16 species) and pilings (13 species). Such diversity changes at particular trophic level may lead to a variety of potential responses for processes at other levels, [74], influencing important attributes of the systems, e.g. resilience, nutrient cycling [75].
We also found greater secondary productivity on pilings compared with natural rocky shores or seawalls. In general, higher diversity of primary producers (e.g. plants and algae) is expected to stimulate secondary productivity [76], but the mechanisms driving these feedbacks are complex and context-dependent. Here, differences observed were driven by the higher number of oysters on pilings, but further studies are necessary to elucidate the mechanisms behind this pattern.
Urbanisation has also been shown to impact natural ecosystems through the homogenisation of assemblages [4]. We found that natural rocky shores supported > 50% more unique taxa than urban structures, reflecting findings from previous studies [15, 30, 77]. Furthermore, we observed at least 20% more non-indigenous species (NIS) on pilings and seawalls when compared to natural habitats in Sydney Harbour, which is consistent with previous predictions [see review by 56]. The increased construction of infrastructure providing novel habitat has been shown to increase the niche availability for NIS, facilitating their establishment and spread [20–22, 78]. The functional consequences of these introductions will mainly depend on whether NIS are replacing species with different functional roles and how dominant they become in the 'new' system. This does not seem to be the case here, where most NIS were represented by bryozoans, which had low abundance, in general. Regardless, invasive species represent a major global source of biodiversity loss and economic costs—estimated to be up to $120 billion per year in the US alone [79]. Increasingly, management strategies such as eco-engineering and timing of maintenance are being used to build invasion resistance of marine infrastructure through physical, chemical and biological manipulations of structures [80].
Conclusion
This is one of the first studies to assess how changes in diversity directly relate to changes in ecosystem properties and functions of artificial and natural habitats. The ongoing expansion of urban developments into marine environments means there is increasing urgency to improve our understanding of the full ecological implications of these demographic and developmental trends. Ocean sprawl was associated with important structural and functional differences in coastal communities, including functional group diversity and distribution, the size distribution of key habitat-forming organisms, secondary productivity, and invasibility. Interestingly, the altered size structure of oysters as well as their patterns of abundance on artificial structures did not affect community filtration rates compared to natural habitats. Functional measures of secondary productivity and invasibility also differed between artificial and natural habitats. This study highlights the important ecological consequences of marine artificial structures and the need to directly measure functional attributes to fully understand the magnitude of impacts of marine urbanisation. Our study provides context and methodology for functional measures, invasibility, secondary productivity and filtration rates, to be incorporated into the monitoring programs of harbours, coastal and offshore systems. This is particularly important to understand the consequences of ocean sprawl in different locations and to manage future marine infrastructure with environmental impact assessments. The results also have direct relevance to managers of urban coastal systems seeking to implement eco-engineering designs with the aim to maintain and/or increase services, which are underpinned by ecosystem functioning, e.g. water quality. While these designs have untapped potential to mitigate impacts from infrastructure and increase human well being, they require clear goals with foundations built from a deeper understanding of the functional properties of these artificial habitats.
Authors' contributions
MMP, VJC, ELJ, LA, TMG and KAD conceived the ideas and designed the surveys. MMP, VJC, AB, HH and KAD collected the data. MMP did the literature review and analysed the data. MMP and KAD led the writing of the manuscript. All authors contributed critically to the drafts and gave final approval for publications.
Data accessibility
Data from the literature review is available in table 1. All data is available through UNSW's ResData portal.
Acknowledgments
We thank everyone that helped with fieldwork and with the processing of samples and photos. Keryn Bain and Janine Ledet helped with the figures and Keryn also helped with the statistical analyses. Mayer-Pinto, Johnston, Bugnot and Dafforn were supported by an ARC Linkage Grant (LP140100753) awarded to Dafforn and Johnston. Airoldi was supported from projects MERMAID (EU FP7—Ocean—2011- 288710) and 'TETRIS—Observing, modelling and Testing synergies and trade-offs for the adaptive management of multiple impacts in coastal Systems' (PRIN 2011, Italian Ministry of Education, University and Research).