

Abstract
The Ethiopian economy and population is strongly dependent on rainfall. Operational seasonal predictions for the main rainy season (Kiremt, June–September) are based on statistical approaches with Pacific sea surface temperatures (SST) as the main predictor. Here we analyse dynamical predictions from 11 coupled general circulation models for the Kiremt seasons from 1985–2005 with the forecasts starting from the beginning of May. We find skillful predictions from three of the 11 models, but no model beats a simple linear prediction model based on the predicted Niño3.4 indices. The skill of the individual models for dynamically predicting Kiremt rainfall depends on the strength of the teleconnection between Kiremt rainfall and concurrent Pacific SST in the models. Models that do not simulate this teleconnection fail to capture the observed relationship between Kiremt rainfall and the large-scale Walker circulation.
Export citation and abstract BibTeX RIS

Original content from this work may be used under the terms of the Creative Commons Attribution 3.0 licence.
Any further distribution of this work must maintain attribution to the author(s) and the title of the work, journal citation and DOI.
1. Introduction
Ethiopia's fast-growing economy is heavily dependent on the climate sensitive sectors of agriculture, water, energy, health, trade and infrastructure. Agriculture is one of the main branches of economy, which provides employment for 85% of the Ethiopian population (CIA 2017). Yet the agricultural activity in most parts of the country is highly dependent on the performance of seasonal rainfall. Especially in rural regions, the population is heavily dependent on rain-fed farming (Cheung et al 2008). In combination with population growth (CIA 2017) and possibly rainfall decrease (Cheung et al 2008, Funk et al 2012), Ethiopian society can greatly benefit from reliable seasonal forecasts.
Table 1. List of CGCMs that provided the seasonal predictions used in this study.
| MODEL | Atmosphere | Ocean | Reference |
|---|---|---|---|
| CCCMa-CanCM4 (here: CC4) | CanAM4 (T63L35) | CanOM4 (100kmL40) | Merryfield et al 2013 |
| Climate Forecast System (here: CFS) | GFS (T62L64) | MOM3 (1° × 1/3°L40) | Saha et al 2006 |
| ECMWF System-4 (here: ECM) | IFS (T255L91) | NEMO v3.0 (1° × 1°L42) | Molteni et al 2011 |
| MPI-ESM (here: MPI) | ECHAM6 (T63L47) | MPIOM (GR1.5L40) | Baehr et al 2015 |
| MRI-CGCM3 (here: JMA) | MRI-AGCM3 (TL95L40) | MRI.COM3 | Yukimoto et al 2012 |
| MIROC5 (here: MIR) | (T85L40) | (1.4° × 0.5–1.4°L50) | Watanabe et al 2010, Tatebe et al 2012 |
| POAMA2 (here: P_A, P_B, P_C) | BAM (T47L17) | ACOM2 (2° × 0.5–1.5°L25) | Yin et al 2011, Hudson et al 2013 |
| ECHAM5/MPI-OM (here: MP2) | ECHAM5 (T63L31) | MPIOM (GR1.5L40) | Keenlyside et al 2013 |
| NorESM (here: NOR) | CAM4-OSLO (1.9° × 2.5°L26) | MICOM-HAMMOC (0.5°−2°L53) | Bentsen et al 2013 |
Climate predictability on seasonal time scales has two main sources: persistence, and slow variability patterns like the El Niño Southern Oscillation (ENSO). On seasonal time scales, Ethiopian rainfall variability is mostly linked to sea surface temperatures (SST) in the Indian and Pacific Oceans (Gissila et al 2004, Hastenrath et al 2004, Korecha and Barnston 2007, Segele et al 2009, Diro et al 2011a, Endris et al 2016). In particular, a strong negative correlation between Ethiopian rainfall and tropical Pacific SST exists in the main rainfall season (Kiremt, June–September (JJAS)). In a previous study, we found that anomalous warm eastern Pacific SST in JJAS cause uplift over the central Pacific and thus drive an anomalous large-scale circulation with subsidence over East Africa. The overall subsidence over Ethiopia and related suppression of low-level moisture influx reduce Kiremt rainfall (Gleixner et al 2016).
The predictable ENSO phenomenon dominates Pacific SST variability on interannual time scales and is the main predictor of statistical predictions of Ethiopian rainfall (Beltrando and Camberlin 1993, Gissila et al 2004, Segele and Lamb 2005, Korecha and Barnston 2007). The operational forecasts of the National Meteorology Agency (NMA) of Ethiopia also rely on observed and predicted SST, and statistical approaches for the seasonal prediction of rainfall (Korecha and Sorteberg 2013). So far, rainfall predictions with dynamical models show little skill (Diro et al 2012, Jury 2014, Shukla et al 2016).
Due to advances in observation methods, assimilation techniques and climate models, SST forecasts have been improving continuously over recent decades and dynamical ENSO index predictions are competitive with statistical predictions (Kirtman and Pirani 2008, Council 2010). Nevertheless, rainfall predictions continue to provide a challenge for the seasonal prediction community (Kirtman and Pirani 2008). In this study we compare Kiremt rainfall predictions from 11 coupled general circulation models (CGCMs) to address the following questions:
- How well can state-of-the-art CGCMs predict Kiremt rainfall?
- Where do the large differences in model skill come from?
- Can the skill of direct CGCM predictions of Kiremt rainfall be improved by inferring rainfall variability from CGCM-predicted large-scale variability (e.g. ENSO variability)?
2. Data
2.1. CGCM seasonal hindcasts
We analyse seasonal hindcasts of 11 CGCMs (table 1). We use nine hindcast sets from the World Climate Research Programme's (WCRP) Climate Historical Forecast Project (CHFP). We choose the models that provide forecasts starting in the beginning of May for the time period 1985–2005 and cover the Kiremt season of JJAS. Although earlier lead times would give more time for response planning, May-start predictions are selected because they have higher prediction skill relative to earlier leads (Jury 2014). The Australian Bureau of Meteorology provided three sets of hindcasts of the POAMA model, which we treat as individual models, after ensuring that they differ in their mean circulation patterns (not shown) as well as prediction skill. The three setups differ as follows: P_C is the standard setup, as used for operational forecasts, P_A uses an alternative shallow convection parameterization, P_B is identical to P_A with additional atmosphere–ocean flux correction. A comparison of P_A and P_B would allow for an impression of the effect of flux correction, but that is not the purpose of this study. In addition to the CHFP models we include hindcasts from the Norwegian Earth System Model (NorESM) and ECHAM5/MPI-OM (MPI2). The 11 models vary strongly in resolution as well as in assimilation method (not listed), but our results indicate that these differences are not the dominant source of skill differences in Ethiopian rainfall predictions.
Since the SST was not available from the CHFP models, we use surface temperature (TS) and validate it with observed SST over ocean only. We analyze seven ensemble members of each model and present the ensemble average of each model as well as the multi-model average in the following figures. The data is available on a 2.5° × 2.5° grid and supplementary figure 1 available at stacks.iop.org/ERL/12/114016/mmedia shows the grid boxes used for the All-Ethiopian average rainfall.
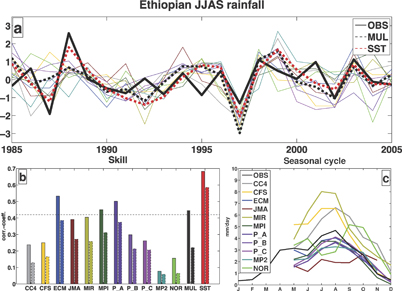
Figure 1. (a) Standardized JJAS All-Ethiopian rainfall from 1985 to 2005 in observations (black solid), 11 CGCM predictions (thin lines), the multi-model prediction (black dotted) and SST based prediction (red dotted). (b) Correlation between observed and predicted JJAS ALL-Ethiopian rainfall between 1985–2005 for 11 CGCM predictions, the multi-model prediction (black) and SST based prediction (red) for the ensemble mean (left columns) and the average of the individual ensemble members (right column). The horizontal dashed line mark the 95% significance level. (c) The annual cycle of monthly ALL-Ethiopian rainfall between 1985 and 2005 in observations (black) and the May-start predictions of the 11 CGCMs in mm day−1.
Download figure:
Standard image High-resolution image2.3. Validation data
We compare the seasonal hindcasts of JJAS rainfall in Ethiopia with blended rainfall observations (Dinku et al 2014). These observations are based on in situ measurements from over 500 NMA rain gauges within Ethiopia. The station data is interpolated with satellite estimates from the TARCAT (TAMSAT African Rainfall Climatology And Time-series) version 2 from the TAMSAT (Tropical Applications of Meteorology using SATellite data and ground-based observations) research group (Maidment et al 2014). Here we use rainfall data at 717 points (see supplementary figure 1), which are unevenly distributed over Ethiopia and capture the wide range of inhomogeneous rainfall regions within the country. We are interested in the large-scale effect on Kiremt rainfall, and therefore only consider the All-Ethiopian seasonal average. The variability of the All-Ethiopian rainfall is dominated by rainfall in central and northwest Ethiopia, which receives the bulk of JJAS rainfall.
For validation of the TS hindcasts we use the Extended Reconstructed Sea Surface Temperature version 3b (ERSSTv3b) dataset, which is based on in situ measurements and available on a 2° grid. ERSSTv3b is constructed as the ERSSTv3 (Smith et al 2008), but excludes satellite SST data that caused a cold bias.
3. Results
3.1. Rainfall prediction skill
The multi-model prediction—the average of all models and ensemble members—of Ethiopian summer rainfall provides an overall impression of the climate model skill. The time series of the multi-model JJAS Ethiopian rainfall (black dotted line) agrees with observations (black line) reasonably well, with anomalies of the same sign in the most extreme years (figure 1(a)). The correlation between JJAS rainfall predicted by the multi-model and observations is 0.45. The individual models vary strongly in skill. We compare the average prediction skill of the individual ensemble members of all models, as well as their ensemble mean prediction skill. The first is the basis for the later analysis, as it allows fair comparison of simulated and observed relations (observations being only one representation of reality). For all models the ensemble average rainfall predictions have higher skill than the corresponding individual ensemble members on average (figure 1(b)). This is to be expected, as ensemble averaging increases the signal to noise ratio by averaging out internal variability of the single runs. The skill of the individual model (ensemble mean) rainfall predictions reach correlations from 0.08 to 0.53, which agrees with the finding of Jury (2014) for JJA predictions for the Ethiopian highlands. Only three models (ECM, P_A and MPI) show a correlation significantly different from 0 (5% significance level) when the ensemble mean performance is considered. They beat the multi-model prediction skill of 0.45, which is hampered by including a number of models with virtually no skill. If we exclude these models and consider a multi-model consisting only of ECM, P_A and MPI, we find a correlation of 0.57 with observations, which beats all individual systems. This comes as no surprise, as multi-model predictions based on systems of similar skill usually score higher skills than individual models and the result is more robust (Palmer et al 2016, Hagedorn et al 2005, Gleckler et al 2008, Kirtman and Pirani 2008).
One reason for low skill may be mean biases. However, while the seasonal cycles of Kiremt rainfall in the 11 models show a large spread in the rainfall bias (figure 1(c)), the bias seems unrelated to the prediction skill. As an example, the model with the strongest bias (MIR) has medium skill, while P_C has very little bias and very little skill. The seasonality of the rainfall is simulated realistically in most models. NOR is an exception with a bimodal seasonality instead of a peak during Northern Hemisphere (NH) summer; it has very low prediction skill for this season. However, while a realistic seasonal cycle seems to be a requirement, it by no means guarantees a skillful Kiremt prediction. The MP2 prediction is an example of a model with a realistic seasonal cycle (albeit with a weaker amplitude than observations) of Ethiopian rainfall and yet it has the lowest prediction skill of the 11 models.
While the multi-model rainfall prediction shows promise with a correlation with observations of 0.45, we find higher skill in a simple SST-based prediction: A linear regression model based on the Niño3.4 index (section 3.2) from the multi-model prediction (figures 1(a) and (b) in red) gives a better reconstruction of the observed rainfall time series with a correlation of 0.68. Bootstrapping showed that the SST-based prediction is more skillful than the dynamical prediction with a likelihood of around 90%. However, the superior skill of the SST-based prediction is very much due to its superior prediction of the years 1987 and 1988. If we exclude those two years, there is no significant difference between the SST-based and the multi-model prediction. We get a correlation of observed JJAS rainfall and predicted JJAS rainfall of 0.54, while the correlation of observed rainfall and predicted Niño3.4 index is reduced to 0.55. For the individual models the skill with such an SST-based prediction ranges from 0.56 to 0.71 (supplementary figure 2(a)).
3.2. Kiremt–Pacific teleconnection
In order to capture Kiremt rainfall predictability associated with tropical Pacific SST, it is crucial that the models correctly simulate the teleconnection between the Pacific and East Africa. The observed correlation between Kiremt rainfall and SST shows an El Niño like structure with negative correlations in the central and eastern Pacific and positive correlations in the region of the warm pool (figure 2(a)). This SST anomaly pattern matches a canonical El Niño, but Preethi et al (2015) show that El Niño Modoki events have a similar albeit weaker impact on JJAS rainfall in tropical Africa. On average, the 77 individual simulations of the CGCMs (seven simulations per model) show a strikingly similar, albeit weaker correlation pattern (figure 2(b)). In the multi-model mean, the teleconnection pattern is stronger than observations, with correlations exceeding 0.8 (figure 2(c)). This is not surprising as observations represent one realization only and averaging over several realizations reduces the impact of atmospheric variability unrelated to SST. In all panels the strongest correlations are in the Niño3.4 region with value exceeding −0.7. Therefore in the following analysis we use the Niño3.4 index as representative of the Pacific SST variability.

Figure 2. Correlation between JJAS All-Ethiopian rainfall and JJAS SST/TS (OBS/models) in (a) observations, (b) the individual ensemble members' predictions (averaged) and (c) the multi-model prediction from 1985–2005. Only values significant on the 5% level are shown. The green boxes mark the Niño3.4 region.
Download figure:
Standard image High-resolution image
Figure 3. (a) Theoretical prediction skill for JJAS ALL-Ethiopian rainfall according to equation (2) versus the actual JJAS prediction skill in the individual ensemble members (averaged over each model). (b) Niño3.4 JJAS prediction skill versus prediction skill for JJAS ALL-Ethiopian rainfall in the individual ensemble members (averaged over each model). (c) Correlation between JJAS Niño3.4 index and JJAS All-Ethiopian rainfall and prediction skill for JJAS ALL-Ethiopian rainfall in the individual ensemble members (averaged over each model). The observed correlation is −0.7 (horizontal line). All correlations are computed over the time period 1985–2005.
Download figure:
Standard image High-resolution image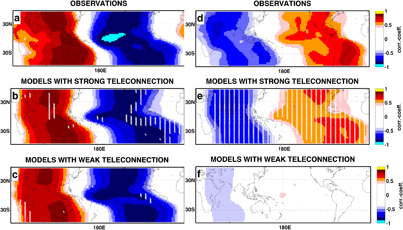
Figure 4. Left panels: Correlation between JJAS Niño3.4 index and JJAS velocity potential at 200 hPa in (a) observations, (b) the four models with the strongest correlation between JJAS All-Ethiopian rainfall and Niño3.4 index and (c) the four models with the weakest correlation between JJAS All-Ethiopian rainfall and Niño3.4 index. Right panels: Correlation between JJAS All-Ethiopian rainfall and JJAS velocity potential at 200 hPa in (d) observations, (e) the four models with the strongest correlation between JJAS All-Ethiopian rainfall and Niño3.4 index and (f) the four models with the weakest correlation between JJAS All-Ethiopian rainfall and Niño3.4 index. All correlations are computed over the time period 1985–2005. Hatching in panels (b)–(f) shows regions where all four models have the same sign deviation from the average of the correlation of all 11 models. Only values significant on the 5% level are shown.
Download figure:
Standard image High-resolution image
We can improve our understanding of the importance of this teleconnection for the Kiremt prediction skill of the models with a basic linear regression model. Here, we assume Kiremt rainfall (P) can be linearly partitioned into a part driven purely by Niño3.4 SST (N) and an independent part β:
According to this model we can express the correlation between observed and predicted Kiremt rainfall as the product of the prediction skill for the Niño3.4 index (correlation between observed (NO) and predicted Niño3.4 index (NM)), the observed teleconnection strength (correlation between observed Kiremt rainfall PO and observed Niño3.4 index NO) and the simulated teleconnection strength (correlation between predicted Kiremt rainfall PM and predicted Niño3.4 index NM):
Here we assume that the rainfall variability independent of ENSO is unpredictable and thus unrelated (i.e. corr (β_obs, β_model) = 0). As we are interested in the source of raw skill of the models rather than the benefit of ensemble averaging, we look at the average of the correlation values of the seven realizations for every model, instead of the correlation of the ensemble mean. This also allows direct comparison to the observed teleconnection strength, which by definition is derived from a single realization. The theoretical value of Kiremt prediction skill (equation (2)) shows a strong linear relationship to the actual prediction skill of the models (figure 3(a)). The correlation between these 11 points is 0.84, which means the theoretical model can explain 71% of the variance of the Kiremt prediction skill.
To quantify the relative importance of the terms of equation (2), we compare the Kiremt prediction skill to the Niño3.4 prediction skill corr(NO, NM) and the teleconnection strength corr(PM, NM). Niño3.4 prediction skill shows little spread between the models, the correlation ranges from 0.7 to 0.83 (figure 3(b) and supplementary figure S2(b)). There is a weak linear relationship between Niño3.4 prediction skill and Kiremt prediction skill. Correlation between the two is 0.41, therefore only 17% of the Kiremt prediction spread is explained by differences in Niño3.4 skill. In contrast, the Kiremt prediction skill seems to depend strongly on the strength of the teleconnection, those variables have a 0.8 correlation (figure 3(c)). Thus, 65% of the model spread in Kiremt prediction skill is explained by the differences in teleconnection strength. Note that only three of the models have a teleconnection strength similar to the observed value of 0.7.
As already shown in figure 2(c) the multi-model teleconnection is stronger than any of the individual models' teleconnection (correlation −0.83). A far superior prediction to the purely dynamical rainfall predictions can be realized by combining the multi-model SST predictions with the multi-model mean teleconnection patterns, using the linear regression model (equation (1)). The time series of this SST-based rainfall prediction (figure 1(a)) has a correlation to observations of 0.68 (figure 1(b)) and is identical to the correlation between observed Kiremt rainfall and the predicted JJAS Niño3.4 index.
3.3. Impact of large-scale characteristics on the teleconnection
While it is clear that the strength of the teleconnection of Kiremt rainfall and Pacific SST is decisive for the models' prediction skill of Kiremt, it is unclear why models differ so strongly in regard to this teleconnection. The strength of the teleconnection depends on the strength and structure of the diabatic heating over the tropical Pacific, and how the ocean–atmosphere system responds to the induced large-scale circulation changes (Gill 1980). The strength of the diabatic heating depends, among other things, on the strength of surface wind convergence and the amount of surface evaporation. These in turn are also both related to the magnitude of the SST anomalies (Lindzen and Nigam 1987, Zebiak and Cane 1987). The vertical structure of the diabatic heating depends on the vertical moisture and temperature structure of the atmosphere and on closure assumptions in the atmospheric model convection schemes, such as moisture entrainment and detrainment (Yano 2014).
Thus, fully understanding the differences in the teleconnections would require a detailed analysis of all of these processes. This is difficult to accomplish with the data available from the CHFP database, and is beyond the scope of this study. Nevertheless, we have investigated some basic relations in an effort to shed some light on the cause of model differences by comparing the four models with the strongest teleconnections to the four models with the weakest teleconnections.
Velocity potential at 200 hPa serves as an indicator of large-scale vertical motion, with positive upper-level velocity potential representing positive large-scale convergence and therefore upward motion. Therefore the most direct approach to investigate the teleconnection between the Niño3.4 index and Kiremt rainfall is the correlation between each index and the velocity potential. The observed correlation of the Niño3.4 index with velocity potential at 200 hPa shows a large cell-like structure: during warm SST events in JJAS, the uplift over the central Pacific (correlation of more than 0.9 to the Niño3.4 index) is balanced by a wider region of weaker region of downward motion from the western Pacific over the Indian Ocean into Africa (figure 4(a)). In terms of the teleconnection between the Niño3.4 index and the large-scale circulation, the models with strong teleconnections and the models with weak teleconnections largely agree and there are no systematic deviations from the average pattern of all 11 models (figures 4(b) and (c)).
The observed correlation between JJAS All-Ethiopian rainfall and JJAS velocity potential at 200 hPa is generally weaker than the correlation to the Niño3.4 index, not exceeding values of 0.8 (figure 4(d)). However, the cell structure looks very similar, especially the pattern over the Pacific. The balancing circulation over the Indian Ocean and Africa is more localized and centered over the Indian Ocean. Here, the models with the strongest teleconnections reproduce the observed pattern very well and there is strong agreement among the models (figure 4(e)). In contrast, the models with the weakest teleconnections hardly show any correlation between rainfall and the large-scale circulation (figure 4(f)). A weaker influence of the large-scale circulation on Ethiopian rainfall suggests a stronger influence of local effects. However, a comparison of the correlation between Ethiopian rainfall and local surface temperature among the models (not shown) could not support this assumption and more detailed analysis is required to understand this discrepancy to observations.
In addition, we compared the four models with the strongest teleconnections to the four models with the weakest teleconnections in regard of bias and variance of velocity potential, rainfall, and SST (not shown). However, we did not find common features related to the strength of the teleconnection.
4. Summary and conclusions
We showed that some CGCMs have significant skill in forecasting JJAS Ethiopian rainfall. The rainfall prediction of the most skillful model from ECMWF has a correlation of 0.53 with observations, and the multi-model prediction has a correlation of 0.45. These values are comparable to previous research (Jury 2014, Shukla et al 2016). However, the majority of the 11 models studied here are not skillful.
The Kiremt rainfall prediction skill of the individual models depends strongly on the strength of the simulated teleconnection between Kiremt rainfall and Pacific SST and is improved by ensemble averaging, but not necessarily by model averaging. Models with a weak teleconnection between Niño3.4 index and Kiremt rainfall do not capture the impact of the large-scale atmospheric circulation on local rainfall, and therefore have no or low Kiremt rainfall prediction skill. Such a missing relationship between local Ethiopian rainfall and the large-scale circulation is likely related to differences in the model physics. Further analysis is necessary to identify these differences and provide suggestions how to improve the models accordingly. For example, we expect the skill of a model in simulating Ethiopian rainfall to depend on the choice of convection scheme, as generally seasonal forecasts of rainfall differ strongly with different convective schemes (Shin et al 2003). Biases in local wind pattern or the representation of topography might play a role as well.
While some CGCMs have moderate prediction skill for Kiremt rainfall, the predictions are not yet competitive with simple linear SST-based predictions. Higher skill can be achieved by using the predicted Niño3.4 index directly (correlation of 0.68 for the multi-model). This way the model imperfections in the teleconnection strength are circumvented with a linear approximation. Such a 'hybrid' method for rainfall prediction—statistical forecast using dynamically predicted predictors—has been shown to beat multi-model prediction of NH spring rain in East Africa (Shukla et al 2014)) and provide skillful forecasts for rainfall in West and South Africa (Ndiaye et al 2011, Landman et al 2012).
The assumption that Kiremt rainfall is a linear function of the Niño3.4 index implies a predictability limit for dynamical models. If we consider a model with perfect SST skill (corr (NO, NM) = 1) and a very strong teleconnection (corr (PM, NM) = 1), according to equation (2) prediction skill for Kiremt would never exceed the strength of the observed teleconnection of 0.7. Such skill is almost reached with the SST based prediction. Therefore for dynamical models to beat the simple dynamical–statistical model, forecast skill must arise from either predicting the potential non-linear relationship to Pacific SST or different oceanic or atmospheric variability patterns. Such additional sources of predictability would result in the beta term (equation (1)) not being white noise, but with a short record it is difficult to find conclusive evidence of this.
However, there is some indirect evidence of other sources of predictability. First, the multi-model teleconnection strength between Kiremt rainfall and Niño3.4 is only −0.83. We found this to be the upper limit of the teleconnection strength when testing the skill of multi-model predictions as a function of ensemble size (not shown). An upper limit of 1 would be expected if β were completely unpredictable. Second, the correlation of predicted Niño3.4 indices and observed Kiremt rainfall is higher than the theoretical prediction skill due to equation (2) (figure 3(a)), also implying that there must be a predictable component to β. Predictability of β can arise from either other SST teleconnections impacting Kiremt rainfall or from non-linear ENSO impacts. For example, several studies found SST in the Atlantic and Indian Oceans to be useful predictors for Kiremt rainfall (Gissila et al 2004, Korecha and Barnston 2007, Diro et al 2011b).
Lastly, while our SST-based prediction model is clearly overly simple, it nevertheless serves to shed light on the Kiremt prediction skill differences among the models, and we hope this work stimulates greater effort to improve rainfall predictions in this region.
Acknowledgments
We acknowledge the WCRP/CLIVAR Working Group on Seasonal to Interannual Prediction (WGSIP) for establishing the Climate-system Historical Forecast Project (CHFP, see Kirtman and Pirani 2009) and the Centro de Investigaciones del Mar y la Atmosfera for providing the model output (http://chfps.cima.fcen.uba.ar/DS). We also thank the data providers for making the model output available through CHFP. SG was supported by a fellowship from the University of Bergen and the Center for Climate Dynamics. The work was also supported by the European Union Seventh Framework Programme (FP7/2007–2013) PREFACE (Grant Agreements No. 603521), ERC STERCP project (Grant Agreement No. 648982), and from the Research Council of Norway (233680/E10). Computing resources were provided by the Norwegian Program for supercomputing (NN9385K, NS9207K, NN9039K, NS9039K).
ORCID iDS
Stephanie Gleixner https://orcid.org/0000-0002-0032-9696