


Abstract
Aggressive emission control measures were taken by the Chinese government after the promulgation of the 'Air Pollution Prevention and Control Action Plan' in 2013. Here we evaluated the air quality and health benefits associated with this stringent policy during 2013–2015 by using surface PM2.5 concentrations estimated from a three-stage data fusion model and cause-specific integrated exposure–response functions. The population-weighted annual mean PM2.5 concentrations decreased by 21.5% over China during 2013–2015, reducing from 60.5 in 2013 to 47.5 μg m−3 in 2015. Subsequently, the national PM2.5-attributable mortality decreased from 1.22 million (95% CI: 1.05, 1.37) in 2013 to 1.10 million (95% CI: 0.95, 1.25) in 2015, which is a 9.1% reduction. The limited health benefits compared to air quality improvements are mainly due to the supralinear responses of mortality to PM2.5 over the high concentration end of the concentration–response functions. Our study affirms the effectiveness of China's recent air quality policy; however, due to the nonlinear responses of mortality to PM2.5 variations, current policies should remain in place and more stringent measures should be implemented to protect public health.
Export citation and abstract BibTeX RIS

Original content from this work may be used under the terms of the Creative Commons Attribution 3.0 licence.
Any further distribution of this work must maintain attribution to the author(s) and the title of the work, journal citation and DOI.
1. Introduction
The rapid development of China in recent decades has consumed an enormous amount of energy, which has led to severe air pollution. High loading of fine particulate matter with aerodynamic diameter less than 2.5 μm (PM2.5) is now a serious environmental and social problem in China and has attracted substantial attention [1, 2]. Exposure to PM2.5 can cause adverse health effects including cardiovascular and respiratory morbidity and mortality [3, 4]. According to the Global Burden of Disease 2015 comparative risk assessment (GBD 2015), outdoor PM2.5 exposure contributes to approximately 1.1 million deaths in China annually [5].
To improve air quality and protect public health, the state council of China promulgated the 'Air Pollution Prevention and Control Action Plan' (the Action Plan) in 2013 [6], which demanded reductions of PM2.5 concentrations for three key regions, namely, the Beijing–Tianjin–Hebei (BTH) region, the Yangtze River Delta region, and the Pearl River Delta region, by 25%, 20%, and 15% by 2017 as compared to the 2013 levels, respectively. Aggressive measures have been taken in support of the Action Plan by national and local governments and remarkable reductions in PM2.5 concentrations were observed by national monitoring networks during the first half of the Action Plan implementation period (i.e. 2013–2015).
To date, several studies have considered premature mortality induced by long-term PM2.5 exposure in China [7–13]; however, studies evaluating whether the health burden was alleviated by the rapid air quality improvements since 2013 have not been reported. Assessment of air quality and health benefits of the Action Plan requires accurate knowledge of the spatial and temporal variation of PM2.5 in China during 2013–2015 [14]. However, monitoring sites in China are sparse and cannot provide full coverage exposure data for the entire country, which inhibited accurate evaluation of the spatio-temporal characteristics of PM2.5 pollution over China.
To fill the gap between the demand for spatially resolved PM2.5 distributions and the scattered availability of monitoring sites, satellite-derived aerosol optical depth (AOD) have been extensively utilized to estimate ground-level PM2.5 concentrations in China by associating PM2.5 concentrations with AOD measurements through statistical models [15, 16]. Nonetheless, because of the unavoidable missing AOD measurements, AOD-based statistical approaches are hard to provide spatially continuous PM2.5 predictions. To tackle the spatial discontinuity of PM2.5 predictions, our previous study [17] developed a data fusion model that integrates PM2.5 simulations from air quality models in addition to satellite-based AOD measurements and PM2.5 observations and provides spatially continuous estimates of PM2.5 on a daily basis in 2014.
Concentration–response (C–R) functions have been extensively utilized to link PM2.5 exposure with attributable health outcomes in China [7–12]. The GBD project developed integrated concentration–response (IER) functions [18] which were widely applied [5]. By utilizing satellite-based PM2.5 maps and the IER curves, Cohen et al [5] estimated the 25 year trends of the global burden of disease attributable to ambient air pollution, and implied that PM2.5 caused 1.1 million premature deaths over China in 2015. Liu et al [10] quantified PM2.5-induced adult mortality to be 1.37 million over China in 2013 based on the IER curves and simulated PM2.5 maps. Liu et al [11] evaluated the spatial and temporal characteristics of PM2.5-related mortality in China during 2004–2012 based on satellite-derived PM2.5 estimates. By using surface observations, Song et al [12] estimated the health burden attributable to PM2.5 over China in recent years with a focus on the potential health benefits of meeting various air quality standards in the future. Those previous studies provided general pictures of PM2.5-induced mortality and its variations over China while they seldom paid attention to impacts from specific policies. In addition, studies evaluating the health benefits from China's toughest ever clean air action since 2013 have not been reported.
To provide a better understanding of the implemented toughest ever air pollution control policy, we quantified the improvements in surface PM2.5 air quality in China during 2013–2015 and the subsequent health benefits. We first generate continuous spatio-temporal estimates of ground-level PM2.5 concentrations in China from 2013 to 2015 by fusing satellite-based AOD, surface observations, and simulated PM2.5 concentrations from the WRF–CMAQ modeling system (Weather Research and Forecasting model–Community Multiscale Air Quality model). Air quality improvements during 2013–2015 were then analyzed using the derived PM2.5 concentration maps. We further evaluated the health benefits due to the implementation of the Action Plan since 2013 using the IER model [18].
2. Materials and methods
2.1. WRF–CMAQ modeling system
The Weather Research and Forecasting (WRF) model version v3.5.1 [19] and the Models-3 Community Multiscale Air Quality (CMAQ) model version 5.1 [20] were used to simulate daily variation of PM2.5 concentrations in China with a horizontal resolution of 36 km × 36 km. The WRF model is driven by the National Centers for Environmental Prediction Final Analysis (NCEP-FNL) reanalysis data [21] as initial and boundary conditions. Meteorological parameters simulated by the WRF model together with emission inventories were applied to drive the CMAQ model. Anthropogenic emissions for mainland China during 2013–2015 were derived from the Multi-resolution Emission Inventory of China (MEIC) model [22], while anthropogenic emissions for other Asian countries and regions were obtained from the MIX Asian emission inventory [23]. Details of model configurations are documented in Zheng et al [24] as well as in the supplementary information ((SI) text S1 available at stacks.iop.org/ERL/12/114020/mmedia).
In this study, the WRF–CMAQ modeling system was utilized in two parts. First, continuous PM2.5 simulations from the WRF–CMAQ model were used as a major dataset to retrieve our optimal PM2.5 concentrations in the three-stage data fusion model. Second, a set of sensitivity simulations based on the WRF–CMAQ model and the continuous PM2.5 simulations were used together to quantify the impacts of meteorological variations on air quality as sensitivity analysis.
2.2. Estimates and validation of PM2.5 concentration
In this study, we applied a three-stage data fusion model proposed in our previous study [17] to predict PM2.5 concentrations in China (excluding Taiwan, map of China is illustrated in figure S1) from 2013–2015, whose spatial resolution is 0.1° × 0.1°. Our first-stage model utilized a modified linear mixed-effects (LMEs) model [25] to predict surface PM2.5 by calibrating satellite-based AOD and PM2.5 simulations from the WRF–CMAQ model using routine measurements. The second-stage model fused information from satellite-based PM2.5 and calibrated-CMAQ PM2.5 estimates from the first-stage model based on the maximum likelihood estimator (MLE). In the third-stage model, the MLE residuals were interpolated over the whole study domain by the spatiotemporal Kriging [26] approach. The optimal PM2.5 estimates were then derived from the sum of the fused PM2.5 values obtained in the second stage and the residuals calculated in the third stage. The PM2.5 concentrations for each county (i.e. county average) were then derived by zonal averaging over our optimal PM2.5 surfaces, and the derived county level PM2.5 maps were utilized as the base datasets for further analysis. We calculated national and provincial population-weighted PM2.5 concentrations based on the county level PM2.5 maps and county level population data from the 2010 China census. All aftermentioned national and provincial PM2.5 concentrations present population-weighted values. Details on the PM2.5 predictions are documented in Xue et al (2017) [17].
We applied a strict cross-validation (CV) procedure to evaluate our optimal PM2.5 maps against surface measurements (SI: text S2). The CV on the daily estimates during the three years implies a good performance of our fusion model with correlation coefficient (R) value and normalized mean bias (NMB) of 0.84 and −7.5%, respectively, which are comparable to previous studies [27–30]. We also evaluated our daily estimates by years. According to the CV results, mean PM2.5 observations for the three years were 70.8, 56.3, and 50.2 μg m−3, respectively, while mean PM2.5 estimates were 63.9, 51.4, and 46.9 μg m−3, respectively. The CV results indicates that our model performs well in all three years with R values and NMB ranging from 0.83 to 0.88 and from −9.6% to −6.6%, respectively. The CV results also shows that mean PM2.5 observations and mean PM2.5 estimates reduced by 20.5% and 19.6% during 2013–2014, respectively, and reduced by 10.8% and 8.8% during 2014–2015, respectively. The consistent reduction ratios of PM2.5 concentrations from observation and our estimates during the three years indicate the credibility of annual PM2.5 variations estimated in this study (SI: table S3). The estimated PM2.5 levels in this study are also comparable to that predicted in previous studies. For example, the population-weighted PM2.5 concentration in 2013 predicted in this study was 60.5 μg m−3, while Brauer et al [31] reported a value of 55 μg m−3, and Zhang et al [32] reported a value of 61 μg m−3. We thus utilized the derived optimal PM2.5 estimates as the base dataset for further analysis.
To identify the significance of the PM2.5 abatements during the analysis period, we applied the Mann–Kendall trend analysis [33] to daily estimates of PM2.5 concentrations at the county level. Mann–Kendall trend analysis is a non-parametric trend test which utilizes the relative magnitude of the data rather than the absolute value to evaluate significance of trends [34]. This estimator has been widely applied to investigate trends in environmental time series datasets (e.g. Du et al [35], Shen et al [36]).
2.3. Evaluation of premature mortality attributable to PM2.5
To evaluate the premature mortality attributable to PM2.5 exposure, the relationships between chronic exposure and attributable mortalities, which are called C–R relationships, must be determined. The IER functions developed for the Global Burden of Diseases Study include cohort studies at high levels of exposure concentrations (i.e. active and second-hand tobacco smoke) and provide C–R relationships for a full range of ambient PM2.5 distributions [18], which are suitable for relevant studies in China. We utilized the IER relationships to calculate the premature mortality attributable to chronic PM2.5 exposure in China for adults (age ≥ 25). Four leading endpoints were considered, including lung cancer (LC), chronic obstructive pulmonary disease (COPD), ischemic heart disease (IHD), and stroke. The relative risk (RR) for each endpoint can be obtained by equation (1) [18]:

where C is the ambient PM2.5 exposure concentration; C0 is the endpoint-specific theoretical minimum-risk concentration of PM2.5; and α, γ, and δ are parameters that determine the shape of C–R curves. A distribution of 1000 point estimates of C0, α, γ, and δ parameters provided by the IER were utilized to calculate mean RR and its 95% confidence intervals (CIs). We further employed the following equation to calculate the endpoint-specific (subscript: e) premature mortalities attributable to PM2.5 exposures for the population subgroup p (population by age, sex, and urban/rural residence) in county c:

where Pp,c represents county-level population amount of a population subgroup, Bp,e represents the national-level cause-specific mortality incidence for a population subgroup and RRp,e(Cc) represents the relative risk of endpoint e among a population subgroup p during exposure to a specific PM2.5 level (i.e. Cc). Detailed county-level demographic information was obtained from the 2010 China census, which is the most recent and accurate national census. To exclude the impacts of population growth and mortality incidence changes on the estimated mortality variations, we applied mortality incidence of 2010 for mortality estimation during 2013–2015. The cause-specific national mortality incidence statistics for all population subgroups in 2010 were obtained from the Ministry of Health of China [37] (SI: table S4). Because IER provides age-specific C–R functions for stroke and IHD, the attributable mortality of these two endpoints are calculated by age [18].

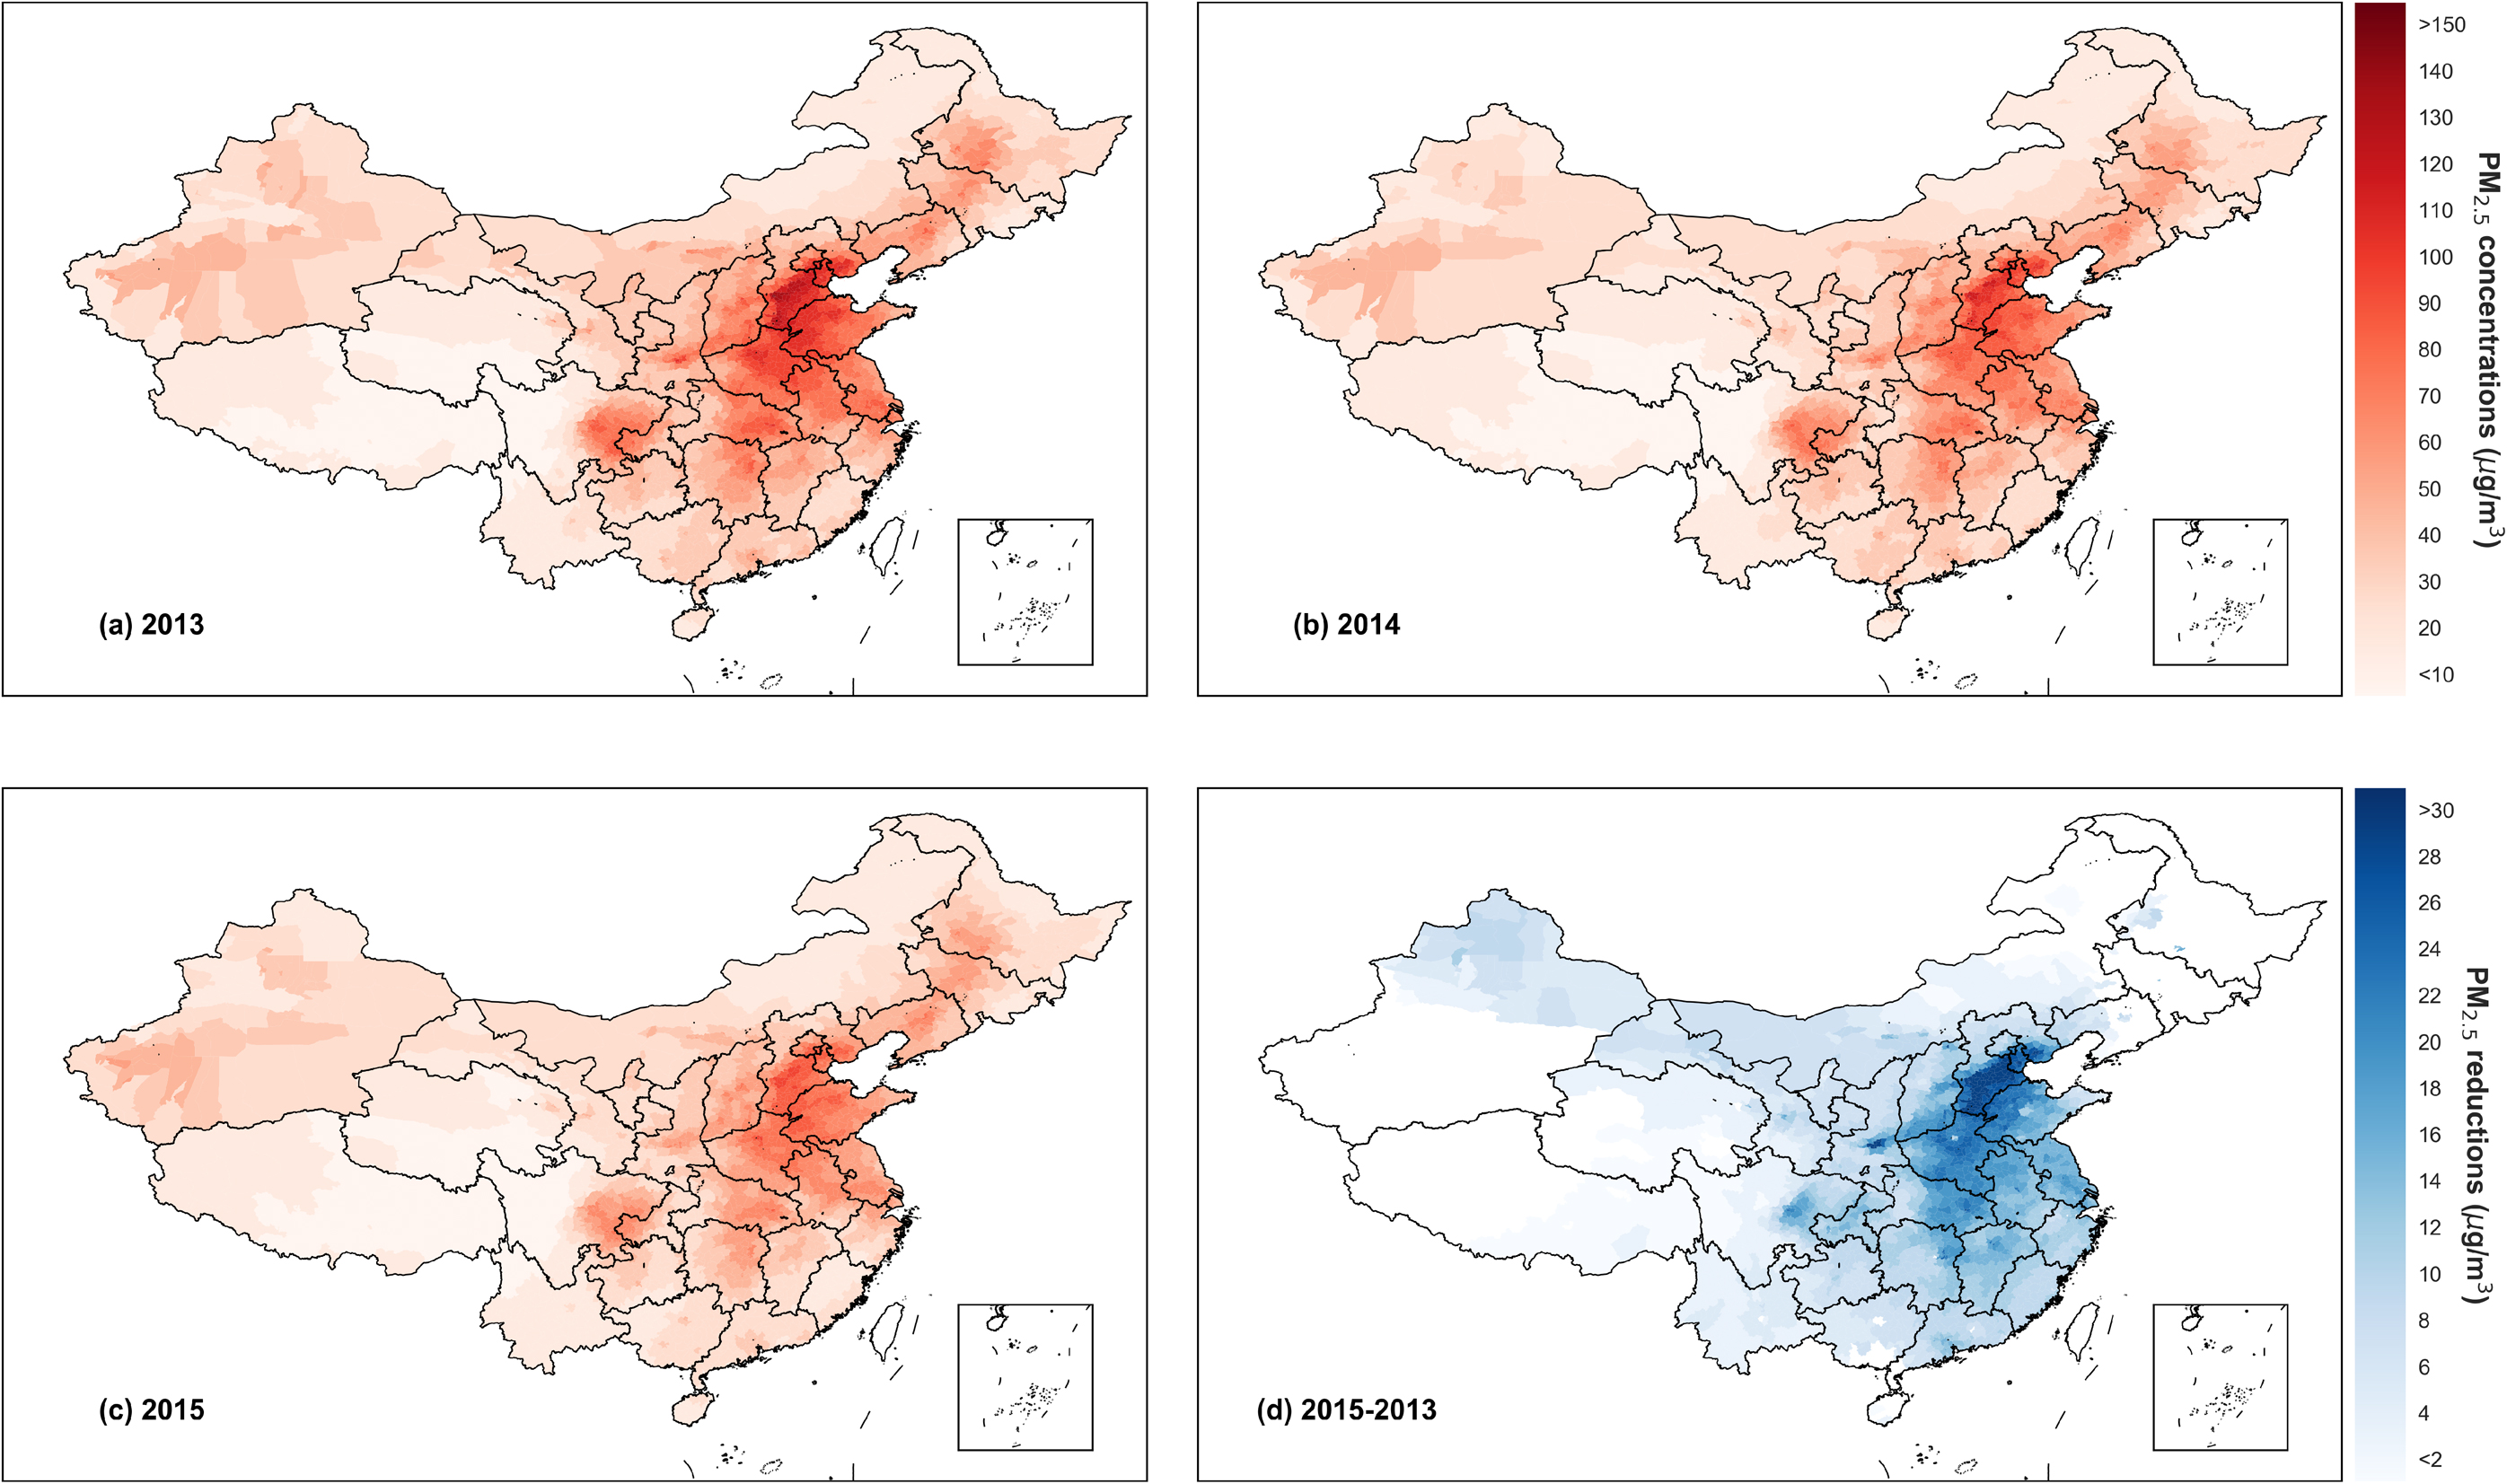
Figure 1. Annual average PM2.5 concentrations in China and the reductions during 2013–2015 at county level. PM2.5 concentrations for (a) 2013, (b) 2014, and (c) 2015. (d) Annual PM2.5 abatements during 2013–2015 in counties with statistically significant reduction trends identified by the Mann–Kendall test.
Download figure:
Standard image High-resolution image3. Results
3.1. Reductions in PM2.5 concentrations
Figure 1 illustrates the optimal PM2.5 estimates in China from 2013 to 2015. The names of each Chinese province are depicted in figure S1. In 2013, high levels of PM2.5 concentrations were observed in northern, eastern and central China, especially in the BTH region and the surrounding provinces, including Shandong, Shanxi, and Henan. Hebei was the most polluted province in 2013 and presented population-weighted PM2.5 concentrations of 102 μg m−3. All the most polluted counties with annual average PM2.5 concentrations greater than 130 μg m−3 in 2013 are located in Shijiazhuang City and Xingtai City, which are both prefecture-level cities in Hebei Province.
The nationwide PM2.5 concentrations decreased considerably, especially in the most polluted regions (i.e. BTH and surrounding provinces) as shown in figures 1(a)–(c). During the analysis period, the national population-weighted PM2.5 concentration declined from 60.5 μg m−3 in 2013 to 47.5 μg m−3 in 2015, representing a reduction of 21.5% in two years. Although the derived PM2.5 trend is directly comparable to the trend from monitoring data, the monitoring data confirmed the decrease of PM2.5 pollution levels; for the 74 cities with full coverage of surface PM2.5 concentration data, the annual mean PM2.5 concentrations decreased by 23.6% during the same period (from 72 μg m−3 to 55 μg m−3) [38].
Figure 2 further confirms the marked reduction of population-weighted PM2.5 concentrations at the provincial level. The population-weighted PM2.5 at the provincial level showed an overall reduction (figure 2(a)). From 2013 to 2015, the population-weighted PM2.5 concentrations declined in all 31 provinces. The greatest reductions, at more than 20 μg m−3, were observed in Hebei Province, Tianjin Municipality, and Henan Province, and reductions that exceeded 15 μg m−3 were observed in Shandong, Hubei, Anhui, Jiangsu, Shaanxi, and Shanxi provinces.

Figure 2. Reduction of population-weighted PM2.5 concentrations during 2013–2015. (a) Boxplot for the provincial level; (b) map of provincial population-weighted PM2.5 reductions; (c) cumulative distribution of annual mean PM2.5 exposures for 2013–2015.; and (d) population-weighted PM2.5 distributions in China during 2013–2015. Values above the yellow arrows in (a) depict annual reductions of national population-weighted PM2.5 concentrations. From bottom to top, the five horizontal lines of the boxplot in (a) depict the 0th, 25th, 50th, 75th, and 100th percentiles.
Download figure:
Standard image High-resolution imageMoreover, reductions of more than 20% were observed in 17 provinces, and reductions of more than 15% were observed in the remaining eight provinces. These findings indicate a nationwide alleviation of PM2.5 pollution. Figure 2(c) and (d) illustrate the distribution of population exposed to various PM2.5 levels. The population exposure level clearly shifted towards a lower value during 2013–2015, with population exposed to annual PM2.5 levels exceeding the World Health Organization Air Quality Interim Target-1 (WHO-IT1) standard (i.e. 35 μg m−3) declining significantly from 80% to 66%.
Figure 1(d) shows the reduction of annual PM2.5 concentrations during 2013–2015 for counties where significant decreasing trends of PM2.5 were identified by the Mann–Kendall test. The PM2.5 concentrations declined significantly for 87% of the total counties (91% of the total population), and the reduction of PM2.5 concentration at the county level reached up to 63.5 μg m−3. All of the counties with a PM2.5 reduction greater than 50 μg m−3 were located in Shijiazhuang and Xingtai, the two most polluted cities in the country, which indicates the effectiveness of aggressive air quality improvement measures in the most polluted regions in China. The Mann–Kendall test was also applied to the daily average national population-weighted PM2.5 concentrations and the result confirmed the significant reduction of national-level PM2.5 exposure in China during 2013–2015.
3.2. Mortality abatements attributed to reduced PM2.5 concentrations
Our study estimated that 1.22 million (95% CI: 1.05, 1.37) premature adult deaths were attributable to PM2.5 pollution over China in 2013, in which stroke, IHD, COPD, and LC contributed 51%, 25%, 14%, and 10%, respectively (figure 3). The estimated mortality in 2013 is close to the results of recent studies that estimated PM2.5 attributable mortality in China using the IER functions with values from 1.1–1.37 million [5, 10, 39–41]. The similar distribution patterns of PM2.5 concentrations and population (see SI: figure S5) aggravate the public health burden. In 2013, four provinces (Shandong, Henan, Jiangsu, and Sichuan) with annual PM2.5-attributable mortality greater than 90 000 were all populous and highly polluted, with populations greater than 70 million and provincial PM2.5 levels above 60 μg m−3. In 2013, Shandong, which had a population of 96 million (70 million adults) and a PM2.5 level of 87.4 μg m−3, had the highest annual PM2.5-induced mortality, with a value of 113 800 (95% CI: 97.8, 128.1).

Figure 3. Annual mortality attributed to PM2.5 exposure and mortality reductions during 2013–2015. (a) Total national mortality induced by PM2.5 exposure during 2013–2015; (b) provincial PM2.5-attributable mortality in 2013; (c) reduction of attributable mortality by endpoints during 2013–2015; and (d) reduction of provincial PM2.5-attributable mortality during 2013–2015. The error bars represent the 95% CI.
Download figure:
Standard image High-resolution imageImproved air quality has alleviated the disease burden attributable to PM2.5 exposure in China. During 2013–2015, declined PM2.5 concentrations might have led to a 110 800 (95% CI: 94.8, 127.4) (9.1%) reduction of the PM2.5-attributable mortality. Among all endpoints, stroke accounted for 46% of the total mortality reduction and COPD contributed to approximately 21% of the total reduction (figure S6). The different shapes of the C–R functions for each endpoint led to variations in the reduction ratio of each endpoint-induced mortality. The mortality caused by LC and COPD decreased by over 14%, whereas the mortality caused by IHD and stroke decreased by only 6% and 8%, respectively.
Driven by the decline of ambient PM2.5 levels, all provinces showed reduced PM2.5-attributable mortality during 2013–2015 (figure 3). In all these provinces, Guangdong achieved the highest reduction in mortality, with a value of 9942 (95% CI: 7688, 12050), and Henan, Jiangsu, Shandong, Sichuan, Hunan, Zhejiang, Hebei, Fujian, Jiangxi, Hubei, and Anhui provinces each achieved reductions in mortality of over 5000 for the analysis period, which accounted for 70% of the national mortality reduction. The considerable reduction of mortality in these provinces can be attributed to their high base mortality in 2013 and the significant reduction of PM2.5 concentrations. Most of these 12 provinces are populous, with more than 50 million residents (except for Fujian and Jiangxi), and population-weighted PM2.5 concentrations in all these provinces decreased by more than 18% between 2013 and 2015. In addition to these 12 provinces, 12 other provinces had mortality reductions of more than 1000. In contrast, reduced mortality in comparatively clean regions including Ningxia, Qinghai, and Tibet are all less than 400 owing to comparatively small populations and low base PM2.5 concentrations. Specifically, air quality improvements during 2013–2015 only led to 45 (95% CI: 25, 73) abated attributable deaths in Tibet, which can be attributed to its low population (about three million) and extremely low PM2.5 concentrations (around 8 μg m−3 during the three years).
Because the shapes of the C–R functions utilized in this study are supralinear, the reduction of PM2.5 concentrations may not have produced consistent mortality reduction ratios. As depicted in figure 4, the highest PM2.5 reduction ratio was 30%, in Jiangxi Province; however, the mortality reduction ratio in Jiangxi was only 16%. Tibet achieved the greatest PM2.5-attributable mortality reduction ratio of 24%, and its population-weighted PM2.5 concentrations declined by 8%. Tibet and Yunnan are the only two provinces that obtain higher reduction ratio in mortality than in PM2.5 level because of the steep C–R relationship at lower concentrations [40]. During 2013–2015, PM2.5 reductions in relatively clean provinces yielded higher marginal health benefits (i.e. mortality abatement induced by unit reduction of PM2.5 level) than reductions in polluted provinces. For example, although Guizhou and Shandong both achieved PM2.5 reductions of 20%, the mortality reduction was much higher in Guizhou (12%) than in Shandong (6%), which was primarily attributed to the lower PM2.5 level in Guizhou Province.

Figure 4. Reduction of provincial PM2.5 levels (population-weighted) and PM2.5-attributable mortality between 2013 and 2015. Dots indicate reductions in PM2.5 pollution and PM2.5-induced mortality, respectively. The gray dashed line shows the 1:1 line. The filled diamond depicts the national average (population-weighted).
Download figure:
Standard image High-resolution image
4. Discussion
In 2013, China launched the toughest-ever clean air action to combat severe air pollution. Our study presents large reductions in nationwide PM2.5 concentrations from 2013 to 2015. More significant reductions in PM2.5 concentrations were observed in heavy polluted provinces such as Hebei, Tianjin, and Henan, which indicates the effectiveness of the aggressive clean air actions in these polluted regions. Air quality improvements in China have led to certain public health benefits. However, due to the nonlinear response of attributable mortality to PM2.5 variations in current exposure–response functions, reductions in attributable mortality were relatively small as compared to the reductions in PM2.5 levels.
Our study subjects to a number of uncertainties and limitations. Because of the 'smoothing effects' of regression models [17, 29, 42], our optimal PM2.5 estimates may underestimate PM2.5 concentrations in heavily polluted regions, while the impacts of the uncertainties in PM2.5 estimates were relatively small compared to IER functions [10, 41]. Premature mortality estimates subject to uncertain due to limited evidence of epidemiology in the IER functions, which were quantified by 1000 simulations using 1000 sets of IER parameters [18]. We used the 2010 population and baseline mortality incidence (BMI) data to calculate the premature mortality for the whole analysis to exclude the impact of population and BMI change on the premature mortality calculation, given that our objective is to evaluate the effectiveness of emission control policies. Using year-over-year data will induce 2.0%–6.5% changes in estimates of total premature deaths, while the decreasing trends in premature deaths remain valid (see SI: text S4, table S5). To fully utilize the county-level demographic information from the 2010 census, we based our health-related estimations on the county level and ignored the spatial heterogeneity of the PM2.5 levels and population within each county. This may introduce additional uncertainties in certain counties with large areas, but we believe that uncertainties are relatively small because large counties are usually located in western China with small population.
Variabilities in meteorological conditions can affect the inter-annual variations of PM2.5 concentrations. Its potential effects after 2013 caused debates in Chinese social media for the effectiveness of control measures [43, 44]. To quantify the impacts of the inter-annual variation of meteorology, we conducted sensitivity simulations by using the CMAQ model with fixed emissions during 2013–2015 (SI: text S3). During 2013–2015, inter-annual variations in meteorological conditions altered population-weighted annual mean PM2.5 concentrations from −2.0 μg m−3 to 6.2 μg m−3 at the provincial level, while its impacts on national population-weighted annual mean PM2.5 concentrations were small (0.68 μg m−3, SI: figure S7). The sensitivity analysis further confirms that the nationwide reduction in PM2.5 concentrations during 2013–2015 were mainly attributed to reductions in anthropogenic emissions from the implementation of China's clean air action plan rather than inter-annual meteorological variations.
The Action Plan introduced ten measures to improve air quality, including multi-pollutant emissions control, industrial structures optimization, and energy structures adjustment. According to the MEIC model [22], the emission control on heavily polluted sectors reached a high level in 2015. For example, during 2013–2015, the implementation ratio of desulphurization devices increased from 80% to 86% for coal-fired power plants and the average denitrification efficiency increased from 29% to 53%. Meanwhile, according to the National Bureau of Statistics of China [45], production in heavily polluted industrial sectors, including pig iron, cement, and float glass, decreased by 2.5%, 2.8%, and 5.2%, respectively, which likely reflected the optimization of the industrial structure. In addition, the national energy consumption increased by 3.2% during 2013–2015, with the share of coal declined by 3.4% and the share of clean energy (i.e. energy other than coal and oil) increased by 2.4%. Driven by the Action Plan, the stricter emission control, industrial structures optimization, and energy structures adjustment may be the key reasons for the reduction in air pollutant emissions.
Although the Action Plan have led to a considerable PM2.5 abatements, the health benefits induced by air quality improvements in this period were limited, which was likely caused by the supralinear responses of cause-specific mortality to ambient PM2.5 concentrations in exposure–response functions [40, 46]. As shown in figure 4, 21% of national population-weighted PM2.5 reductions accounted for only 9% of the attributable mortality abatements, and most of the provinces obtained much smaller ratios of mortality reductions to PM2.5 reductions. Currently, PM2.5 concentrations in polluted regions are still located at the high-end of the concentration-response functions where marginal mortality reductions are limited. Moreover, our study suggests that the mortality burdens induced by air pollution are also severe in less polluted provinces (see figure 3(b)), where greater marginal mortality reductions can be achieved [40, 46]. To improve air quality and protect public health, current policies should remain in place, and stricter measures should be implemented in the future.
Acknowledgments
This work was supported by the National Natural Science Foundation of China (41625020 and 41571130032).