

Abstract
Tropical dry forests (TDFs) present strong seasonal greenness signals ideal for tracking phenology and primary productivity using remote sensing techniques. The tightly synchronized relationship these ecosystems have with water availability offer a valuable natural experiment for observing the complex interactions between the atmosphere and the biosphere in the tropics. To investigate how well the MODIS vegetation indices (normalized difference vegetation index (NDVI) and the enhanced vegetation index (EVI)) represented the phenology of different successional stages of naturally regenerating TDFs, within a widely conserved forest fragment in the semi-arid southeast of Brazil, we installed several canopy towers with radiometric sensors to produce high temporal resolution near-surface vegetation greenness indices. Direct comparison of several years of ground measurements with a combined Aqua/Terra 8 day satellite product showed similar broad temporal trends, but MODIS often suffered from cloud contamination during the onset of the growing season and occasionally during the peak growing season. The strength of the in-situ and MODIS linear relationship was greater for NDVI than for EVI across sites but varied with forest stand age. Furthermore, we describe the onset dates and duration of canopy development phases for three years of in-situ monitoring. A seasonality analysis revealed significant discrepancies between tower and MODIS phenology transitions dates, with up to five weeks differences in growing season length estimation. Our results indicate that 8 and 16 day MODIS satellite vegetation monitoring products are suitable for tracking general patterns of tropical dry forest phenology in this region but are not temporally sufficient to characterize inter-annual differences in phenology phase onset dates or changes in productivity due to mid-season droughts. Such rapid transitions in canopy greenness are important indicators of climate change sensitivity of these already endangered forest ecosystems and should be further monitored using both ground and satellite approaches.
Export citation and abstract BibTeX RIS

Original content from this work may be used under the terms of the Creative Commons Attribution 3.0 licence.
Any further distribution of this work must maintain attribution to the author(s) and the title of the work, journal citation and DOI.
1. Introduction
Land surface vegetation phenology, or the seasonal cycles of plant growth and senescence, is a fundamental process that perpetuates biogeochemical cycling between the Earth's biosphere, geosphere, and the atmosphere. While the vegetation phenology of temperate regions is well studied and documents, the seasonality of tropical deciduous vegetation, specifically in the semi-arid tropical dry forests (TDFs), is underrepresented in the scientific literature and its multi-year growth dynamics are often poorly understood (Sánchez-Azofeifa et al 2005).
TDFs are defined as deciduous or semi-deciduous ecosystems with a mean annual temperature ≥ 25 °C, a total precipitation between 700 and 2000 mm, and three or more months of no precipitation during a given year (Sanchez-Azofeifa et al 2017). Today, TDFs make up nearly half of the forested land in the tropics, with the largest remaining extent found in Latin America (Portillo-Quintero and Sánchez-Azofeifa 2010). Historically, TDFs in Central and South America have experienced higher rates of human colonization and extensive land cover change due to their fertile soils for agriculture and favourable climate over other tropical ecosystems (Portillo-Quintero and Sánchez-Azofeifa 2010). Remaining TDFs in the Neotropics are typically highly fragmented, chronically degraded, and generally suffer from insufficient conservation efforts (Sánchez-Azofeifa et al 2003, Sánchez-Azofeifa et al 2005).
Living in environments with high solar irradiance where mean annual potential evapotranspiration exceeds precipitation, the TDF canopy becomes dormant for several months each year in order to conserve water during the annual droughts. Deciduous trees dominate the TDF landscape due to the adaptive advantages of seasonal foliage loss and regrowth, a water stress avoidance strategy which can only be afforded by nutrient rich soils (Ishida et al 2006). This drastic seasonal change in landscape leaf surface area drives local and regional patterns in atmospheric moisture, heat, and carbon dioxide dynamics through landscape scale processes of photosynthesis, evapotranspiration, and respiration. The phenology of TDFs are known to be very strongly dependent on patterns of soil and atmospheric water availability and thus the length of the growing season and extent of annual ecosystem service production, including carbon storage, water production, climate regulation, and biodiversity resources, can vary from year to year with precipitation patterns.
The extent of natural inter-annual variability in TDF phenology in response to water availability and as a function of secondary succession is poorly understood and deserves the attention of tropical forest management and conservation efforts (Quesada et al 2009). Unfortunately, the absence of significant monitoring efforts for TDF leaf phenology is contrasted by the important role these tropical forest ecosystems play in moderating the exchange of carbon, water, and energy between the land surface and the atmosphere (Navar et al 2010, Singh and Singh 1991, Meister et al 2012). Furthermore, the lack of detailed empirical observations on TDF phenology makes modelling their growth and productivity dynamics a serious challenge for climate-biosphere studies. In this context, studying the timing of leaf expression in TDFs provides important insights to the variability of forest productivity in response to changing meteorological conditions. As accelerating changes in global climate threaten to change precipitation patterns in many tropical semi-arid regions (Meir and Pennington 2011), these changes will likely introduce undesirable stressors in the continental semi-arid tropics where ecosystems such as TDFs often exist in a fine balance between water scarcity and severe drought. Since TDF productivity is tightly linked to water resources which are highly variable across space and time in TDF landscapes, remote sensing methods for assessing TDF phenology must be both accurate and reliable in order to evaluate current baselines for tropical forest productivity and to detect climate change related alterations in forest phenology.
Satellite remote sensing systems have become the tool of choice for landscape scale vegetation mapping, monitoring, and modelling in the 21st century due to the spatial extent and repeat capabilities of observation (Kerr and Ostrovsky 2003, Xie et al 2008, Sanchez-Azofeifa et al 2017). Specifically, spectral vegetation products from the MODerate resolution Imaging Spectroradiometer (MODIS) on board NASA's Terra and Aqua Earth observation science satellite platforms, have been widely used for studying the temporal behaviour of land surface vegetation since the years 2000 and 2002, respectively. The MODIS land surface team offers several global repeat coverage spectral vegetation index (VI) products like the popularized normalized difference vegetation index (NDVI) and the enhanced vegetation index (EVI), the latter which improves issues with atmospheric correction, index saturation in dense forests, and soil background effects (Boegh et al 2002, Gao et al 2003, Xiao et al 2004). These freely available data sets are offered at 250 m, 500 m, and 1 km spatial resolution at 16 day or monthly intervals and are some of the most commonly used inputs for regional and global scale modelling of environmental dynamics (Tucker et al 2005).
While the MODIS vegetation greenness index products (denominated by the MODIS production group as MOD13) are quality controlled, some issues still remain due to common challenges with moderate resolution remote sensing such as atmospheric correction, cloud contamination, land cover classification, spectral mixing within pixels, and sensor degradation (Myneni et al 1995, Malenovsky et al 2009). In fact, proper land cover classification, an integral component of the MODIS look-up table algorithms for vegetation products, has been shown to remain a challenge in TDFs due to the extreme seasonality of this ecosystem where in general they are describe as grasslands and savannahs (Sánchez-Azofeifa et al 2003). Not only do TDFs suffer from frequent pixel cloud contamination during the rainy growing season, during the dry season when pixel quality is sufficient they are often incorrectly classified as woody savannahs rather than broadleaf forest land cover type due to lower than predicted leaf area index. Furthermore, TDFs tend to respond dramatically to precipitation events during the dry to wet season transition and can flush out a full leaf canopy in less than two weeks making it easy to miss extreme changes in leaf area based on infrequent satellite observation intervals. This combination of remote sensing challenges can cause phenology-monitoring efforts from satellite to be inaccurate and misleading to users who are unaware of the data product limitations.
In this paper we investigate just how well the MODIS vegetation greenness indices perform compared to near-surface canopy bi-hemispherical radiometric monitoring systems installed at several locations within regenerating plots of secondary TDF in south-eastern Brazil, in a region containing many of the last conserved fragments of the once widely distributed South American continental TDF biome. We ask the following questions in order to assess whether moderate resolution satellite remote sensing is sufficient for monitoring TDF phenology: (a) How do direct comparisons of in-situ vegetation indices compare to MODIS satellite products across a gradient of TDF successional forest stages? (b) How do multi-year time series trends of vegetation greenness indices compare between ground and satellite observation platforms? (c) Are there differences in canopy phenology transition dates as detected using in-situ daily vs coarser temporal resolution satellite observations?
2. Methods
2.1. Study site
The study plots are located within Mata Seca State Park, a 10 281 ha TDF (Holdridge life zone) conservation unit designated in 2000 and managed by the State Forestry Institute (IEF) of the State of Minas Gerais, Brazil. The park is situated on flat, nutrient rich soils in the Sao Francisco river valley in the Municipality of Manga, Minas Gerais, Brazil between 14°48'36''–14°56'59'' S and 43°55'12''–44°04'12'' W. The climate of the region is tropical semi-arid (Köppen's classification), characterized by a severe dry season from April to October. Average annual precipitation is 900 mm with an average temperature of 24.4 °C. This conservation area, comprised of a matrix of old-growth and regenerating secondary forest stands with 1500 ha of abandoned pasture and cropland, is a core research site for the Tropi-Dry Project (www.tropi-dry.org). A chronosequence of long-term ecological research plots at different stages of TDF succession were categorized into early stage (5–20 years), intermediate stage (20–50 years) and late stage (>50 years) based on forest structure rather than absolute stand age following the methods of Kalacska et al (2004) Kalacska et al (2005).
Four plots with different successional stages along a 5 km transect were selected for this study, an early, an intermediate, and a late successional forest, as well as a recently abandoned pasture plot. The abandoned pasture is characterized by a 2–3 m tall canopy of grasses and shrubs, and the early, intermediate, and late forest canopies have mean tree heights of 8 m, 15 m, and 22 m, respectively. Each forest stage has distinct differences in tree basal area and vertical canopy strata; for more details on forest stage characteristics see the methods by Madeira et al (2009).
Canopy observation towers were installed in the early and intermediate stage plot in 2007 and the late stage and pasture plots in 2010 and 2012, respectively, for continuous forest phenology monitoring using radiometric sensors. Hemispherical silicon pyranometers (Apogee SQ-110) and quantum sensors (Apogee SQ-110) were used at each tower to measure, separately, both downwelling (incident) and upwelling (reflected) shortwave solar radiation from 350–1100 nm and photosynthetically active radiation (PAR) from 400–700 nm at 5 m to 10 m above the forest canopies. The 85 degree field of view from the radiometric sensors provide a viewing radius just over ten times the sensor's height above the target, resulting in a circular canopy footprint with a diameter between 100 m and 150 m (figure 1). Undesirable tower reflectance effects were minimized by mounting the sensors at the end of a three-meter boom off the towers.

Figure 1. Site map of Mata Seca State Park showing the four locations of the 250 m MODIS pixels (squares) selected for vegetation greenness time series comparisons with tower observations including tower footprints (circles) within the pixel. Study sites include an abandoned pasture site (a) and an early (b), intermediate (c), and late (d) successional stage of tropical dry forest.
Download figure:
Standard image High-resolution image2.2. In-situ sensor data
Synchronized above-canopy radiometric observations were sampled each 30 seconds, then averaged and logged at 15 minute intervals. Tower based NDVI was calculated following the methods of Wilson and Meyers (2007) in order to approximate red (ρRED) and near-infrared (ρNIR) reflectance. The tower EVI, properly called EVI2, follows the two-band method of (Jiang et al (2008) and Rocha and Shaver (2009), using a standard gain (G) of 2.5 and a soil-adjustment (L) of 1. These EVI2 parameters were shown to be optimal in relating two bands (red and NIR) indices to MODIS EVI which includes a third band in the blue spectrum (Jiang et al 2008). To minimize high solar zenith effects the tower NDVI and EVI2, hereafter called tower EVI, values were derived using observations taken within 30 min of solar noon (11:30 to 12:30) and cloud filtered for direct beam 'black sky' radiation only based on a minimum incident PAR value of 1000uE. Then these midday values were further aggregated to a daily mean time series called midday Tower NDVI or EVI.
2.3. MODIS data
The MODIS satellite data products used were collection 6 MOD13Q1 and MYD13Q1 vegetation indices (NDVI and EVI) from the Terra and Aqua instruments, respectively, obtained using the Oak Ridge National Laboratory DAAC MODIS land process subset tool (DAAC 2017). MOD13Q1 and MYD13Q1 are both 16 day L3 global 250 m NDVI and EVI time series. The 16 day indices were also combined using a single merge by date to produce an additional 8 day time series since the only 8 day MODIS NDVI/EVI product is offered at 500 m spatial resolution which was too large for our comparative purposes. These vegetation indices are derived from atmospherically corrected bi-directional radiometric surface reflectance values in the blue (469 nm), red (645 nm) and near-infrared (858 nm) MODIS bands that have been further quality control masked for clouds and aerosols. These products were selected over the daily raw MODIS surface reflectance data since the pre-processed data are more readily accessed and commonly applied by researchers unfamiliar with remote sensing process workflows and the non-scientific user community. The four 250 m pixels used were co-located to the coordinates of the ground phenology observation towers and the pixel extent was confirmed using co-registered high-resolution imagery to have a single pure land cover class, which was incorrectly classified as woody savannah in all cases. The MODIS time series data were further subset to match the temporal extent of the in-situ time series including seven growing seasons from 2007–2014.
2.4. Data analysis
2.4.1. Simple linear regressions on raw data
In order to know if the moderate resolution satellite remote sensing is sufficient for monitoring TDF phenology, a series of linear regression analyses within each successional state were performed to describe the trends of VIs extracted by MODIS 8 day satellites products and in-situ measurements. In addition, analyses of covariance (ANCOVA) were conducted to compare the VIs trends between each successional state using MODIS 8 day products as a dependent variable, in-situ measurements as an independent variable, and the successional state as a covariable. The regression analyses and ANCOVA were conducted using R software version 3.4.0 (R Development Core Team 2017) by the functions 'lm' and 'aov', respectively. The ANCOVA was performed assuming a normal distribution of the response and covariable, normality which is difficult to obtain when comparing the data that present seasonality.
2.4.2. Smoothing and one-day interpolation
To the goal to compare the one-day trends of VIs and describe the differences in canopy phenology patterns between ground and satellite observation platforms, data from both sensors were processed in two different steps in order to reduce the noise and errors of the VIs time series, and modeling missing and one-day data. These steps need to be performed due to sporadic sensor errors from the towers due to sensor failures and from MODIS products caused primarily by the presence of clouds and atmospheric variability. These steps and were conducted on each successional stage for particular years where the gap of data was the smallest. In this sense, data of 2013 and 2014 were selected for the pasture, 2012 and 2013 for the early, 2011 and 2013 for the intermediate, and 2011, 2012, 2013, and 2014 for the late successional observations. The application of these steps was performed independently for each year selected on each successional stage; therefore, the reduction of noise and the model of missing or one-day data differ between consecutive years. The noise reduction of the VIs time series was conducted using a smoothing with the average of the measurements, while the model of missing or one-day data was performed using the Savitzky–Golay algorithm which allows re-smooth of the observations and the gap filled. The Savitzky–Golay algorithm was selected because it has been described as a good method to obtain high-quality NDVI time series over the BISE algorithm or Fourier-based fitting method (Chen et al 2004). These steps were performed using the R package 'phenex' (Lange and Doktor 2015) through the functions 'runningAvg' and 'SavGol'.
Such as the regressions applied to the unprocessed data, a series of linear regression analyses were performed on the processed data within each successional state to describe the one-day trends of VIs extracted from Aqua 16 day, Terra 16 day, and MODIS 8 day products based on in-situ measurements. In addition, dynamic time warping (DTW) analysis on the time series of each site and for each selected year was conducted in order to know the possible temporal distortions of the VIs processed from Aqua 16 day, Terra 16 day, and MODIS 8 day products in comparison with in-situ measurements. The DTW analysis allows estimating the best global alignment between two-time series providing the time cost of this alignment which represents the dissimilarity between two numerical sequences or the local time distortions (Petitjean et al 2012). This analysis was conducted using the R package 'dtw' (Giorgino 2009) assuming that the relationship between time series has a symmetric step pattern.
2.4.3. Canopy phenometrics
Canopy seasonal growth phases, or phenophases, of environments with deciduous trees such as the TDF are grouped into four periods according to Zhang et al (2003): (i) green-up, the date of onset of photosynthetic activity, (ii) canopy maturity, the date at when the ecosystems shows the maximum photosynthetic activity or leaf area, (iii) leaf senescence, the date at with the leaf area or photosynthetic activity starts to decrease rapidly, and (iv) canopy dormancy, the date at when the ecosystems shows minimum physiological activity or leaf area. These four periods were extracted from each site using the processed data extracted above in order to know if there are differences in the phenophases detected coarser temporal resolution satellite observations and in-situ daily measurements. These periods were calculated using each selected year for the different sites and are reported according to the Julian day. Each period was extracted using the R package 'phenex' (Lange and Doktor 2015) by the function 'phenoPhase()' using the 'min' and 'max' as the date in which the VIs present the lowest and highest values; and 'greenup' and 'senescence' as the date in which the VIs values exceeds a certain threshold. A dynamic local threshold was selected for each year according to the differences between the maximum and minimum values VIs.
3. Results
3.1. Greenness trends and forest successional stage
Observation of raw time series data of VIs showed slight differences in amplitude between successional stages, where later successional stages presented higher values of NDVI and EVI during the peak of the growing season and the bottom of the dry season in comparison with earlier successional stages (figure 2). All sites showed similar temporal trends in overall seasonality; however, phenology observations extracted from MODIS for the abandoned pasture appear to be delayed in comparison with early, intermediate, and late successional stage. Likewise, when one-day tower and 8 day MODIS observations were plotted together, it became evident that VIs extracted from phenology towers a had lower amplitude than the MODIS trends, where tower observations showed higher values of NDVI and EVI during the dry season than MODIS products (figure 3). Regarding unexpected values or noise, the greatest amount of noise of VIs from tower observations were observed near to the end of the dry season when the forest canopy was devoid of any leaves, while for MODIS products the noise was distributed on sporadic dates through the whole time series.

Figure 2. Time series for all raw MODIS and tower NDVI and EVI observations from 2008–2014 comparing greenness trends in an abandoned pasture, early, intermediate, and late successional stage of tropical dry forest at Mata Seca State Park, Brazil.
Download figure:
Standard image High-resolution image
Figure 3. Direct time series comparisons of raw data from MODIS 8 day composite NDVI and EVI paired with daily observations from near-surface phenology towers for abandoned pasture, early, intermediate, and late successional stage of tropical dry forest at Mata Seca State Park, Brazil.
Download figure:
Standard image High-resolution image3.2. Raw data tower–MODIS relationship
Simple linear regression analysis of the relationship between tower and MODIS 8 day products revealed that the NDVI and EVI tend to have determination coefficients in a range of 0.73−0.78 (table 1). In average, determination coefficients of the relationships of NDVI regardless of the site were slightly higher (R2 = 0.76) than the determination coefficients of the relationships of EVI (R2 = 0.75). According to the slope and intercept, MODIS products tend to underestimate and overestimate the VIs at lower and higher values, respectively (table 1, figure 4). An exception to the latter is the VIs relationship for abandoned pasture in which MODIS products always underestimate the values of NDVI and EVI. Likewise, the ANCOVAs suggest that the tower observations are able to predict MODIS products (NDVI: F(1630) = 2203.29, p = < 0.001; EVI: F(1634) = 1883.52, p = < 0.001) and these products are different between successional stages (NDVI: F(3630) = 17.67, p = < 0.001; EVI: F(3634) = 9.91, p = < 0.001). However, both ANCOVAs for NDVI and EVI revealed that there is no an interaction between tower observations and the different successional stages to predict MODIS products stages (NDVI: F(3630) = 0.92, p = 0.43; EVI: F(3634) = 0.60, p = 0.62), which suggest that the observed slopes above are equal.

Figure 4. Scatter plot of the relationship between tower and satellite measurements of NDVI and EVI for abandoned pasture, early, intermediate, and late successional stage of tropical dry forest at Mata Seca State Park, Brazil. Results for each linear regression are presented in table 1.
Download figure:
Standard image High-resolution imageTable 1. Parameters from simple linear regressions of the relationship between tower and satellite raw data of vegetation indices (NDVI and EVI) for abandoned pasture, early, intermediate, and late successional stage of tropical dry forest at Mata Seca State Park, Brazil. All regressions showed p-values lower than 0.001.
| Simple linear regression parameters | |||||
|---|---|---|---|---|---|
| VI | Successional stage (degree of freedom) | Intercept | Slope | R2 | F-ratio |
| NDVI | Pasture (1, 120) | −0.42 ± 0.05 | 1.43 ± 0.07 | 0.77 | 397.82 |
| Early (1, 153) | −0.44 ± 0.05 | 1.56 ± 0.07 | 0.75 | 466.26 | |
| Intermediate (1, 185) | −0.45 ± 0.04 | 1.60 ± 0.06 | 0.77 | 624.59 | |
| Late (1, 173) | −0.45 ± 0.05 | 1.58 ± 0.06 | 0.78 | 598.72 | |
| EVI | Pasture (1, 121) | −0.16 ± 0.02 | 1.19 ± 0.06 | 0.78 | 438.54 |
| Early (1, 153) | −0.14 ± 0.02 | 1.19 ± 0.06 | 0.75 | 445.37 | |
| Intermediate (1, 187) | −0.15 ± 0.02 | 1.31 ± 0.05 | 0.76 | 586.84 | |
| Late (1, 173) | −0.14 ± 0.02 | 1.25 ± 0.06 | 0.73 | 472.98 | |
3.3. Processed data tower–MODIS relationship
The relationships between ground and satellite products from the processed data showed a remarkable increase of the determination coefficients than the unprocessed data (table 2). In general, these relationships showed determination coefficients in a range of 0.81−0.96 and 0.80−0.94 for the NDVI and EVI relationships, respectively. These determination coefficients do not appear to differ between successional stages; however, the determination coefficients extracted from the combination of Aqua and Terra products (NDVI, R2 = 0.93; EVI, R2 = 0.91) tends to be higher than Aqua (NDVI, R2 = 0.85; EVI, R2 = 0.84) and Terra (NDVI, R2 = 0.89; EVI, R2 = 0.85) per se. Despite the increase of strength of the relationships between ground and satellite observation, processed data form MODIS products such as unprocessed data tends to underestimate and overestimate the VIs at lower and higher values, respectively, of NDVI (figure 5) and EVI (figure 6). Likewise, such as the relationships of unprocessed data the exception to these trends is the VIs relationship for abandoned pasture in which Aqua, Terra, and their combination always tend to underestimate the values of NDVI and EVI.
Table 2. Parameters extracted from the simple linear regressions of the relationship between one-day estimations of vegetation indices (NDVI and EVI) from tower and satellite data for abandoned pasture, early, intermediate, and late successional stage of tropical dry forest at Mata Seca State Park, Brazil. All regressions showed p-values lower than 0.001.
| Simple linear regression parameters | ||||||
|---|---|---|---|---|---|---|
| VI | Successional stage (degree of freedom) | Sensor | Intercept | Slope | R2 | F-ratio |
| NDVI | Pasture (1, 726) | Aqua | −0.25 ± 0.01 | 1.16 ± 0.02 | 0.85 | 4242.36 |
| Terra | −0.33 ± 0.01 | 1.27 ± 0.02 | 0.88 | 5431.22 | ||
| Aqua & Terra | −0.52 ± 0.01 | 1.54 ± 0.01 | 0.94 | 10653.24 | ||
| Early (1, 727) | Aqua | −0.24 ± 0.01 | 1.27 ± 0.01 | 0.89 | 6189.56 | |
| Terra | −0.33 ± 0.01 | 1.44 ± 0.01 | 0.94 | 11934.65 | ||
| Aqua & Terra | −0.51 ± 0.01 | 1.67 ± 0.01 | 0.96 | 19360.53 | ||
| Intermediate (1, 727) | Aqua | −0.19 ± 0.01 | 1.19 ± 0.02 | 0.81 | 3031.96 | |
| Terra | −0.22 ± 0.01 | 1.22 ± 0.02 | 0.84 | 3843.14 | ||
| Aqua & Terra | −0.44 ± 0.02 | 1.55 ± 0.02 | 0.88 | 5226.16 | ||
| Late (1, 1458) | Aqua | −0.17 ± 0.01 | 1.18 ± 0.02 | 0.86 | 9305.72 | |
| Terra | −0.17 ± 0.01 | 1.17 ± 0.01 | 0.88 | 10716.09 | ||
| Aqua & Terra | −0.40 ± 0.01 | 1.52 ± 0.01 | 0.94 | 23308.92 | ||
| EVI | Pasture (1, 726) | Aqua | −0.03 ± 0.01 | 0.87 ± 0.02 | 0.82 | 3231.71 |
| Terra | −0.04 ± 0.01 | 0.83 ± 0.01 | 0.82 | 3263.60 | ||
| Aqua & Terra | −0.13 ± 0.01 | 1.09 ± 0.01 | 0.90 | 6303.66 | ||
| Early (1, 727) | Aqua | −0.50 ± 0.01 | 1.02 ± 0.01 | 0.90 | 6676.22 | |
| Terra | −0.04 ± 0.01 | 1.02 ± 0.01 | 0.90 | 6147.09 | ||
| Aqua & Terra | −0.15 ± 0.01 | 1.26 ± 0.01 | 0.94 | 10649.17 | ||
| Intermediate (1, 727) | Aqua | −0.07 ± 0.01 | 1.06 ± 0.01 | 0.81 | 3077.75 | |
| Terra | −0.04 ± 0.01 | 1.03 ± 0.02 | 0.80 | 2923.91 | ||
| Aqua & Terra | −0.16 ± 0.01 | 1.30 ± 0.02 | 0.85 | 4004.52 | ||
| Late (1, 1091) | Aqua | −0.03 ± 0.01 | 0.91 ± 0.01 | 0.84 | 5692.08 | |
| Terra | −0.02 ± 0.01 | 0.93 ± 0.01 | 0.87 | 8487.01 | ||
| Aqua & Terra | −0.13 ± 0.01 | 1.16 ± 0.01 | 0.93 | 15417.73 | ||

Figure 5. Time series of NDVI one-day estimations from ground an satellite products and their relationship in abandoned pasture, early, intermediate, and late successional stage of tropical dry forest at Mata Seca State Park, Brazil. Results for each linear regression are presented in table 2.
Download figure:
Standard image High-resolution image
Figure 6. Time series of EVI one-day estimations from ground an satellite products and their relationship in abandoned pasture, early, intermediate, and late successional stage of tropical dry forest at Mata Seca State Park, Brazil. Results for each linear regression are presented in table 2.
Download figure:
Standard image High-resolution image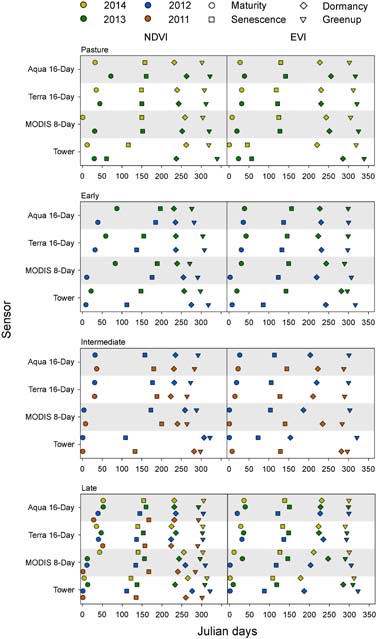
Figure 7. Julian day of the phenophases predicted by one-day estimations of NDVI and EVI from ground and satellite products in abandoned pasture, early, intermediate, and late successional stage of tropical dry forest at Mata Seca State Park, Brazil.
Download figure:
Standard image High-resolution image
3.4. Dissimilarity between time series and phenophases
The DTW analysis performed to know the dissimilarity between time series of processed data from ground and satellite observation suggest that the trends observed from Aqua, Terra, and their combinations tends to have a dissimilarity of 18.62 ± 11.19 days on NDVI and 14.05 ± 7.04 days on EVI regardless the successional stage or the time series year (table 3). On average between products and regardless the year, this dissimilarity tends to be higher in the abandoned pasture (NDVI = 39.39 ± 3.77 days; EVI = 24.43 ± 2.92 days) than late (NDVI = 13.01 ± 3.65 days; EVI = 14.90 ± 2.65 days), intermediate (NDVI = 15.16 ± 6.76 days; EVI = 8.63 ± 4.74 days), and early successional stage (NDVI = 12.51 ± 3.27 days; EVI = 7.86 ± 3.66 days). Compared to satellite products and regardless the year and the successional stages, the DTW analyses revealed that Terra observations tend to have less dissimilarity (NDVI = 16.71 ± 11.91 days; EVI = 12.87 ± 7.96 days) than Aqua (NDVI = 18.26 ± 12.29 days; EVI = 14.44 ± 6.99 days), or Aqua−Terra (NDVI = 20.89 ± 8.61 days; EVI = 14.87 ± 5.85 days) based on ground measurements.
Table 3. Dissimilarity in days of the comparison of one-day time series for ground and satellite observations of NDVI and EVI in abandoned pasture, early, intermediate, and late successional stage of tropical dry forest at Mata Seca State Park, Brazil.
| Comparison | |||||
|---|---|---|---|---|---|
| VI | Successional Stage | Year | Tower−Aqua 16 day | Tower−Terra 16 day | Tower−MODIS 8 day |
| NDVI | Pasture | 2013 | 45.74 | 36.23 | 37.24 |
| 2014 | 37.42 | 42.29 | 37.42 | ||
| Early | 2012 | 9.90 | 9.69 | 18.11 | |
| 2013 | 13.06 | 10.30 | 14.02 | ||
| Intermediate | 2011 | 8.11 | 6.71 | 13.26 | |
| 2012 | 20.66 | 19.90 | 22.33 | ||
| Late | 2011 | 8.52 | 7.69 | 16.01 | |
| 2012 | 12.12 | 10.21 | 17.24 | ||
| 2013 | 11.86 | 9.28 | 14.13 | ||
| 2014 | 15.22 | 14.76 | 19.18 | ||
| Average | 18.26 ± 12.29 | 16.71 ± 11.91 | 20.89 ± 8.61 | ||
| EVI | Pasture | 2013 | 23.80 | 22.30 | 21.72 |
| 2014 | 22.76 | 29.08 | 26.92 | ||
| Early | 2012 | 11.85 | 9.74 | 10.69 | |
| 2013 | 4.04 | 2.88 | 7.98 | ||
| Intermediate | 2011 | 3.43 | 3.15 | 8.28 | |
| 2012 | 15.04 | 9.60 | 12.27 | ||
| Late | 2012 | 17.55 | 14.31 | 15.52 | |
| 2013 | 19.79 | 11.68 | 15.63 | ||
| 2014 | 11.69 | 13.08 | 14.81 | ||
| Average | 14.44 ± 6.99 | 12.87 ± 7.96 | 14.87 ± 5.85 | ||
In relation with the phenophases, the results suggest that the phenological dates slightly differ between ground and satellite observations in some phenological phases (figure 8). For example, the canopy maturity tends to be earlier for all the sites in the estimations from tower and Aqua−Terra than the estimations of Aqua and Terra. Meanwhile, the estimates of canopy senescence tend to be earlier in the tower predictions than in the satellite estimations. This trend of canopy senescence is more evident in the abandoned pasture than the other sites. Likewise, the Julian day estimations of canopy dormancy and green-up for the early and intermediate successional stage tend to be earlier in the predictions of Aqua, Terra, and Aqua−Terra than in the tower observations, but this trend does not appear to be constant for abandoned pasture and the late successional stage.
4. Discussion
Direct comparisons of long term, multi-annual measurements of vegetation greenness from satellite and near surface remote sensing are rare in the tropics due to the challenges associated with implementing and maintaining sensitive radiometric instrumentation. In this study from a TDF in southeastern Brazil revealed there are several advantages to near-surface remote sensing over satellite monitoring of forest phenology. The accuracy of the in-situ forest canopy greenness indices is improved largely due to the enhanced temporal resolution and lack of atmospheric interference and therefore is an ideal approach for validation of satellite observations of long term change in TDF productivity as well as to pin-point ecosystem level research to changes on ecological succession, and the impact of global and climate change on phenology driven ecosystems.
4.1. Directly comparing indexes
While direct comparisons of ground and MODIS vegetation indices showed strong correlations (after filtering out erroneous data) there are several relevant factors that can account for the 10%–25% range of scatter in the regressions and the modest standard errors, ignoring the relatively small differences in target footprints and the confounding effects of atmospheric corrections (Franch et al 2013). First, the sensor-target viewing geometry and reflectance functions become complicated for rough, non-Lambertian target surfaces like those of tall, heterogeneous forest canopies (Li and Strahler 1992, Gerard and North 1997). In the temporal domain, Breunig et al (2015) reported on the seasonal effects of solar illumination geometry variations in the MODIS NDVI and EVI of a Brazilian deciduous subtropical forest and found that canopy reflectance anisotropies were significantly affected by changes in leaf area and that the effect was more pronounced in the EVI. Target proximity effects are also important with respect to light scattering and reflectance distribution above an old growth tropical forest where complex canopy structure and gap shadows can create significant anisotropies in reflected radiation (Ranson et al 1994). These effects may introduce greater short-term reflectance signal bias at the near target viewing angles of tower-based sensors compared to satellite observations. To minimize this effect it is recommended to place downward facing sensors sufficiently high above the forest canopy, at least 10 m, but this is often restricted by the logistics of building non-invasive structures within a protected, old-growth tropical forest upwards of 20–30 m in height.
The variation in the strength and the regression slopes of the relationships found between in-situ and MODIS VIs differed between successional stages of TDF. Since the agreement between the two was slightly higher for the late stage forest than for the early stage and abandoned pasture, it could be that the open canopy structure of the younger forest stage created higher variability between the vegetation indices. Related to this is the relative contribution of understory vegetation in the reflectance signals. Close proximity of the tower sensors to the forest likely results in a greater contribution of the understory vegetation to the total reflectance at the tower than from the MODIS perspective. For this reason, and due to the higher temporal resolution of the tower NDVI/EVI time series, any mistiming between overstory and understory leaf phenology would be more pronounced in the in-situ time series than from the 8 or 16 day MODIS observations. Ryu et al (2014) recently showed that multi-layered forest canopies can exhibit significantly different timing between understory and overstory green-up events and that the understory canopy development in a temperate deciduous forest was responsible for the MODIS based onset date of greenup rather than that of the overstory which was offset by about 10 days. While the decoupling of understory and overstory canopy development using MODIS has been demonstrated in boreal forests (Pisek et al 2015) where the tree canopy is sparse, dense broadleaf canopies occlude such observations from satellite and as such more work needs to be done in-situ to understand the nature of multi-layered canopy phenology in TDFs. Specifically in early and intermediate successional stages, where dominant understory grasses and shrubs with shallow root systems can flush their leaves before trees and lianas in response to the first rains of growing season (Madeira et al 2009, Kalacska et al 2005).
Another important distinction between the two observation systems that undoubtedly causes discrepancies in direct comparisons are the spectral bands used to produce the indices. Differences in spectral response functions of sensors is a major limitation in current cross-platform validation of Earth observation sciences (Huang et al 2013). While the MODIS standard VI products are narrowband centered on the red, near infrared, and blue (for EVI) wavebands, the tower-based products are broadband vegetation indices that approximate the red and NIR reflectances in the full visible and shortwave radiation spectrums. Theoretically, a narrowband NDVI or EVI should be more sensitive to changes in leaf area and chlorophyll content than a broadband version given the nature of the relationship between the absorption and reflectance features of green vegetation. This might explain why the tower based greenness seasonality appears more depressed than the MODIS time series at all four sites, seen in figure 3. So while the MODIS time series contains more noise from sporadic data values, the enhanced greenness sensitivity of the MODIS narrowband VIs might prove more useful than broadband radiometric VIs for leaf area index estimations in dense TDF stands where the relationship between spectral indices and biophysical parameters are known to saturate.
Lastly, the correlations found between tower and MODIS NDVI may be stronger than EVI since the MODIS 16 day maximum value composite method relies on reflectance values for optimal NDVI and the EVI calculations are based on the same values (Gao et al 2003). So while we see here a greater temporal agreement between tower and MODIS NDVI, this may be in part due to the temporal compositing of the standard 16 day products. Furthermore, the MODIS composite method makes exact matching between observation dates difficult as the actual date of reflectance value acquisition is not known. While a more accurate MODIS data set is available for scientific user group that includes the actual collection DOY for a given composite NDVI/EVI data point, rather than the 8 day interval date provided, we wanted to compare our ground data to the most commonly used MODIS standard VI products (MOD13Q1/MYD13Q1). That being said, the main objective of this paper was not to assess the absolute scale agreement in the NDVI and EVI dimensions between MODIS and tower platforms, and while this is worth exploring, our main contribution here relates to the temporal domain for assessing discrepancies in phenology observations.
4.2. Monitoring TDF seasonality
Despite a long history of vegetation phenology research, there is still little agreement or standardization of phenometric definitions or methods for determining key transition dates in remotely sensed vegetation seasonality (White and Nemani 2006, Ahl et al 2006). This lack of agreement is contributing to discrepancies regarding the impact of global environmental and climate change on phenology driven ecosystems. Curve amplitude threshold methods, applied to raw and normalized VIs, are often the simplest to implement and interpret but threshold values can be arbitrarily chosen and may not apply to all ecosystems equally. In addition, a threshold method only indicates start and end of season dates and cannot be used to determine the onset timing of each canopy development phases. Onset dates are required to assess the duration and rates of canopy green-up, maturity, and senescence which are important parameters to monitor closely in order to quantify TDF sensitivity to climatic change and variability. For these reasons, we applied first and second order time series derivative methods to identify phenophase transitions based on rates of curvature change in the smoothed vegetation indices rather than amplitude threshold approaches. Furthemore, we did not use the third derivate approach since this function can be used to locate earlier transition points closer to the onset of a change in curvature but tends to be a much more subjective method due to high sensitivity to noise in the original data. This approach also allows for the identification of peak rates of greenness increase and decrease based on inflection points which is the often what the 50% amplitude threshold values attempts to estimate to represent the start and end of season dates (Ahl et al 2006, Zhang et al 2003).
It is worth noting that the transition dates selected for this study do not perfectly coincide with the onset of greenness increase or decrease. Rather our dates coincide with the peak rates of change that occur immediately (one or two days) following an increase in greenness or prior to a greenness decrease. In this way the method used avoids selecting artificial increases in the VIs that do not represent a significant biophysical change in the forest leaf area. Also worth discussing is the presence of increased low amplitude noise in both the tower NDVI and EVI in the weeks immediately prior to the green-up event. This is most likely due to the first rainfall events of the season wetting the soil and tree branches. These events cause rapid changes in surface water content, which in turn affects the visible and shortwave radiation albedos. It is important to stress that these short-term increases in the late dry season signal did not likely represent changes in photosynthetic biomass. When this effect was not filtered properly it was found to increase the SOS date by over 2 weeks which is significant in TDF environments given the fast rate of leaf development that occurs right after the first rains arrive.
In our analysis there are large discrepancies between the canopy transition dates as observed from MODIS compared to our near-surface remote sensing tower observations. Much of this disagreement can presumably be attributed to the lower temporal resolution of the satellite product and the MODIS data compositing methods. Greater intervals between observations in a time series leads to increased inaccuracies during interpolation, thus during periods of rapid canopy development at the onset of the rainy season and leaf wilting during drought, the MODIS 16 day products will fail to capture accurate transition dates for this TDF environment. Similarly, the maximum value composite approach, while beneficial for minimizing erroneous NDVI/EVI data, introduces greater uncertainty in determining accurate canopy phenology information by potentially missing important leaf area dynamics or leaf chlorophyll content transition events at the start and end of the growing season at the Mata Seca State Park.
As previously mentioned, the length of growing and dormant seasons are important phenometric variables for monitoring climate change in TDFs due to the responsivity of TDFs to water availability (REF). Linkages between tropical forest phenology and climate variability are poorly understood compared to temperate regions where models of vegetation phenology, often based on growing degree-days, have become increasingly robust (Zhang et al 2003). More research needs to be done to relate TDF canopy biophysics with meteorological drivers. For example, multiyear variability in phenophase duration and transition rates may be an indicator of canopy stress or adaptive responsivity to uncharacteristic weather patterns. A slow start of season leaf development rate, represented by a longer green-up phase, may relate the effects of water limitations or reduced plant energy stores from a longer dry season or shorter growing season the previous year. A longer senescence period could be the forest's response to rainfall late in the growing season, which can be a significant sink of carbon in years with longer growing seasons. Rainfall events early in the dry season when leaves are still present in the canopy can be more readily utilized than water made available late in the dry season when a second leaf flush may be required (Reich and Borchert 1984). Such climatic events can impact tree mortality and species dynamics during forest succession and may be monitored over long periods using higher frequency satellite observations paired with detailed phenometric analysis.
TDFs do not present the typical challenges associated with most forest phenology assessment methods, as these are primarily targeted to temperate regions where snowfall typically interferes with the reflectance signals (White et al 2014). In higher latitude forests, freezing temperatures and snow occur suddenly and canopy senescence is more often a rapid process. We found that the greatest uncertainty in phenology transition determination in a TDF canopy was during the onset of senescence. The water stress tolerance of TDF vegetation and late season water pulses leads to a slow senescence of deciduous vegetation and instability in the greenness curve which does not provide a distinct enough change point for determining a single onset point for canopy senescence, specifically using an EVI time series. We suggest using NDVI for selecting the onset of senescence in TDFs rather than EVI, and choosing the point of most rapid decline in canopy greenness based on the first order derivative when determining the end of season for high temporal resolution VI observations.
5. Conclusions
Remote sensing scientists need to assess the validity of phenology observations made using space-based optical sensors for long term monitoring of the effects of climate change on ecosystem productivity. TDFs serve as important biological indicators of shifting climate patterns and land-atmosphere moisture dynamics in the semi-arid tropics, but are highly fragmented and degraded with little known about their patterns of growth and recovery during secondary succession.
As today, no previous studies are known to be reported in Neotropical TDFs or along a successional forest age gradient to compare, and validate remotely sensed phenology data products. This is the first known empirical observation of continuous near-surface remote sensing of TDF phenology in the Americas
From this study, we conclude that the standard MODIS vegetation index time series products MOD13Q1/MYD13Q1 do represent the phenology of this Brazilian ecosystem well enough for qualitative purposes, but for more accurate quantitative assessment and inter-annual comparisons of seasonal productivity a higher temporal resolution time series is required, such as the MODIS NBAR derived indices. MODIS standard products with maximum value composite time series should not be used to determine phenology transition dates where temporal accuracy greater than the composite window of 16 days is required. Furthermore, the MODIS collection 6 NDVI/EVI product still suffers from frequent cloud contamination during the onset of the rainy season when the rate of leaf growth is greatest and changes in biosphere–atmosphere exchanges are most significant with important implications to studies aimed to evaluate the impact of climate change in this important tropical ecosystem.
Acknowledgments
This work was supported by the National Science and Engineering Research Council of Canada (NSERC) Discovery grant program, and the Inter-American Institute for Global Change Research (IAI) as part of its Collaborative Research Network Program (Tropi-Dry CRN3–25).
ORCID iDS
G A Sánchez-Azofeifa https://orcid.org/0000-0001-7768-6600
J Antonio Guzmán https://orcid.org/0000-0002-0721-148X