

Abstract
With over 1 billion cattle in the world as well as over 2 billion sheep, goats and buffalo, these animals contribute approximately 15% of the global human protein supply while producing a significant proportion of anthropogenic emissions of greenhouse gases and global nutrient fluxes. Despite increasing reliance on grazers for protein production globally, the future of grazers in a changing world is uncertain. Factors such as increased prevalence of drought, rising atmospheric CO2 concentrations, and sustained nutrient export all have the potential to reduce cattle performance by reducing the nutritional quality of forage. However, there are no analyses to quantify changes in diet quality, subsequent impact on cattle performance and cost of supplementation necessary to mitigate any predicted protein deficiency. To quantify the trajectory of nutritional stress in cattle, we examined more than 36 000 measurements of dietary quality taken over 22 yr for US cattle. Here, we show that standardizing for spatial and temporal variation in drought and its effects on forage quality, cattle have been becoming increasingly stressed for protein over the past two decades, likely reducing cattle weight gain. In economic terms, the replacement costs of reduced protein provision to US cattle are estimated to be the equivalent of $1.9 billion annually. Given these trends, nitrogen enrichment of grasslands might be necessary if further reduction in protein content of forages is to be prevented.
Export citation and abstract BibTeX RIS

Original content from this work may be used under the terms of the Creative Commons Attribution 3.0 licence.
Any further distribution of this work must maintain attribution to the author(s) and the title of the work, journal citation and DOI.
Introduction
With over 1 billion cattle in the world as well as over 2 billion sheep, goats and buffalo, these livestock species contribute approximately 15% of the global human protein supply while producing a significant proportion of anthropogenic emissions of greenhouse gases and global nutrient fluxes (Steinfeld et al 2006, Bouwman et al 2011, Estell et al 2012, Ripple et al 2013, FAOSTAT 2017). Despite increasing reliance on grazers for protein production globally, the future of grazers in a changing world is uncertain. Factors such as elevated temperatures, reduced precipitation, rising atmospheric CO2 concentrations, and sustained nutrient export all have the potential to reduce cattle performance by reducing the nutritional quality of forage. Yet, there are no analyses of whether cattle are becoming more nutritionally stressed over time, rendering us unable to determine whether there will be reduced livestock production or a greater need for nutritional supplementation in the future, which would strain natural resources even more.
The crude protein concentration ([CP]) of cattle diet—essentially tissue nitrogen concentrations of consumed plants—often limit cattle weight gain throughout the US, with metabolizable energy derived from digestible organic matter (DOM) in forage a secondary limitation (Craine et al 2010a). Focusing on [CP], despite a number of factors likely to be affecting [CP] in cattle diet, there are little data to assess how [CP] responds to environmental conditions and whether there have been any long-term trends in cattle dietary [CP]. For example, drought might reduce dietary [CP] if water stress promotes senescence (Heckathorn and Delucia 1994). Alternatively drought could increase dietary [CP] if drought reduces photosynthesis more than N uptake, limits protein-poor culm production, or cattle shift which species they consume (Heckathorn and Delucia 1996, Craine et al 2010b). If droughts become more common in the future, the subsequent reduced forage production in isolation would be expected to lower cattle production. Yet, these reductions in productivity could be either offset or exacerbated by changes in [CP] depending on how [CP] responds to drought at a particular time of year (Craine et al 2013). Beyond the specific consequences of droughts for dietary quality, a number of other factors such as rising atmospheric CO2, warming, and sustained export of nutrients contained in animal biomass all have the potential to chronically reduce soil nutrient availability and consequently dietary nutritional quality (Ainsworth and Long 2005, An et al 2005, McLauchlan 2007).
To test how cattle dietary quality responds to drought and whether there have been trajectories in cattle dietary quality independent of any trends in drought, we utilize a long-term dataset of 36 599 independent measurements of cattle dietary quality obtained throughout the US over a 22 year period. Dietary quality metrics include [CP], as well as digestible organic matter concentration ([DOM]), which is an index of energy availability in forage (Moore et al 1999). As drought conditions have been becoming more common in the central US over the past 20 yr (Dai 2012), we first determine how dietary quality responds to drought for each of ten US ecoregions (figure S1, available at stacks.iop.org/ERL/12/044019/mmedia). We examine relationships between dietary quality metrics that have been standardized for typical seasonal patterns in these metrics and the Palmer Drought Severity Index (PDSI) (Alley 1984) quantified at the time of dietary quality assessment.
Methods
Data acquisition
Data on cattle dietary quality were assembled by the Grazingland Animal Nutrition Lab (GANLab), a commercial service and research laboratory of Texas A & M AgriLife Research (Lyons and Stuth 1992). Since 1994, fecal samples from grazing cattle have been analyzed with near infrared spectroscopy (NIRS) to predict [CP] and [DOM] (Roberts et al 2004). Livestock producers and managers across the US collect fresh fecal samples from five to ten animals within a given herd. These samples are mailed to GANLab fresh or frozen to be analyzed for dietary quality. Upon arrival at the lab, samples are dried at 60 °C in a forced air oven, ground to 1 mm particle size and dried again at 60 °C prior to scanning (Lyons and Stuth 1992). Spectra (400–2500 nm) are collected on a Foss® NIRS 6500 scanning monochrometer with spinning cup attachment.
Sample analysis
Calibration curves between reference chemistry and chemometrics for NIRS that predict forage chemistry from fecal spectra were described by Showers et al (2006). Since 1994, two sets of calibration equations have been used. All dietary quality metrics before June 2009 were run with the original set of calibration equations and those after June 2009 were calculated with the second. For this analysis, we were able to locate some of the original NIRS spectra and recalculate dietary quality metrics using new calibrations for 66% of measurements from 1994–2009 Comparing CP for original and new calibrations for samples collected between day of year (DOY) 60–239, CP measured with the two methods were correlated at r = 0.83, with no significant average difference between the two (P = 0.47). For DOM, the two calibrations generated DOM measurements that were correlated at r = 0.76. DOM with the new calibration equations was 3.5% greater than with the original calibration equations (638 vs. 616 mg g−1; P < 0.001). Using the relationships between the two, all CP and DOM values still calculated with the original calibration equations were adjusted using the following equations: CPnew = CPorig ⁎ 0.924 + 0.728; DOMnew = DOMorig ⁎ 0.669 + 18.927.
Data analysis
For our analyses here, data on [CP] and [DOM] were compiled between Jan 4, 1994 and December 31, 2015. Although animals might receive supplemental minerals, samples from cattle that had received supplemental food such as hay or grain or were allowed to graze on alfalfa were removed from the dataset. Samples having poor NIRS prediction statistics were also removed where the H-value > 8. The H-value is the Mahalanobis distance between the spectrum of the fecal sample and the mean spectrum of the calibration dataset (Tolleson and Schafer 2014). Data were averaged across any samples that were collected at a particular location on the same date. Sample density was highest from 1996–2002 and 2011−2015, with relatively fewer samples in the intervening years (online supplementary figure S2).
Data were analyzed separately for each of 10 eco-climatic regions of the National Ecological Observatory Network (Dobrowski et al 2013) for which there were enough data to analyze patterns over time. For each region, we characterized the seasonal pattern of [CP], [DOM], and [DOM]:[CP] by fitting a smoothing spline for each metric as a function of day of year. We then calculated residual dietary quality for each sample. These data were then used in a linear model for each region for each of the three seasons: spring (DOY = 90−149), summer (DOY = 150−239), and autumn (DOY = 240–299). Each model included PDSI of the month in which the sample was collected, year as a continuous factor, site latitude, site longitude, and a categorical representation of the location from which the sample was derived, which is included in the model as a random effect. All samples within each 0.1° latitude and longitude were considered to be from the same 'location'. PDSI data were obtained from National Center for Atmospheric Research Climate and Global Dynamics Laboratory (www.cgd.ucar.edu/cas/catalog/climind/pdsi.html), and consisted of gridded monthly PDSI over global land areas computed using observed or modeled monthly surface air temperature and precipitation that serve as inputs for a water balance model (Dai 2012). PDSI values range from −10 to +10, with low values representing high drought. Among the 10 regions, there were statistically significant responses to drought in previous months, but these appeared stochastic and did not meaningfully affect the patterns over time. Model coefficients were extracted from each regression to calculate dietary quality that was standardized for region, PDSI, latitude, and longitude, but not year. The resultant data were then averaged for each year with the annual value weighted by the number of replicates. Trajectories in PDSI were calculated by first averaging current month PDSI values for each season and year. Annual average PDSI values were then regressed against year. To determine the responses of dietary quality to drought, we ran models of residual dietary quality metrics as functions of PDSI from the month the sample was taken. The linear model also included the year the sample was taken as a continuous variable to test for trajectories of dietary quality over time, as well as latitude and longitude for each domain to account for any intra-regional geographic gradients in sampling that might vary over time.
All statistics were performed in either R version 3.2.5 and included the smatr and lme4 packages or JMP 12.1.0 (SAS Institute Inc. Cary, NC, USA).
Modeling weight gain
To calculate the effect of changes in dietary quality for weight gain of a typical animal, we parameterized the NUTBAL model of cattle growth (Stuth et al 1999, Stuth et al 2002) with data on forage quality and weather. The NUTBAL model uses data on forage quality and weather conditions to predict average daily gain based on the NRC system for assigning intake values and nutrient requirements to individuals as modified by a number of animal attributes such as breed, sex, age, and lactation. The model was parameterized for two classes of animals: 1) an Angus cow that was 36 months of age, calved in April, and weaned its calf in October and 2) an Angus steer that started at 12 months of age. Weather data were derived for the geographic center of all the samples of this study (39.81°, −101.44°) from Daymet version 2 (Thornton et al 2014) and averaged across all years for each day the year. The same daily temperature and humidity data were used for the 1994 and 2015 simulations in order to isolate the effects of forage quality independent of any changes in weather conditions that occur over time (or between the two years). Daily [CP] and [DOM] for 1994 and 2015 were parameterized by first fitting a smoothing spline to all of the data for [CP] and [DOM] and then adjusting the values based on the rates of change in forage qualities over time for each season. Weight gain was calculated every 10 d and the simulation run for DOY 60–329. No supplementation of protein or energy was provided in the model, so weight changes were reflective of the forage quality. For the 1994 and 2015 scenarios, the [CP], [DOM], maximum and minimum temperatures, and humidity values were the only parameters that were changed each 10 d for each scenario. All of other variables in the model were held constant.
Calculating economic costs
To generate the economic cost of the protein debt, the average decline in [CP] was calculated over a 270 d period between 1994 and 2015. This decline was used in conjunction with the seasonal pattern of [CP] to calculate the estimated seasonal pattern of [CP] in 1994 and 2015. The amount of forage consumed per animal in each of these years was calculated for 86 million cattle assuming a standard 200 kg weight for 12 million calves and 500 kg for the 59 million older animals not on supplemental feed. Cattle population numbers were derived from National Agricultural Statistics Service of the US Department of Agriculture. Each animal was assumed to consume the equivalent of 2.5% of its body weight per day (Subcommittee on Beef Cattle Nutrition-Committee on Animal Nutrition-National Research Council 2000). The amount and cost of soy meal required to close the protein gap between the two years was calculated assuming that soybean meal has a [CP] of 48% and cost $0.36 per kg (www.nasdaq.com/markets/soybean-meal.aspx). Data on changes in mean temperature for each sample location were derived from daily weather data from 1994–2015 derived from Daymet version 2 (Thornton et al 2014). Trends in temperature were determined for all 1° latitude and longitude grid cells where samples were taken with mean changes in temperature averaged at the 1° scale.
Results
Across all samples collected from spring through autumn, irrespective of location of origin, [CP] was an average of 9.57 ± 0.12 mg g−1 lower in 2005–2015 than 1994–2004 when compared on the same day of year (100.0 mg g−1 vs. 90.5 mg g−1, respectively; P < 0.001; figure 1). In contrast to [CP], [DOM] was higher in later years than earlier years (2.0 ± 0.2 mg g−1, P < 0.001; figure 1). The increase over time in [DOM] and decline in [CP] led to an increase in [DOM]:[CP], which was 13% higher in 2005–2015 than 1994–2004 (P < 0.001; figure 1).
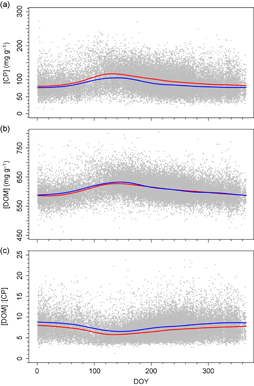
Figure 1 Day of year (DOY) vs. (a) [CP], (b) [DOM], and (c) [DOM]:[CP] for all samples taken from 1994–2015 across 10 regions. Red lines indicate the smoothing spline for the 1994 to 2004 period and the blue lines indicates the smoothing spline for the 2005 to 2015 period.
Download figure:
Standard image High-resolution imageAs the degree of drought and shifts in the geographic location of samples being analyzed could be driving the observed increases in protein limitation, we first determined residual quality after accounting for the typical seasonal patterns of quality in each of 10 regions for which there were sufficient data to examine interannual trajectories of dietary quality (online supplementary figure S3–S5, table S1). Examining the patterns of PDSI over time, average PDSI of sampled sites was declining or tending to decline for all domains (figure 2(c)). For nine of the ten regions, summer drought increased or tended to increase [CP] (figure 2, table 1). The responses of [DOM] and [DOM]:[CP] to summer drought among regions paralleled those for [CP] (online supplementary figure S6). Those regions for which summer drought increased [CP] the most, summer drought was more likely to increase [DOM] and decrease [DOM]:[CP] (r = 0.86 −0.89 for correlations between coefficients of PDSI responses of [CP] and coefficients of PDSI responses for [DOM], [DOM]:[CP], respectively; P = 0.002, < 0.001 respectively).
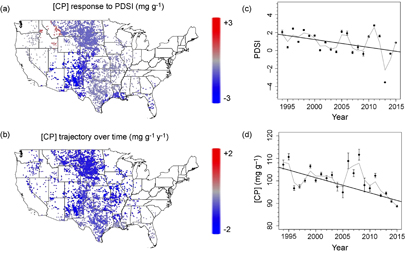
Figure 2 (a) Map of responses of dietary crude protein ([CP]) to Palmer Drought Severity Index (PDSI) in summer, (b) map of trajectories in summer [CP] over time after accounting for variation in PDSI, (c) trajectory in PDSI associated with samples measured in summer, (d) trajectory of summer [CP] after accounting for variation in PDSI. High PDSI represents wetter conditions such that declining [CP] with increasing PDSI implies that drought increases [CP].
Download figure:
Standard image High-resolution imageTable 1. Relationships between PDSI and [CP] for each region in spring, summer, and autumn.
| Spring | Summer | Autumn | ||||
|---|---|---|---|---|---|---|
| Domain | Estimate | P | Estimate | P | Estimate | P |
| Southeast | −0.067 ± 0.054 | 0.234 | −0.096 ± 0.059 | 0.121 | −0.12 ± 0.054 | 0.04 |
| Prairie Peninsula | −0.147 ± 0.045 | 0.004 | −0.234 ± 0.062 | 0.001 | −0.204 ± 0.064 | 0.006 |
| Ozark Complex | −0.1 ± 0.042 | 0.026 | −0.11 ± 0.04 | 0.013 | −0.086 ± 0.045 | 0.071 |
| Northern Plains | −0.061 ± 0.056 | 0.293 | −0.088 ± 0.066 | 0.194 | −0.063 ± 0.059 | 0.295 |
| Central Plains | −0.094 ± 0.067 | 0.177 | −0.16 ± 0.067 | 0.028 | −0.15 ± 0.062 | 0.026 |
| Southern Plains | −0.124 ± 0.058 | 0.047 | −0.114 ± 0.068 | 0.107 | −0.138 ± 0.053 | 0.017 |
| Northern Rocky Mountains | −0.105 ± 0.079 | 0.204 | −0.105 ± 0.079 | 0.201 | −0.112 ± 0.074 | 0.147 |
| Southern Rocky Mountains | −0.152 ± 0.061 | 0.021 | −0.187 ± 0.058 | 0.004 | −0.155 ± 0.052 | 0.008 |
| Desert Southwest | −0.133 ± 0.055 | 0.029 | −0.113 ± 0.05 | 0.041 | −0.094 ± 0.064 | 0.159 |
| Great Basin | −0.053 ± 0.062 | 0.407 | −0.107 ± 0.091 | 0.255 | −0.085 ± 0.065 | 0.202 |
After accounting for the interannual variation in PDSI and drought effects on [CP], [CP] was declining or tending to decline over time in all 10 regions (figure 2(b)) leading to an overall decline in summer [CP] over the 22 yr (figure 2(d)). The greatest declines in [CP] over time were in the Prairie Peninsula (−1.4 ± 0.2 mg g−1 y−1) (figure 2). With the smallest declines, [CP] showed only a trend for declines over time in the Southeast (−0.2 ± 0.3 mg g−1 y−1, P = 0.44). While [CP] has generally been declining over time, [DOM] has been typically increasing (online supplementary figure S7). With the typically increasing trajectory in [DOM] coupled with declining [CP], independent of drought, from 1994–2015, cattle have been becoming more protein limited in summer. [DOM]:[CP] increased in all regions (P ≤ 0.16 for all regions, P < 0.05 for 7 regions) with the Southeast exhibiting the smallest increase (0.018 ± 0.013 y−1; P = 0.16) (figure S7).
In general, patterns in drought response and dietary quality trajectories tended to be similar in spring and autumn as summer. For example, those regions where drought increased [CP] in the summer, also tended to increase [CP] in the autumn (r = 0.51, P = 0.13). After accounting for responses of [CP] to drought, overall, [CP] declined in the spring and autumn from 1994–2015 (online supplementary figure S8). Regions that had the greatest decreases in summer [CP] over time also tended to have the greatest decreases in spring [CP] and autumn [CP] (r = 0.33, P = 0.36; r = 0.52, P = 0.12). Average regional declines in [CP] during the summer (−0.71 mg g−1 y−1) were similar to those in the spring (−0.51 mg g−1 y−1, P = 0.27, n = 10, paired t-test) and were greater than in the autumn (−0.48 mg g−1 y−1, P = 0.005, n = 10, paired t-test), with both spring and autumn trajectories in [CP] typically negative. Only one region showed significant increases in [CP] over time in the spring (Southern Rocky Mountains), and two regions in the autumn (Ozarks and Desert Southwest). [DOM] generally increased over time in the spring and autumn (figure S7, 10), which when paired with declining [CP] during these seasons, led to increases in [DOM]:[CP] (figure S7, 10), signifying greater protein limitation for cattle in spring and autumn as well as summer.
The economic cost of the increasing protein debt was calculated as the amount of soy that would have to be supplemented to cattle in the US to compensate for the declines in protein that have occurred. Over the 270 d spring–autumn period, mean [CP] declined by an average of 10.6 mg g−1 from 1994–2015. In July 2015, there were 86 million cattle not on feed in the US, 27 million of which were calves. Given differences in body size between calves and older cattle while assuming a 2.5% of body weight daily intake rate, the 2015 protein debt relative to 1994 projects to a loss of the equivalent of 5.3 × 10⁹ kg of soybean worth of protein. At US$0.36 kg−1 market price for soy meal, by 2015, the protein debt had increased to a US$1.9 billion annual reduction in protein provision. For reference, this amount is the equivalent of 47% of all soy produced in Iowa in 2015.
Given the long-term declines in [CP], we calculated the consequences of shifts in forage quality between 1994 and 2015 for weight gain of two classes of cattle using the NUTBAL model of cattle performance. Inputs into the model included the modeled nutritional quality of forage in 1994 and 2015. Weather conditions were the same for both simulations and were set to average weather conditions during this period. During the summer, each class of cattle gained less weight in 2015 than 1994, but the temporal pattern and magnitude of reduction in weight gain varied among classes depending on the temporal pattern of their specific nutritional requirements. For a representative cow with calf, the greater protein limitation in 2015 compared to 1994 reduced weight gain over the growing season. In 2015, cows with calves that started at 454 kg at day of year 60 gained 4.9 kg less over the next 270 d than they would have in 1994 given the same environmental conditions with periods in 2015 when weight was actually lost (figure 3). Weight gain reduction was even greater for steers than cows—11.6 kg less weight gain in 2015 than 1994 (figure 3).

Figure 3 Daily gains (kg d−1) of two classes of animals compared between 1994 and 2015. Gains were modeled with the NUTBAL model using the same weather data for each year and only varying nutritional quality based on seasonal patterns of [CP] and [DOM] and the trajectories of nutritional quality over time.
Download figure:
Standard image High-resolution image
Discussion
Although minerals are often supplemented for cattle, nitrogen is infrequently supplemented and thus could be depleted long-term. Given the broad declines in [CP] and increases in [DOM]:[CP], three factors stand out as likely to reduce soil nitrogen availability and consequently protein availability: elevated atmospheric CO2, climatic warming, and sustained nutrient exports associated with animal products export. While CO2 concentrations have risen by 12% from 1994–2015, mean temperatures have increased on average by 0.34 °C ± 0.02 °C (online supplementary figure S9). Also, nutrients have continued to be exported from grasslands in the form of animal biomass generally without replacement. The relative contributions of each to the decline in forage quality are currently unknown, which limits our ability to mitigate future changes, no less reverse the protein decline already experienced in grasslands. For example, elevated CO2 can reduce N availability in grasslands via progressive N limitation, which is a series of feedbacks in the N cycle initiated by enhanced photosynthetic rates (Luo et al 2004). With progressive N limitation, N might accumulate in the ecosystem and plant productivity actually increase due to CO2 fertilization (Luo et al 2006). Yet, with progressive N limitation, even when plant productivity increases, the availability of N relative to photosynthetic potential declines, leading to reduced N concentrations in plants. In contrast, warming reduces N availability long-term by increasing N losses from the ecosystem and reducing ecosystem N stocks (Link et al 2003, An et al 2005). Animal export serves as a loss, too, though it also leads to the export of other elements besides N. As such, warming and N export lead to declines in forage quality by reducing ecosystem N stocks and likely plant productivity.
The declines in [CP] observed here are similar to the declines in foliar N concentrations quantified from herbarium specimens in Kansas over the past 90 yr, where protein was declining at a rate of 0.54 mg protein g−1 y−1 (McLauchlan et al 2010), which is similar to the 0.68 mg protein g−1 y−1 observed across all samples independent of region.
Given the analyses here, the general trends in forage quality over time occur independent of the trends in drought observed over time. The declines in PDSI over time observed here, a pattern consistent with previous analyses (Dai 2012), would likely be reducing the long-term trends in [CP] declines. When drought does occur, it almost universally tended to increase [CP] and [DOM]. Although drought has the potential to reduce plant protein concentrations by increasing resorption of N (Heckathorn and Delucia 1994), other processes must be dominating over this since [CP] is higher during drier times. Drought could be associated with greater [CP] by limiting accumulation of carbohydrates, but [DOM] also increased with drought. This suggests that drought might reduce the production of indigestible fractions such as lignin, which could correspond to reduced culm production that occurs with drought (Craine et al 2010b). Drought might also shift the selection of intake from low-quality to high-quality plant species, but this hypothesis requires more testing. In general, drought increasing forage quality would suggest that weight gain should be higher in drier years assuming sufficient forage availability. Some patterns of weight gain for cattle seem independent of precipitation or even reduced by drought (MacNeil 2012), but reduced precipitation increasing weight gain has been observed for bison (Craine et al 2009).
If the drivers of the reduction of protein in plants cannot be identified and reversed, or adaptation strategies enacted, the protein debt is only likely to grow, which might begin to cause a net decline in cattle production barring further improvements to cattle genetics. The consequences of declining [CP] and increasing [DOM]:[CP] extend beyond greater nutritional stress as they would also promote greater methane production, which could serve as a positive feedback to warming (Johnson and Johnson 1995). Barring wide-spread mitigation of reduction in greenhouse gases, scenarios for adaptation should begin to be examined unless reductions in forage quality are to be tolerated. In response to declining forage quality, managers could also opt to increase the use of N fertilizer for hay production, promote N2-fixing plant species, increase transport of hay and supplemental feeds, and/or increase the seasonal transport of animals from lower protein areas to higher protein areas (Zilverberg et al 2011, Joyce et al 2013). Among the most likely efforts to be attempted, the economic viability and ecological consequences of increasing nitrogen availability on grasslands to counter the growing protein debt will need assessment.
Acknowledgments
The authors would like to acknowledge Sandra Hamel for advice on statistics and Joe Fargione for comments on the manuscript. The forage quality results presented here would not have been possible without the vision and work of the late Jerry Stuth, the initial fecal NIRS calibrations for cattle developed by Robert K Lyons, the contributions of the GAN Lab staff in sample processing and analysis, and livestock producers participating in nutritional monitoring. The work by Angerer was conducted under the USDA National Institute of Food and Agriculture, Hatch/Evans-Allen/McIntire Stennis project 1009337. Data for the paper are archived in Dryad at https//doi.org/10.5061/dryad.n856r.