

Abstract
This study assessed the anthropogenic contribution to the 2015 record-breaking high sea surface temperatures (SSTs) observed in the central equatorial Pacific and tropical Indian Ocean. Considering a close link between extreme warm events in these regions, we conducted a joint attribution analysis using a fraction of attributable risk approach. Probability of occurrence of such extreme anomalies and long-term trends for the two oceanic regions were compared between CMIP5 multi-model simulations with and without anthropogenic forcing. Results show that the excessive warming in both regions is well beyond the range of natural variability and robustly attributable to human activities due to greenhouse gas increase. We further explored associated mechanisms including the Bjerknes feedback and background anthropogenic warming. It is concluded that background warming was the main contribution to the 2015 extreme SST event over the central equatorial Pacific Ocean on a developing El Niño condition, which in turn induced the extreme SST event over the tropical Indian Ocean through the atmospheric bridge effect.
Export citation and abstract BibTeX RIS

Original content from this work may be used under the terms of the Creative Commons Attribution 3.0 licence.
Any further distribution of this work must maintain attribution to the author(s) and the title of the work, journal citation and DOI.
1. Introduction
Sea surface temperature (SST) variability in the central equatorial Pacific Ocean is important due to its distinct role in modulating El Niño–Southern Oscillation (ENSO) atmospheric teleconnection patterns to the mid-latitudes from the tropics (Barsugli and Sardeshmukh 2002, Ding et al 2014, Ciasto et al 2015) and its association with ENSO diversity (Yeh et al 2009, Capotondi et al 2015). In particular, central Pacific SST is directly related to ENSO development (Burgers and van Oldenborgh 2003) and has a critical impact on remote regions because of its stronger atmospheric sensitivity compared to other tropical oceans (Barsugli and Sardeshmukh 2002, Kug et al 2009). In addition, the central equatorial Pacific is closely related with the North Pacific Gyre Oscillation and its temperature changes can affect the North Pacific and middle latitudes (Di Loerenzo et al 2010).
SST warming in the tropical Indian Ocean, which usually occurs as a response to El Niño on a seasonal time scale (Klein et al 1999), is also important due to its significant impact on the Asian summer monsoon, prolonging the ENSO influence into the following summer when anomalies have dissipated over the central equatorial Pacific (Yang et al 2007, Xie et al 2009). In addition, the long-term increase in the tropical Indian Ocean SST affects the Northern Hemisphere winter-time extra-tropical climate, particularly over North America and Europe (Hoerling et al 2004). Furthermore, the tropical Pacific and Indian Ocean are connected through what is known as an atmospheric bridge (Klein et al 1999, Xie et al 2009, Luo et al 2012) and the combined SST influence of the two basins on the mid-latitude atmospheric circulation and precipitation has been identified (He and Zhou 2015, Ueda et al 2015, Weller et al 2016a). Therefore, joint attribution of two regional SST extremes is important to better predict their teleconnection impacts on the extratropics as the climate impacts are strengthened when they co-occur (Meyers et al 2007).
During 2015, global mean SST was the highest since observational records started, with record-breaking events of regional and seasonal extremes (figure 1). In particular, annual and boreal autumn mean SST over the central equatorial Pacific Ocean and the tropical Indian Ocean were the highest on record since 1900 with positive anomalies greater than 1 °C in the former and 0.7 °C in the latter, relative to the 1971−2000 climatology. Anthropogenic greenhouse gas increase was found to be the major cause of global ocean and basin-wide warming (Gleckler et al 2012, Weller et al 2016b). However, there have been limited studies examining whether, and how much, anthropogenic forcing has contributed to the extreme warmth in these two tropical oceanic regions.
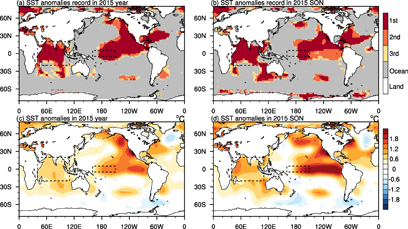
Figure 1 Record of 2015 (a) annual and (b) boreal autumn (SON) SST mean anomalies. Red indicates regions where 2015 was the highest on record since 1900, and orange and yellow colors represent the second and third highest records, respectively. Observed SST (c) annual and (d) SON mean anomalies during 2015, relative to the 1971–2000 mean. Dashed boxes indicate the Indian Ocean (BMI) and the central equatorial Pacific (Niño4) regions analyzed in this study.
Download figure:
Standard image High-resolution imageIn this study, we assessed the relative contributions of anthropogenic and natural factors to the 2015 record-breaking high SSTs over the central equatorial Pacific and tropical Indian Ocean. The probabilities of occurrence of the observed extreme SST event were evaluated using multi-model simulations performed with and without anthropogenic forcings by employing a joint attribution approach. In addition, we examined the dynamic mechanisms associated with extremely high SST anomalies in the equatorial central Pacific and Indian Ocean during 2015.
2. Data and methods
We investigated SST changes averaged in the equatorial central Pacific region (160°E–150°W, 5°S–5°N, consistent with the Niño4 region) and the Indian Ocean Basin (40°E-110°E, 20°S-20°N, defined as Basin Mode Index, BMI) using the Extended Reconstruction Sea Surface Temperature (ERSSTv4) dataset (Huang et al 2015). We used multi-model datasets available from the Coupled Model Intercomparison Project Phase 5 (CMIP5; Taylor et al 2012) to assess the contribution of anthropogenic influence to the extremely high SST events (listed in table S1 available at stacks.iop.org/ERL/12/044024/mmedia). First, we combined 'historical' simulations integrated with anthropogenic plus natural forcings (1953–2005) with Representative Concentration Pathway 4.5 (RCP4.5) scenario simulations (2006–2015), producing a 63 yr long time series for a real world condition including human influence (referred to as ALL_P1). We utilized 1860−1922 results from the 'historical' simulations, which represent a counterfactual condition with negligible anthropogenic influence (ALL_P0). 63 yr samples of pre-industrial control simulations (referred to as CTL) from 30 CMIP5 models are analyzed to further check possible influences of natural variability (see below for details). We also used 'historicalGHG' runs integrated with greenhouse gas forcing only (GHG_P1) and 'historicalNAT' runs integrated with natural forcing only (NAT_P1) to examine contributions of these individual forcing factors. Note that these experiments were used for 1953−2012 since they end in 2012 (table S1). To consider a climate response relative to the current climate, anomalies were calculated relative to the 1971−2000 mean of ALL_P1 for all model runs. More details of CMIP5 experiments used in this study are described in table S2.
We applied a fraction of attributable risk (FAR) approach to quantify anthropogenic influence on the probability of extreme events (SST anomalies or linear trends in this study). Basically, model-simulated probabilities of extreme events were compared between conditions with and without human influences. The FAR value is calculated as FAR = 1 − (PN/PA) following previous researches (Stott et al 2004), where PN is the probability of occurrence of extreme events exceeding the observed value in a counterfactual world without human influence (ALL_P0 or NAT_P1) and PA is the probability of extremes in a real world condition with human influence (ALL_P1 or GHG_P1). Positive FAR values represent an increase in risk of extreme events due to human influences, e.g. doubled risk when FAR = 0.5 and a five-fold increase in risk when FAR = 0.8. Here, the probability (P) is estimated empirically by counting the number of simulated events (SST anomalies or trends) exceeding the observed and calculating its percentage fraction of the total number of simulated events. Applying Gaussian distribution fitting and estimating probability based on the fitted distribution gives generally similar results, but we employ the empirical estimation which requires no distribution assumption.
The Bjerkness feedback is a basic mechanism explaining ocean-atmosphere interaction over the equatorial Pacific (Bjerknes 1969). Weakened easterly trade winds induce warmer water transport from the western Pacific to the east, increasing deep convection over the central Pacific. The enhanced convection in turn weakens the Walker circulation, amplifying the initial perturbation (weakened easterly trade wind). In order to examine possible impacts of the Bjerknes feedback on the extreme Niño4 warming, focusing on the role of higher SST and anomalously westerly winds to the west, we utilized a simplified index for the Bjerknes feedback intensity, which is defined as a multiplication of the SST anomalies averaged over the central equatorial Pacific (i.e. Niño4 index) and the wind stress anomalies over the western border of the Niño4 region (averaged over 140°E–180°E, 5°S–5°N), representing the coupling strength between the oceanic forcing and the atmospheric response in Niño4 region (cf. Yeh et al 2014). We used zonal and vertical winds from Japanese 55 yr reanalysis (JRA-55, Ebita et al 2011) and Global Ocean Data Assimilation System (GODAS) potential temperature (Behringer et al 1998) to examine physical mechanisms associated with the extreme SST event in 2015.
3. Results
Figure 1(a) displays the 2015 spatial distribution of the highest SSTs recorded since 1900. A record high annual SST occurred over 19.3% of the global ocean, 60.6% of the Indian Ocean (BMI domain), and 71.5% of the central equatorial Pacific Ocean (Niño4 domain). Boreal autumn (September to November, SON) strongly contributes to the annual mean SST record (online supplementary figure S1) with a similar distribution of the highest SST observed (figure 1(b)). The amplitude of SST anomalies is stronger in Niño4, which gets stronger in SON due to the development of 2015/16 El Niño event to the east (figure 1(c) and (d)). Another region where the highest SST is observed is the eastern North Pacific, which is suggested to be due to the combined effect of anthropogenic warming and natural variability such as the positive phase of Pacific Decadal Oscillation (PDO) shown in online supplementary figure S2 (Weller et al 2015, Di Lorenzo and Mantua 2016).
Long term time series of annual and SON mean Niño4 and BMI are compared between observations and model simulations for 1953–2015 (figure 2). The annual mean results from observations clearly show that SST has been increasing with large inter-annual variability. Niño4 time series are also characterized by larger year-to-year variability than BMI time series. Yet, the BMI displays a stronger long-term warming trend since the 1950s (table 1), consistent with previous studies (Rao et al 2012, Roxy et al 2014, Weller et al 2016a). Model results show that ALL_P1 and GHG_P1 simulations have increasing trends in both regions whereas on average, NAT_P1 and ALL_P0 runs have very weak or almost no trends. In particular, ALL_P1 runs reproduce the observed changes reasonably well with similar magnitudes of trends and inter-annual fluctuations for both Niño4 and BMI. GHG_P1 shows stronger warming trends than ALL_P1, due to the omission of aerosol cooling effects. NAT_P1 and ALL_P0 runs display some significant short-term cooling, responding to large volcanic eruptions such as Krakatau (1883), Agung (1961), El Chichon (1982) and Pinatubo (1991) (Gao et al 2008). Results for SON resemble the annual results with one exception: Niño4 has stronger inter-annual variability, which is captured by the models.
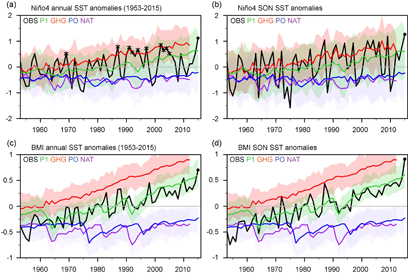
Figure 2 Time series of Niño4 (upper) and BMI (lower) annual and boreal autumn (SON) mean SST anomalies during 1953–2015 (1860–1922 for ALL_P0). Black solid lines represent observations (OBS), and colored solid lines indicate multi-model means of ALL_P1 (green), ALL_P0 (blue), NAT_P1 (purple), and GHG_P1 (red). Shadings indicate 10%–90% inter-model ranges for each experiment. Asterisks in (a) indicate the 10 warmest years in Niño4 with an El Niño event (2002, 1987, 1991, 2004, 1997, 1994, 2003, 1992, 2005, and 1969) except 2015 (black point).
Download figure:
Standard image High-resolution imageWe compare observed and simulated SST trends and anomalies to assess human contributions to the observed warming over the two regions. Linear trends are computed based on linear least squares for each time series. Figure 3(a) shows the annual mean results for SST trends, in which frequency distributions of occurrence of long-term SST trends are displayed for Niño4 (upper histogram) and BMI (right histogram) individually and combined (contours represent joint probability). As mentioned above, the probability exceeding the observed value is computed empirically by counting the model simulated events using histograms. For annual Niño4, the probability (P) of occurrence of trends stronger than the observed trend (0.63 °C per 63 yr) is 81.0% in ALL_P1 and 100% in GHG_P1 while it is very low in ALL_P0 (0.9%) and NAT_P1 (0%). Similar results are seen for SON (figure 3(b)) with some changes in probabilities due to a stronger trend than the annual case (table 1). For instance, P = 49.2% for SON Niño4 in ALL_P1 as its probability distribution is located closer to the observed trend (figure 3(b)). Resulting FAR values of the annual and SON Niño4 SST trend are close to or equal one, indicating that anthropogenic influence has played a dominant role in the increased risk of long-term Niño4 SST warming with a negligible influence of natural factors (table 1). For BMI, the probability of occurrence of warming trends higher than the observed (0.90 °C per 63 yr) is 33.3% in ALL_P1 and 100% in GHG_P1 with 0% in ALL_P0 and NAT_P1, resulting in FAR = 1 in all cases (table 1). In this region, SON results are similar to the annual results.
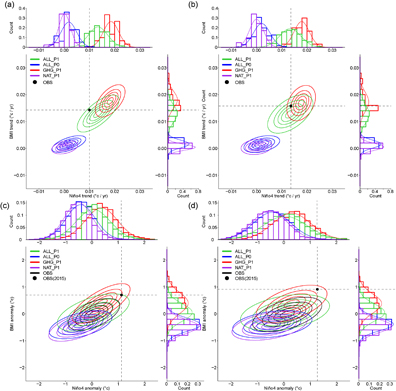
Figure 3 Joint probability distributions of the annual and SON SST trends (upper) and anomalies (lower) in the central equatorial Pacific (x-axis) and Indian Ocean (y-axis) from ALL_P1 (green), ALL_P0 (blue), GHG_P1 (red) and NAT_P1 (purple) experiments with the observed values (ERSST v4, black point). Ellipses represent normalized joint probability from 10% to 90% in 20% interval. Normalized histograms attached to each panel indicate probability distributions obtained from the individual region: the central equatorial Pacific Ocean (top) and the Indian Ocean (right).
Download figure:
Standard image High-resolution imageOverall, in both regions, chances of exceeding the observed SST trends are high only when including human influences (ALL_P1 and GHG_P1), providing evidence for anthropogenic influence in a long-term increasing SST trend. In order to consider regional warming in both areas simultaneously, we examine the joint probability distributions of SST trends between Niño4 and BMI. The joint probability is computed by counting the number of simulated events where both Niño4 and BMI exceed the observed value simultaneously and obtaining the percentage fraction of the total number of simulated events. Our results confirm that larger trends in both regions occurred only in experiments including anthropogenic greenhouse gas forcings. In this context, since we require excessive warming in the two regions at the same time, the probability of extreme trends exceeding those observed is reduced (32.5% for annual and 16.7% for SON in ALL_P1, 0% for ALL_P0), which makes joint exceedance 100% attributable to anthropogenic forcing (table 1).
Distributions of simulated SST anomalies are compared with the observed 2015 anomaly value in the Niño4 and BMI in a similar way (figure 3(c) and (d)). Consistent with trend comparisons, the probability of extreme SST events increases when models include greenhouse gas forcing. Niño4 SST anomalies exceeding the observed 2015 anomaly (+1.12 °C) occur very rarely in NAT_P1 (P = 0.5%) and ALL_P0 (P = 0.7%). This probability increases to 4.9% and 9.6% in ALL_P1 and GHG_P1, respectively (table 1). FAR values for the Niño4 SST anomaly with respect to ALL_P0 are 0.86 and 0.93, respectively, which means that there is about a 7- and 14-fold increase in risk for 2015 like extreme SSTs due to anthropogenic forcing. FAR values of extreme anomalies in SON are very similar to the annual results.
For the BMI, there is no occurrence exceeding the extreme 2015 annual (0.70 °C) and SON (0.91 °C) SST anomalies in ALL_P0 and NAT_P1. However, the probability increases to 3.0% and 22.8% in ALL_P1 and GHG_P1, respectively. The simulated FAR reveals that the 2015 extreme SST anomaly in the tropical Indian Ocean is entirely attributable to anthropogenic forcing. In SON, although extreme SST anomalies occur only when including anthropogenic forcings, the probability is very low (0.6% in ALL_P1) compared to the annual values. When considering extreme SST anomalies in both regions simultaneously, again the probability of occurrence becomes much lower than individual cases (1.1 % in ALL_P1 and 7.7% in GHG_P1). Although SST variability is large, particularly in Niño4, there is a weak positive correlation of SST anomalies between Niño4 and BMI, which seems to get stronger with warming as in the case of the SST trend. The strengthening of the link between the two oceanic regions under global warming warrants further investigation. Only models including anthropogenic forcings simulated a long-term change and extreme events like the 2015 high SST over the tropical Indian Ocean and the Pacific. Therefore, we conclude that human-induced increases in greenhouse gases have contributed to the equatorial oceanic warming in the two regions.
There might be influence of strong multidecadal variability such as PDO, which superimposes the forced response in SST over the two regions. In this respect, we have further analyzed trends from the pre-industrial control simulations (CTL) of available CMIP5 models. Overall, we obtained 294 non-overlapping 63 yr chunks from 30 models (number of chunks for each model shown in online supplementary table S1). When comparing SST trends from CTL samples with the observed one (figure 4), multi-model mean trends are close to zero for the two oceanic regions, with relatively large inter-model spread in the central equatorial Pacific. Some CTL samples indicate warming trends in both oceanic regions but amplitudes are much lower than the observed trends. This result clearly indicates that the recent observed SST increases in the two ocean basins cannot be explained by natural variability alone such as PDO. Also probability exceeding the observed anomalies and trends calculated from CTL (included in table 1) are found to be very similar to NAT_P1 and ALL_P0, supporting that anthropogenic forcing (mainly greenhouse gas increases) has very likely contributed to the observed changes.

Figure 4 Annual and SON mean SST trends during 63 yr in Niño4 and BMI regions obtained from CMIP5 pre-industrial control simulations (294 63 yr non-overlapping chunks, see table S1). Grey point represents multi-model means and grey error bars indicate 5%–95% ranges. Black point depicts the observed trends for 1953–2015.
Download figure:
Standard image High-resolution imageTable 1. Probability of occurrence of annual and SON mean SST trends and SST anomalies in Niño4, BMI, and both together exceeding the observed trend (1953–2015) and anomaly (2015), from ALL_P0, ALL_P1, GHG_P1, NAT_P1, and CTL simulations. FAR values for ALL_P1 and GHG_P1 are against the probability in ALL_P0. Note that the first values represent annual results and the second values indicate SON results.
| Observations | ALL_P0 | ALL_P1 | GHG_P1 | NAT_P1 | CTL | |
|---|---|---|---|---|---|---|
| SST trend of Niño4 | 0.63/0.85 | 0.9/0% | 81.0/49.2% | 100/93.3% | 0/0% | 0.3/0% |
| Annual/SON | (°C 63 yr−1) | FAR = 0.99/1 | FAR = 1/1 | |||
| SST trend of BMI | 0.90/1.00 | 0/0% | 33.3/19.0% | 100/46.7% | 0/0% | 0/0% |
| Annual/SON | (°C 63 yr−1) | FAR = 1/1 | FAR = 1/1 | |||
| SST anomaly of Niño4 | 1.12/1.27 °C | 0.7/1.5% | 4.9/6.2% | 9.6/8.9% | 0.5/0.6% | 0.4/0.6% |
| Annual/SON | FAR = 0.86/0.76 | FAR = 0.93/0.83 | ||||
| SST anomaly of BMI | 0.70/0.91 °C | 0/0% | 3.0/0.6% | 22.8/8.6% | 0/0% | 0/0% |
| Annual/SON | FAR = 1/1 | FAR = 1/1 | ||||
| SST trend in Niño4 and BMI | 0/0% | 32.5/16.7% | 100/46.7% | 0/0% | 0/0% | |
| Annual/SON | FAR = 1/1 | FAR = 1/1 | ||||
| SST anomaly in Niño4 and BMI | 0/0% | 1.1/0.3% | 7.7/2.9% | 0/0% | 0/0% | |
| Annual/SON | FAR = 1/1 | FAR = 1/1 |
In order to check possible impacts of model skills in terms of SST variability, we repeated our analyses using selected models (marked in blue in table S1) which have amplitudes of Niño3 and Niño4 comparable to the observations (±25% of observed standard deviations, Bellenger et al 2014). Results reveal patterns of the joint probability distributions similar to the full model case (online supplementary figure S3). Corresponding FAR values are also found similar (online supplementary table S3), indicating the insensitivity of our results to model biases in SST variability.
In addition to human influence, on the other hand, it is useful to examine dynamic mechanisms associated with the extremely high SST anomalies during 2015. Here we investigate the evolution of atmospheric circulation and ocean thermocline depth (figure 5). There are continuous positive SST anomalies over the Niño4 area since the 2014 boreal spring (figure 5(a)). This becomes stronger from early 2015 and is accompanied by enhanced local convection activity (figure 5(b)). The anomalous upward motion in Niño4 from early 2015 acts to weaken the Walker circulation, generating anomalous westerly winds in the lower troposphere to the west (figure 5(c)) and anomalous easterly winds in the upper troposphere (figure 5(d)). On the other hand, the warming of the tropical Indian Ocean cannot be explained by similar dynamical process directly. The anomalous westerly winds in the lower troposphere over the western tropical Indian Ocean are dominant since boreal spring 2014 (figure 5(c)), which mainly contributes to the higher SST over the Indian Ocean (figure 5(a)). In particular, the enhanced convection in Niño4 from early 2015 leads to the descending motion in the western equatorial Pacific during July-September (figure 5(b)). This associates the anomalous easterlies in the lower troposphere over the eastern Indian Ocean along with the enhanced convection (figure 5(b) and (c)), which relate to a large warming in the western Indian Ocean in SON (figure 5(a)). This is also consistent with the anomalous westerly winds in the upper troposphere over the Indian Ocean basin in July-September 2015 (figure 5(d)). In particular, the atmospheric response is characteristic of that associated with a positive Indian Ocean Dipole (IOD) event developing with an El Niño (Fischer et al 2005), indicating that the tropical Indian Ocean warming is strongly coupled with the warming in the Niño4 via a thermally direct response of the tropical atmosphere to diabatic heating anomalies over the tropics during an El Niño (Schott et al 2009). A simple check of the lead-lag correlation of Niño4 SST with the boreal autumn SST in BMI region (and also an IOD index) further supports the link between the two basins, with a maximum correlation when Niño4 SST leads by one month (online supplementary figure S4).
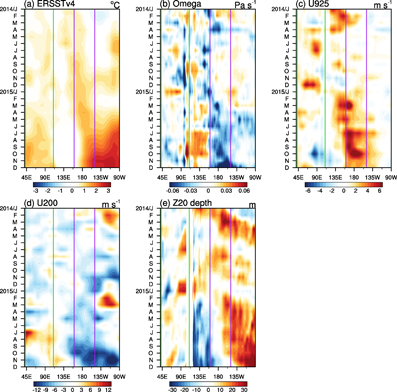
Figure 5 Hovmöller diagrams of the equatorial averaged (5°S–5°N) anomalies in (a) SST, (b) 500 hPa vertical velocity (ω), (c) 925 hPa zonal wind, (d) 200 hPa zonal wind, and (e) 20 °C isotherm representing the thermocline depth, from the Indian Ocean to the Pacific Ocean. Purple and green vertical lines indicate the central equatorial Pacific (160°E–150°W) and the tropical Indian Ocean (40°E–110°E), respectively.
Download figure:
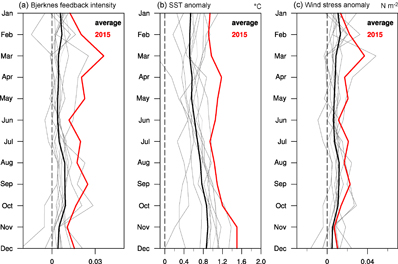
Standard image High-resolution imageOn the other hand, anomalous westerly winds over the western Pacific weaken upwelling, depressing the thermocline in the central and eastern Pacific (figure 5(e)), which develops high SSTs and in turn reinforces the wind anomalies (McPhaden 1999). Such a Bjerknes feedback would be expected to amplify the Niño4 warming anomalies. Therefore, it is valuable to examine how strongly this feedback contributed to the 2015 extreme event. Figure 6 shows monthly changes in the simplified index of Bjerknes feedback intensity (see section 2 for definition), SST anomaly and wind stress anomaly from the 10 warmest years (2002, 1987, 1991, 2004, 1997, 1994, 2003, 1992, 2005, and 1969, as indicated by asterisks in figure 2(a)) in the Niño4 region with an El Niño event compared with the 2015 event. These selected years are consistent with classical eastern Pacific El Niño and central Pacific El Niño years as classified in Yu and Zou (2013). The Bjerknes feedback intensity during 2015 tends to be stronger than in other years, with the exception of a few months when some individual years are briefly characterized by a stronger feedback intensity. Wind stress in 2015 is generally stronger than the mean of other warm years but there are other years with stronger wind stress anomalies than 2015 later in the year. In contrast, SST anomalies in 2015 are warmer than all other years for the entire year (from March to December). It seems that background greenhouse warming contributed to the extreme Niño4 SST anomaly in 2015, which was strengthened via the positive Bjerknes feedback. This is supported by simulations under a future warming world, where the role of anomalous zonal advection of warm water, which is the major process that pushes El Niño to extremes, increases the frequency of future extremes of El Niño (Kim et al 2015). In 2015, the extremely high SSTs in the Niño4 region were transported by the stronger than normal winds to the east, aiding the growth of the El Niño development during the summer.
Figure 6 Monthly time series of (a) Bjerknes feedback intensity, (b) SST anomalies, and (c) wind stress anomalies from year 2015 (red) and another 10 of the warmest years (2002, 1987, 1991, 2004, 1997, 1994, 2003, 1992, 2005, 1969) in the Niño4 region with an El Niño event (see figure 2(a)). Black line indicates the average of the 10 yr and grey lines represent individual years.
Download figure:
Standard image High-resolution image
4. Conclusion and discussion
This study carried out an event attribution analysis of the long-term SST trend and 2015 record high SST anomalies in the central equatorial Pacific (Niño4) and the tropical Indian Ocean (BMI) using CMIP5 multi-model simulations with and without anthropogenic influences. Long-term warming trends during 1953−2015 in both regions can be reproduced by models only when including greenhouse gas forcing. The use of the fraction of attributable risk (FAR) approach confirms that the extreme 2015 SST anomalies in these regions are largely attributable to anthropogenic forcing. We conclude that the risk of extreme SST trends and anomalies has increased by at least about 7 fold, respectively, due to human influences.
On the other hand, the positive Bjerknes feedback is found to help reinforce 2015 warm conditions in the Niño4 region, which induces the warming in the tropical Indian Ocean through the atmospheric bridge effect. Furthermore, there is combined influence with a positive IOD occurring with a developing El Niño event, supporting that these regions are indeed closely connected (Fischer et al 2005). Ultimately, subsequent climate impacts could be combined and intensified (Meyers et al 2007). Hence, it is important to assess the human influence on such co-occurrences. This process involves warm water with an increased convection, a weakened Walker circulation resulting in anomalous low-level westerly winds to the west, and presumably increasing the warm water transport to the Niño4 region. However, compared to previous warm years, long-term anthropogenic background warming may have contributed more to the 2015 extreme warming. We conclude that strong positive SST anomalies remained throughout 2015 due to the long-term background warming and were amplified via positive Bjerknes feedback.
Finally, it is noteworthy that extreme SST anomalies over the central Pacific might be associated with a positive phase of PDO since 2014 (figure S2, Weller et al 2015). The spatial distribution of 2015 SST anomalies (figure 1) is similar to that of a positive phase of the PDO in the Pacific basin (figure S2). In particular, the warming in the northeast Pacific Ocean was quite significant in 2015 (figure 1), which indicates that a Wind-Evaporation-SST feedback process was quite significant in 2015 (Xie and Philander 1994, Chiang and Vimont 2004). That is, a weakening of trade winds, which is related to the positive phase of PDO, acted to limit the reduction of latent heat release into the atmosphere, leading to the warming in the northeast Pacific Ocean as well as the central equatorial Pacific. Thus, the recent PDO might be in part associated with the 2015 strongest warming over the central equatorial Pacific. Further investigation is required in order to quantify forced and unforced impacts on extreme tropical warming in a more comprehensive way.
Acknowledgments
This work was funded by the Korea Meteorological Administration Research and Development Program under Grant KMIPA 2016–6040. We acknowledge the World Climate Research Programme's Working Group on Coupled Modelling, which is responsible for CMIP, and we thank the climate modeling groups (listed in table S1 of this paper) for producing and making available their model output. For CMIP the U.S. Department of Energy's Program for Climate Model Diagnosis and Intercomparison provides coordinating support and led development of software infrastructure in partnership with the Global Organization for Earth System Science Portals.