

Abstract
Although water is rarely traded over long distances by itself, the total weight of the water consumed to produce traded commodities exceeds the weight of any other commodity traded in the world. This concept is known as virtual water trade. Although space-/time-/commodity-based quantification has been conducted extensively, the underlying causes of this peculiar feature have thus far received little exploration. Here, we use estimates of water consumption from a global hydrological model and statistical data related to food trade to elucidate three facts that explain the fundamental nature of virtual water trade with respect to alleviating water scarcity. First, we quantitatively illustrate the unique position of water among commodities based on its unit price and quantity of sales. Water has an extremely low unit price, and a tremendous volume of water is consumed per person each day. Second, we show that rich but water-scarce countries tend to reduce local water consumption by importing virtual water. Third, we demonstrate that nations characterized by net virtual water exports have higher water resources and income per capita and that no countries fall below a certain threshold with respect to both GDP and water resources. These points suggest that the virtual water trade is explained by economic characteristics of water and that sustainable development depends on promoting the co-development of poverty alleviation and water resource development.
Export citation and abstract BibTeX RIS

Original content from this work may be used under the terms of the Creative Commons Attribution 3.0 licence.
Any further distribution of this work must maintain attribution to the author(s) and the title of the work, journal citation and DOI.
Corrections were made to this article on 22 May 2017. Supplementary data was added.
1. Introduction
Because of the uneven geographical distribution of natural resources, the demand for water and crude oil cannot always be met by the local supply. While crude oil is often directly transported to fill the gap, using barges, tankers, pipelines, trucks, and trains, water is not usually transported directly over long distances. Although there are some cases of direct water exports [1, 2], neither a global market nor a standard global price exists for water. Instead, the international trade in water-intensive commodities between water-abundant and water-poor countries can help water-poor countries save resources; this process is known as the 'virtual water trade' [3]. The total volume of the international virtual water trade is estimated to be between 1100 and 2300 km3 yr−1 [4−6]. It is generally thought that the trade of 'real water' between water-rich and water-poor regions is impossible due to the large distances and associated costs [7]. However, few studies have shown objective or quantitative evidence for this assertion. Although the product value density explains transport options in the field of logistics management [8], no study has addressed water as a transport object to discuss economic efficiency. In terms of virtual water flow, the global figures through international trade have been discussed based on the volume of water resources in each country or region [9] and efficiency global water use [10] in recent years. Although the importance of economic potential has been noted [4], a limited number of studies have assessed virtual water trade, including net exporting countries, from an economic perspectives. In this contribution, we quantitatively illustrate the characteristics of water as a resource that is rarely transported based on the economic characteristics by comparing the unit price and the annual quantities of water versus other commodities using international statistics. We also show the current condition of each country based on the economic potential, water resources, and virtual water flows related to agricultural products consistently estimated by a physical hydrological model.
2. Why water is rarely transported directly
Although the nexus of water, energy, and food/feed/fibre has been discussed [11], we note a tremendous difference in weight between the various components (table S1 available at stacks.iop.org/ERL/12/044002/mmedia). Humans are supplied with 82 g of fat and 81 g of protein per capita per day [12], and 2.0 litres of petroleum per person per day (or a total energy consumption of 3.4 kg of oil equivalent, including oil, coal, natural gas, nuclear, hydro, biofuels and waste, and other fuel types) was consumed daily in 2010 [13]. Interestingly, a similar amount of water is required for human survival. Fluid intake requirements are 1.5 to 3.0 litres per person per day [14]. However, between 50 and 100 litres of water per person per day are required to ensure basic human health (i.e. water for sanitation; [15]). In addition, 3 to 4 m3 per person per day of rain-originated water is consumed in the cropland to produce food for humans; this is referred to as 'green water' [6, 16]. When agricultural demand is not met by green water, irrigation can fill the gap between green water supply and demand, withdrawing from water sources such as rivers or groundwater. Global total freshwater withdrawal for household, industrial, and irrigation use is estimated to be 1 to 2 m3 per person per day [17]. However, in contrast to the oil or crop trade, physical water scarcity is rarely alleviated through international or inter-basin trades.
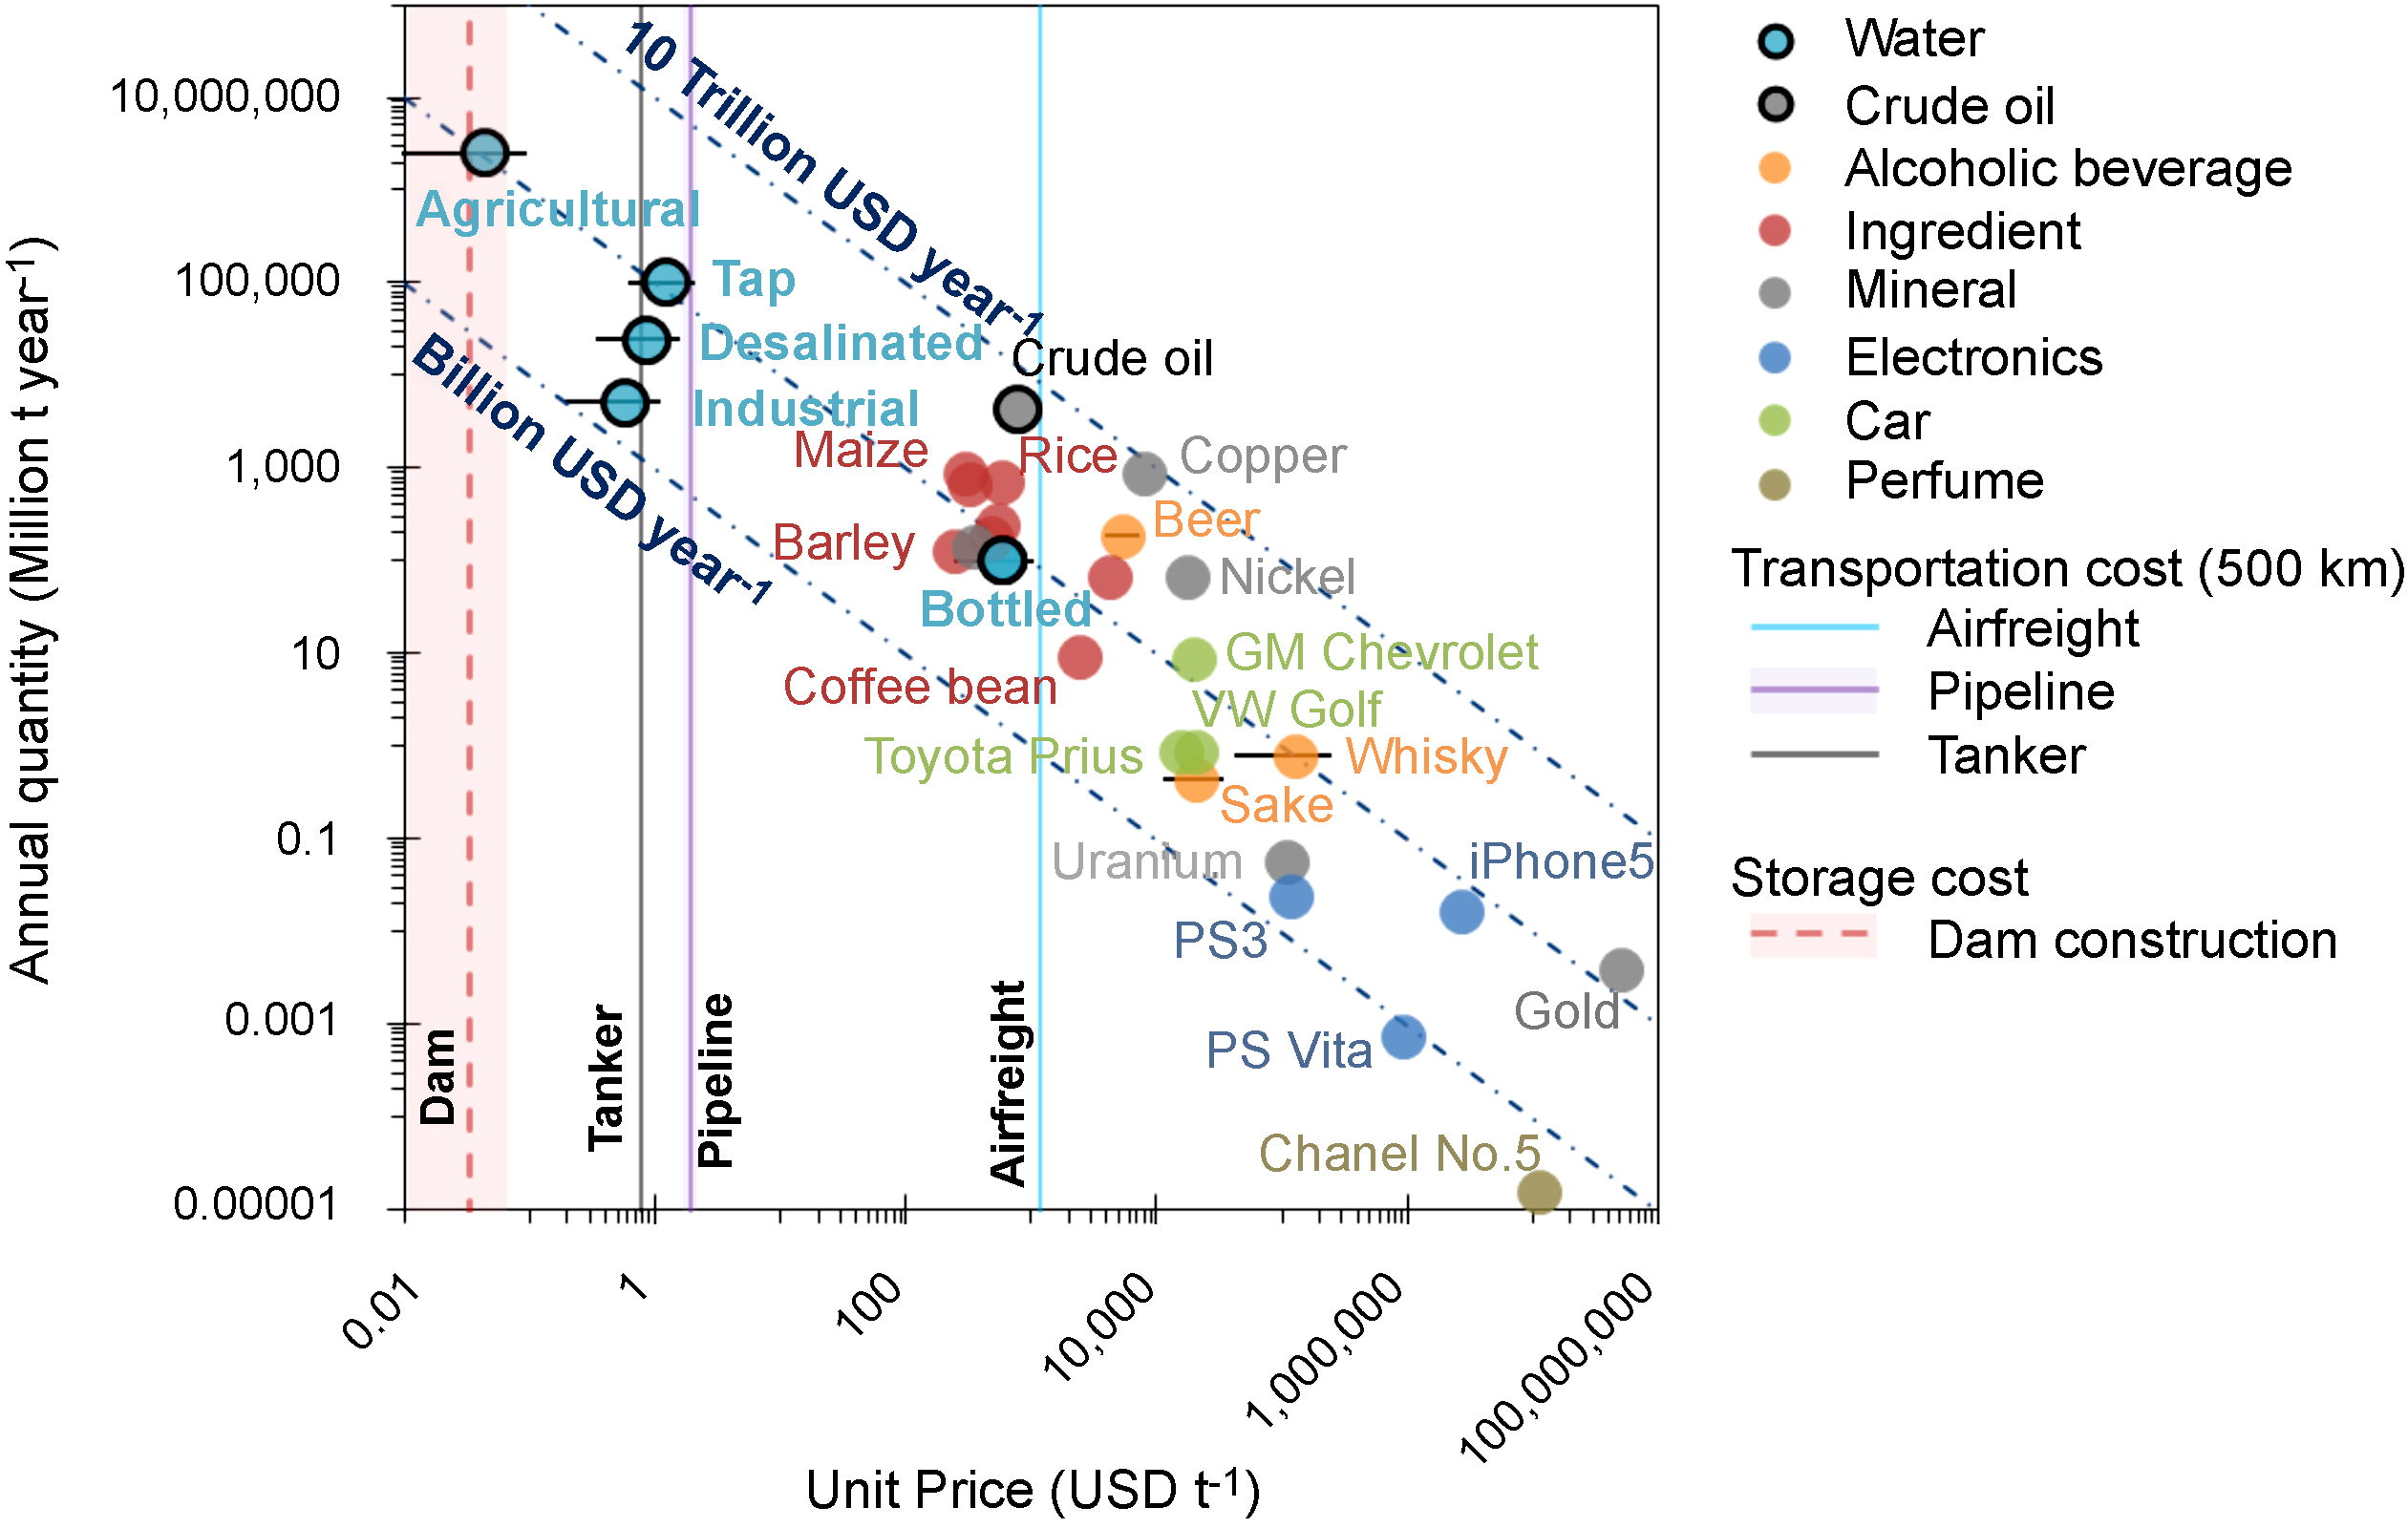
We investigated the characteristics of water as a resource by collecting statistical data related to its unit?price and annual quantity. Figure 1 compares the unit prices of various commodities, including the costs?of water storage capacity and transportation over?500 km (plotted on the x-axis in figure 1), to the annual quantities produced (on the y-axis in figure 1). The detailed method and data for estimating unit prices and annual quantities are shown in the supplementary data. Reports and statistics published by international organizations were investigated. When an exact number was not found, the websites of manufacturers and distributors were referenced. The data on price and transportation cost are averaged over values from several countries in various years (1995–2014). The dam construction cost was adjusted for inflation and direct exchange rates into constant 2013 USD using consumer price indices. In general, commodities that are consumed in large amounts (such as water) are much less expensive by weight than those consumed in smaller amounts (e.g. food and electronic appliances). While the prices of agricultural, industrial, desalinated, and tap water are 0.04, 0.6, 0.9, and 1.2 USD t−1, respectively, the annual average price of crude oil was 778 USD t−1 (105 USD bbl−1) in 2012. In the category of water, only bottled water, which is priced between 300 and 1000 USD t−1, comes close to the price of crude oil. If water is transported by tankers or pipelines, it costs between 0.76–1.89 USD t−1 per 500?km. While tap water keeps its low price based on distribution via pipe networks and initial investments, the price of bottled water includes transportation cost by trucks and ships. Capital and energy costs for transportation, lifting, and storage tend to be high relative to economic value at the point of use [18]. Water's low price per weight and the cost of transportation mean that it is rarely transported by itself over long distances more than 500 km (with the exception of bottled water). Because of the difficulty of direct transportation, water is an absolutely local resource without a single international price. Storing water can mitigate temporal variability in water resources and increase water availability. The construction cost of large dams to create reservoirs averages 0.034 USD per metric ton of stored water (table S4). However, whether reservoir construction as an appropriate way to ensure water security is controversial based on the opposing viewpoints of 'grey' infrastructure or 'green' ecosystem-based approaches [19, 20]. A commodity's price depends on the supply chain cost, which mainly consists of manufacturing, transport, facility, and inventory costs; the value of a commodity varies through the supply chain [8]. Water accounts for only a small part of the value density but is not entirely zero, water is comparable to other commodities in unit price and annual quantity.

Figure 1 Unit prices and annual quantities of commodities; costs associated with storage and transportation of water are indicated with minimum and maximum values by the extended bar. Market sizes are shown by diagonal lines. Among various types of water, only bottled water has a price similar to crude oil; agricultural, industrial, desalinated, and tap water are much less expensive. Detailed data are shown in tables S2 to S5.
Download figure:
Standard image High-resolution image3. Who benefits from the virtual water trade?
In place of direct transportation of water, agricultural products that require abundant water are traded internationally [5, 7, 16]. Their prices are sufficiently high compared to transportation costs to make this trade feasible (figure 1). Virtual water import can alleviate national water stress [21]. We investigated the ability of international trade in agricultural products to alleviate physical water stress in each country by global water resource modelling, an index of water stress based on available water resources, and a trade matrix.
Figure 2 shows water stress conditions in 142 countries and the effects of virtual water imports on agricultural products in 2012. The assessment adopted a global water resources model [22] to estimate water consumption for producing agricultural crops and livestock in each country. Virtual water trades were calculated by multiplying the unit water consumption of agricultural products by the annual volume of crops and livestock imported based on a trade matrix [12]. Imported virtual water was considered as additional water resources in water stress categories [23]. Based on available water resources per capita, each country was assigned to one of the following categories: catastrophically low (<1000 m3capita year−1); very low (1000–2000 m3 capita year−1); low (2000–5000 m3capita year−1); and average or greater (5000 m3 capita year−1) (see SI for detailed methodology). The results demonstrate that 21 countries were categorized as 'very low' and 15 as 'catastrophically low.' The number of 'very low' countries changes to 19 and 'catastrophically low' to 9 when virtual water imports are included.
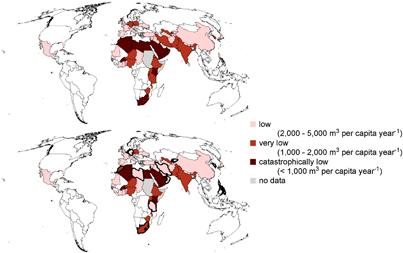
Figure 2 Countries categorized as having very low and catastrophically low water resources (m3 per capita yr−1) (upper map) and the results including virtual water imports of agricultural products (lower map). Countries with change in category are highlighted by heavy lines in the lower map. Countries in the Middle East and North Africa as well as South Africa and Korea show a dramatic change in category based on their food imports.
Download figure:
Standard image High-resolution imageWe find that the mitigation potential largely depends on the gross domestic product (GDP) per capita of each country [24] (figure 3). For countries with a GDP lower than 700 USD capita−1, which is close to the poverty line of 2 USD a day [25], including virtual water imports of agricultural products does not affect countries categorized as 'catastrophically low' or 'very low'. With GDPs between 700 and 1500 USD capita, Lesotho and Tanzania moved from the 'very low' to the 'low' category. With a GDP between 1500 and 7000 USD capita−1, Morocco moved from the 'catastrophically low' to the 'very low' category. Including virtual water imports also improved the water stress category for more well-financed countries, including four of six countries with a GDP between 7000 and 20 000 USD capita−1 and five of seven countries with a GDP over 20 000 USD capita−1. In addition to the relationships between virtual water imports and water resources [26], population, GDP, and geographical distance [9, 27], we found that net virtual water exporters are located above the line of the equation y = 10(−2×log10(x)+10), where x and y denote GDP per capita and renewable water resources per capita, respectively (figure 4). We also identified a critical threshold line y = 10(−2×log10(x)+8), below which no countries are located. This suggests that it is not possible for countries to have both low purchasing power (GDP) and few water resources. The Sustainable Development Goals [28] aims to achieve zero poverty, zero hunger, and sustainable consumption and production. The United Nations Development Programme (UNDP) remarked that the roots of the global water crisis are not related to absolute shortages of physical supply, but instead can be traced to poverty, power relationships, and water management policies [29]. Considering the unit price of water and the relationship between the virtual water trade and GDP of countries, promoting poverty alleviation and developing water resources are relevant aspects of sustainable development, and the economic strength of purchasing real/virtual water can mitigate water issues in a country. In particular, two types of strategies for sustainable development could be discussed from the perspective of water stress. Countries with abundant water resources, such as Burundi, can focus on developing water resources and producing water-intensive commodities for export. On the other hand, countries with scarce water resources such as Yemen should not focus on developing water resources but on commodities that require less water to improve GDP.
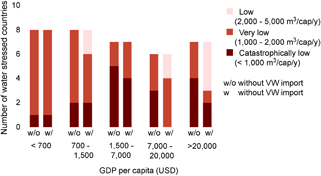
Figure 3 Changes in water stress categorization due to the inclusion of virtual water imports of agricultural products for countries based on per capita GDP in 2012. Countries with better finances were better able to mitigate their water stress by importing food.
Download figure:
Standard image High-resolution image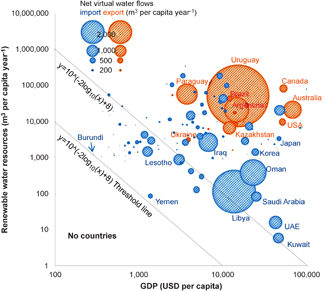
Figure 4 GDP, water resources, and net virtual water trade related to agricultural products per capita in 2012. Blue and orange represent countries with net virtual water imports and exports, respectively. Net exporters tend to have high GDP and abundant water resources. There are no countries that have both low GDP and low water resources.
Download figure:
Standard image High-resolution image
Although Australia and Kazakhstan have rich water resources per capita, they have recently experienced several water issues [30, 31]. Since the impact of drought depends on local factors such as distribution of cultivated and residential areas, crop type, and water use efficiency, it is premature to discuss locale-specific water issues using per capita values by country. To assess local water sustainability, temporal and spatial coincidence of water supply and demand based on local water cycle should be considered. We revealed that water behaves as a local resource that is characterized economically by difficulty of direct transportation. This means that sustainability assessments with a single indicator aggregated over the entire globe such as the 'planetary boundary' [32], may overlook local but serious water issues. Water availability is dependent on social infrastructure, and the environmental impacts of water use differ by time, place, and the origin of water [33−36], a concept referred to as the 'water footprint' [37]. Although the development of local water resources enables the production of water-intensive commodities, it requires investigating local water cycle and use. Other strategies can be conducted in water scarce countries such as effective use and management of water resources leading to effective virtual water import.
Acknowledgments
The authors thank H Kim, J Sheffield, the WATCH project, and G Weedon for providing valuable datasets. We also thank M Murakami for his support. This research was supported by the Japan Society for the Promotion of Science's Grants-in-Aid for Scientific Research (KAKENHI) (16H06291). Taikan Oki and Shinjiro Yano are co-first authors and contributed equally to this work. Taikan Oki designed the research strategy, wrote the manuscript, and supervised the study. Shinjiro Yano conducted model simulations, analysed the data, and wrote the manuscript. Naota Hanasaki developed analytical tools to apply the hydrological model used in this study.