

Abstract
Recent trends in summer heat waves (HW) over Central-Eastern China and their atmospheric drivers are investigated using the ERA Interim re-analysis. A composite analysis shows that these events are preceded by an increase in 500 hPa geopotential height. Consequently, a subsidence anomaly develops over the region and surface solar radiation increases. An increase in the northward moisture transport from the tropical region is also found to increase specific humidity, leading to warmer night-time temperatures. Feedback effects are also important: decrease of precipitation and enhanced evaporation also increases the specific humidity and North-Westerlies due to the low pressure lead to more heat convergence. HW occurrence increases, especially during the last decade, and is largely due to an increase in the mean temperature rather than to a change in dynamics, suggesting a human influence.
Export citation and abstract BibTeX RIS

Original content from this work may be used under the terms of the Creative Commons Attribution 3.0 licence. Any further distribution of this work must maintain attribution to the author(s) and the title of the work, journal citation and DOI.
1. Introduction
Central-Eastern China is a region heavily populated with large urban areas, and is thus sensitive to environmental extreme events such as heavy rainfall, typhoon and heat waves (HW) (Ch. 10.1.1 and 10.2.1 of the Fourth Assessment Report of the Intergovernmental Panel on Climate Change, Cruz et al (2007)). The latter events have a major impact on the society, especially in terms of human health (Luber and McGeehin 2008), and have been the focus of many works (see Lu and Chen (2016)). Many studies have found an increase in extreme heat occurrences during the last few decades over China (e.g. Ding et al 2010, Huang et al 2010, Qian et al 2011, Ren et al 2005, 2016, Wang and Fu 2013, Wei and Chen 2011, Zhou and Wang 2016) whereas other studies point out the regional differences in these trends (Ding and Qian 2011, Dong and Huang 2015, Yan et al 2011). Case studies suggest that anticyclonic circulations are associated with these events (e.g. Wei and Sun 2007), but more recently Chen and Lu (2015) and Wang et al (2016) pointed out that heat waves can occur under different configurations of the atmospheric circulation, depending on the region where the events take place. Most of the previous studies used observations from local ground stations that can provide accurate temperature of a specific location. However, some issues arise when using direct observations: stations can have missing records, inconsistencies through time (due to station relocation or instrumental change) and records can be affected by local effects such as urbanisation (Ren et al 2008, Wang and Yan 2016).
This work focuses on regional-scale HW affecting the Central-Eastern part of China (CEC). The considered region is large enough that the average temperature is less sensitive to local effects. Special attention is made to the evolution of the surrounding dynamical environment before and after the events, to highlight the most important controllers and feedbacks. The aim is to identify the leading atmospheric processes associated with the large scale HW and how these processes have impacted the evolution of extreme events during the last few decades. The underlying question is: would HW frequency increase if the background temperature had stayed constant?
The dataset and methodology are described in section 2. The characteristics of the circulation are analyzed in section 3 with a standard- and a lag-composite analysis to highlight the evolution of the atmospheric anomalies before and after the events. Special attention is paid to the trends and the attribution of the events in section 4. Results are extended to two other regions in section 5 to verify the validity of the results, and concluding remarks are given in section 6.
2. Data and methodology
2.1. Data
In this study, data from ERA Interim reanalysis (Dee et al 2011) are used at the sub-daily timescale at 0.75 degree resolution, and the 1979–2010 period is selected. Though temperature extremes on the grid scale are reduced due to the grid averaging, this dataset is continuous in time and consistent with its atmospheric circulation fields. This is important for a multi-variable composite analysis. The magnitude of the temperature is underestimated compared with station observations (figure A1) and has been pointed out by Mao et al (2010) for several reanalysis products. However the variability and trend of the temperatures are well reproduced in China (You et al 2013), confirmed by the good correlations between the observations and ERA Interim.
2.2. Definition of the regions
The Central-Eastern China (CEC) region is the main focus of the study and is defined as 30°N–40°N and 105°E–125°E, similar to Lin et al (2015) CEC region. To extend the validity of the results, two other regions are investigated and briefly discussed as complementary results: North-Eastern China (NEC) and South-Eastern China (SEC). These two regions are defined as a grid box on the same longitude (105°E–125°E) but 10 degrees latitude north or south of the CEC region (40°N–50°N for NEC, 20°N–30°N for SEC).
2.3. Heat waves definition
The methodology is described for the CEC region but the process is similar for the two other regions. HW are determined based on daily minimum (nighttime, MN2T) and maximum (daytime, MX2T) temperatures at 2 m height. The temperatures are first averaged over the CEC region, thus the events considered in this study are on a regional scale. Moreover, only the extended summer (May-September) of each year is considered to focus on the warmer period of the year. A criterion of at least 5 consecutive days of anomalously high temperature is introduced to identify a HW. To define extreme high temperatures in China, a threshold of 35 °C is commonly used by the China Meteorological Administration (www.cma.gov.cn/en/WeatherWarnings/). However threshold-based indicators of extreme temperatures exhibit large geographical variations and are more appropriate for local measurements. To be more consistent with the regional averaging used in this study, a percentile threshold based on the regional-averaged temperature is used. Two different percentiles are considered (based on all days of the extended summers during 1979–2010):
- Absolute (P90abs): The 90th percentile of the daily temperature. This threshold corresponds to the 10% warmest days of the period.
- Anomaly (P90ano): The 90th percentile of the temperature after removing its interannual oscillations. For this threshold, the 365 d running mean is first removed from each daily temperatures. Then the percentile is computed, based on the anomalies of temperatures, and P90ano corresponds to the 10% largest anomalies of temperature during the period.
For each case, percentiles are computed separately for MN2T and MX2T. Thus each variable uses a different threshold. With these definitions, the long term trends and interannual to decadal variability of the temperature are taken into account in P90abs and removed in P90ano. MN2T and MX2T can be anomalously high at the same time, and they can also be independently higher than usual (warm night with normal day time temperature, or the opposite). Accordingly, different types of events are defined and summarized in table 1. It is verified that the heat wave affects the whole region, with MN2T and MX2T increasing over a large area (figure 1(a)) with anomalies larger than 2 ∘C. It is important to remember that the events considered in the study have a large spatial scale (hundreds of kilometres) and are persistent (more than 5 d), and results may differ from local heat wave studies. Though the main focus of this study is on the HW, other types of events are used for analysis purpose and to highlight the physical processes.
Table 1. Definition and notation for warm events. Below the names of the thresholds are indicated the actual values used for Tmax (first value) and Tmin (second value). Next to the notations of each events is the number of days (during the whole period) included in these respective events.
| Threshold used to select anomalous high temperatures | ||
|---|---|---|
| Variable | P90abs | P90ano |
| (29.7 °C/24.3 °C) | (12.1 °C/13.1 °C) | |
| MX2T and MN2T | HW (Heat Wave)—86 d Main heat wave definition, when the temperature is higher than P90abs during at least 5 consecutive days and nights. | HWano—111 d When the temperature anomaly is higher than P90ano during at least 5 consecutive days and nights. |
| MX2T | EH (Extreme Heat)—223 d When the daily maximum temperature is higher than P90abs during at least 5 consecutive days. | EHano—225 d When the daily maximum temperature anomaly is higher than P90ano during at least 5 consecutive days. |
| MN2T | TN (Tropical Night)—330 d When the daily minimum temperature is higher than P90abs during at least 5 consecutive days (tropical night). | TNano—309 d When the daily minimum temperature anomaly is higher than P90ano during at least 5 consecutive days. |

Figure 1 Composites of atmospheric field anomalies during HW events, for (a) MX2T (shading, °C) and MN2T (contours, °C); (b) Z500 (shading, m), U200 (black contours, m s−1), W500 (green contours, Pa s−1); (c) SLP (shading, hPa), SSR (red contours, W), U850 (vectors); (d) Q (shading, g kg−1), RH (black contours, percentage). The blue box in all plots indicates the CEC region. Solid and dash contours indicate positive and negative anomalies respectively. Only regions with significant results are shown.
Download figure:
Standard image High-resolution image2.4. Computation of the composites
The characteristics of the circulation associated with HW events is analyzed using a composite analysis. A common methodology is to compute composites by removing the climatological signal. However with this definition anomalies may be biased by long term trends for some variables, such as the increase in atmospheric moisture content or geopotential height in a warmer climate. Here our main focus is to identify processes that can lead to short timescale heat waves (5 d). Thus, to remove long term trends on the atmospheric variables, the anomalies of dynamical and thermodynamical variables are computed by removing the 30 d mean (of the respective variables) around each day included in a HW. The methodology is also tested by removing the 45 d mean but results are very similar. Then anomalies are averaged for the whole 1979–2010 period to obtain a composite anomaly associated with HW. Results are tested with a student t-test (comparing the mean and standard deviation of the composites with the mean and standard deviation of the summer climatology at each grid point) and considered significant when above the 90% confidence level.
3. Dynamical control of the heat waves
3.1. Main characteristics of the circulation associated to the HW events
The composite analysis is performed for the following atmospheric variables: 500 hPa geopotential height (Z500), 200 hPa zonal wind (U200), 850 hPa wind (U850), 500 hPa vertical velocity (W500), surface solar radiation (SSR), sea level pressure (SLP), 850 hPa specific (Q) and relative (RH) humidity fields (see Supplementary appendix A.1 available at stacks.iop.org/ERL/12/024015/mmedia for the list of acronyms). Results are shown in figure 1 for HW.
A well-defined positive anomaly in Z500 is visible over the studied region, associated with a W500 subsidence anomaly and a northward displacement of the upper level subtropical jet. These patterns facilitate clear sky conditions over the region, shown by a positive anomaly in SSR. A low pressure anomaly (SLP) also develops over North-Eastern China due, we speculate, to a dynamical adjustment to the heating and a development of a meridional cell. Indeed, it is verified that an ascending motion anomaly in W500 develops to the north of the CEC region, in response to the subsidence over CEC region (figure A2(a)). The low is associated with a cyclonic anomaly in U850. The main signal is an increase in South-Easterlies but during the later phase of the HW (investigated later with the lag-composites) the North-Westerlies increase significantly. Q tends to increase over a large area while RH is reduced (figure 1(d)), i.e. the absolute humidity increases but the relative humidity decreases because of warmer air temperatures.
The anomalies in Z500 are probably due to a north-westward extension of an enhanced Western North Pacific High (supported by the anticyclonic anomaly on U850 over the Pacific), and the associated subsidence (W500) and increase of SSR create favorable conditions for a warming of daytime temperature. The increase in moisture transport is related to an atypical strong advection over the South and East Asia region. It leads to a reduction of the night-time radiative cooling (verified by a negative anomaly on the outgoing long wave radiation at the top of the atmosphere, supplementary figure A2(b)) and creates conditions for warmer nights. Thus, two separate mechanisms act together and lead to hot conditions during both day- and night-time. Moreover, as pointed out by Chen and Lu (2015, 2016), the circulation developing over North-Eastern China can bring warm air to North-East China due to the foehn effect of the mountains over the Mongolian Plateau, which could increase temperatures locally or over the region. An estimation of the foehn effect, using the atmospheric mass flux and the variation of topography, indicates a magnitude of about 10% to 15% of the total energy flux. The heat released by the formation of precipitation (over the SLP low anomaly) can also be advected by the North-Westerlies. Different processes can act together but the main point is that the North-Westerlies associated with the cyclonic anomaly create a convergence of energy over the CEC region. The composite patterns for HW and HWano are very similar, indicating that processes governing heat waves in this region are independent of long term climate variability.
The main mechanisms governing the increase in MN2T and MX2T are highlighted by comparing composites of TN and EH (not shown). EH has a larger dynamical signal with a stronger anomaly in U200 and Z500, and drier conditions with higher SSR and lower Q. TN is mostly associated with an enhanced moisture flux from the tropical and subtropical areas and a large increase in Q and RH. Thus, there are two complementary mechanisms (local heating and moisture advection) that can act either separately (leading to EH or TN respectively) or act together, leading to HW events.
3.2. Drivers and feedback processes
To analyse the control of the dynamics in more details, a lag-composite analysis is performed. The methodology used to obtain the composites is the same as described above, except that anomalies are computed from 1 to 10 d after and before each day associated with a heat wave (figure 2). Results are averaged over the region of interest, except for U200 and SLP that are averaged over the regions of their respective maximum anomalies observed in figure 1. The 2 m mean temperature (T2M), MN2T and MX2T are also considered to verify the temperature evolution during the HW events. Moreover, the anomaly of the vertically integrated transport of moisture (Equations of variables 71 and 72 in Berrisford et al (2011)) across each border of the domain is included to analyse the moisture advection (TQ, figure 3(a)). The averaged moisture convergence (TQC, Equations of variable 84 in Berrisford et al (2011)) over the domain is compared with the evaporation minus precipitation flux (EP) in figure 2(b). The horizontal energy transport (TET, including the latent heat, potential and dry static energy, Equations of variables 75 and 76 in Berrisford et al (2011)) across the borders of the domain is also illustrated in figure 3(b). The associated heat convergence (THC, Equations of variable 86 in Berrisford et al (2011)) averaged over the domain is compared with the SSR in figure 2(c).

Figure 2 Lag-composites of anomalous atmospheric fields: (a) Z500 (20 m), U200 (4.5 m s−1), W500 (0.01 Pa s−1), SLP (3 Pa); (b) SSR (50 W), THC (50 W), EP (3 mm d−1), TQC (3 mm d−1); (c) Tmean (2 K), MN2T (2 K) and MX2T (2 K). The scale on the left is different for each variable with a factor indicated between brackets along with the units. The x-axis corresponds to the number of days before (negative) and after (positive) the heat wave event (centered at 0 and with the two dashed gray lines representing the typical 5 d length of an event). All variables are averaged over the domain (blue box on figure 1) except U200 (north of the domain, 100°E:120°E–41°N:46°N) and SLP (north-east of the domain, 110°E:140°E–40°N:50°N) to capture the regions of the most significant signal on these variables. In (a) and (b), circle symbols indicate values that are above the 90% confidence interval based on a t-test.
Download figure:
Standard image High-resolution image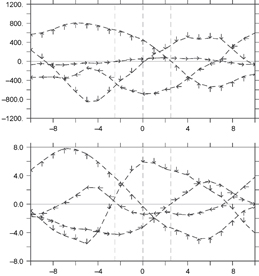
Figure 3 (a) 850 hPa moisture transport (TQ, kg m s−1) integrated along each border of the domain. The direction of the arrows corresponds to the different borders: 30°N (up), 40°N (down), 105°E (right) and 125°E (left). Positive (negative) values indicate a transport inside (outside) the domain respectively. (b) Same as (a) but for the total energy transport along each border of the domain (PW).
Download figure:
Standard image High-resolution imageThe positive anomalies in Z500 and subsidence anomaly in W500 start to develop seven to six days before the peak of the HW (figure 2). These are quickly followed by an increase in SSR while THC remains low. Thus SSR is the main driver for the increase in MX2T during the first phase of the event. Then both Z500 and W500 anomalies decay following the peak of the HW. This supports the idea that atmospheric dynamics are the key driver of these events. Total heat convergence sharply increases during the HW, due to the reversal of the energy transport across 40∘N, confirming the important role of the feedback from the cyclonic and low pressure anomaly (visible on TET maps in supplementary figure A3). This feedback increases the heat convergence in the region during the HW and keeps the temperatures anomalously high. In terms of moisture changes, it is also noticeable that TQC is anomalously high before the HW, due to an increase in TQ from the tropical regions (30°N border, figure 3, and TQ in supplementary figure A3). Before the HW, TQC is about the same order as EP, thus both the local increase of EP and the moisture transport are necessary to create the humid conditions associated with the events. EP decreases rapidly during the event, but TQC remains high for a longer time and acts to maintain high absolute humidity. It is verified that the increase in EP is mainly due to a lack of precipitation (not shown), but also to an increase in evaporation (10% to 20% of the signal) that dry the soil humidity content.
To summarize, the leading process comes from the mid-troposphere (Z500 and W500) and the moisture transport (TQ). Other variables are responding to these forcings but can also have a positive feedback effect, especially the lack of precipitation and increase in evaporation that increase the humidity and the heat advection at the northern boundary of CEC due to the development of the low pressure system.
HWano has the same signals except that the magnitude of the anomalies are slightly different. The main difference in the processes between EH (or EHano) and TN (or TNano) is that the former has a weak signal on TQ and a stronger response on W500 while the later has a larger increase in TQ (across the South boundary of CEC) preceding the event. This confirms the findings of the previous studies that extreme heat is associated with subsidence anomaly and dry conditions while tropical night is linked to humid conditions. Finally, results are very similar for events using P90ano as a threshold. Thus, the processes associated to hot MN2T or MX2T seem to be consistent through time (whether the long term trend is taken or not into account) and the events are driven by the same mechanisms. MX2T is increased due to solar radiation and relatively dry conditions during day time while MN2T stays high during the night due to the reduced cooling by the atmospheric moisture.
4. Long-term trends and attribution
Analyses above highlighted the leading character of the atmospheric dynamics in driving HW events. In this section, we first examine how the occurrence of heat waves have changed since 1980. Then the reasons of the change in the occurrence of HW is analyzed, focusing on the relative role of dynamics vs general warming.
The trends in the MN2T and MX2T intensity and the occurrence of heat waves are displayed in figure 4. Both MN2T and MX2T have increased by about 1 °C. It is noticeable that the mean trend is mostly due to a fast transition during the mid-90s. It has been pointed out in several studies (e.g. Dong et al 2016a, Wei and Chen 2011) and is also observed in other parts of the world (e.g. Dong et al 2016b, Robson et al 2011, Sutton and Dong 2012). Before and after this transition, the linear trend is much smaller. However, there is no such transition in the HW (and EH or TN) signal. All heat waves based on P90abs show a noticeable increase in occurrence during the period 1979–2010. Thus, it is becoming more common for abnormal high temperatures to persist for several consecutive days over the region. It is also noticeable that the timing of the HW tends to shift between the first and the last decade of the analyzed period.
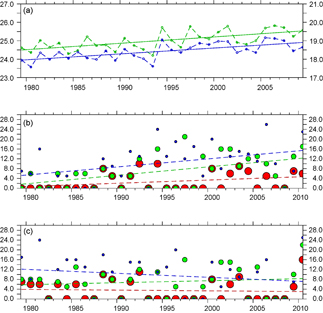
Figure 4 (a) CEC region mean of the extended summer (May-September) averaged intensity of MN2T (blue circles, right scale) and MX2T (green circles, left scale) of each year and trends (dashed lines). (b) Occurrence of HW (red), EH (green) and TN (blue) for each year and trends (dashed lines). (c) Same as (b) but for HWano, EHano and TNano. The occurrence of heat waves corresponds to the number of days during a heat wave for the extended summer of each year. Units are K for (a) and number of days for (b) and (c).
Download figure:
Standard image High-resolution imageAs illustrated by figure A4, HW events mostly occur during the mid-summer (mid-July) for the first decade while they occur later (until mid-August) for the last decade. The change in the emergence periods of heat waves is especially visible for EH events. During the last decade, they occur much more early in the summer (from early June) and can last until September, extending EH season. On the contrary, TN do not show a clear shift in the seasonal signal but only an increase of events during the mid-summer period. Finally, in figure 4(b) the HW signal suggests a decadal oscillation, with many events during 1988–1994, no events during 1995–1999 and then more events. However this signal is not found on EH or TN or in temperatures (MN2T and MN2T) and the interannual variability is not correlated to ENSO event years. Hence it may be due to weather variability. However, figure 4 of Kenyon and Hegerl (2007) shows that the influence of El-Niño on extreme temperatures over China during the summer is locally significant, thus the influence of climate oscillation can still play a role in the number of heat waves.
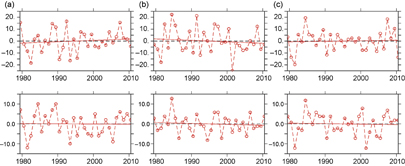
Now, when considering the heat waves based on P90ano, no significant trend is found (figure 4). Thus there is no indication that MN2T and MX2T develop longer or more intense anomalies relatively to the background temperature. It supports the idea that the increase in heat waves frequency, defined with a threshold based on the absolute temperature, is mainly due to an increase in the global background temperature, and not in a change of dynamical conditions or anomalies, consistent with previous studies of human influence on extreme temperatures over China (Lu et al 2016, Sun et al 2014). This point is verified by calculating the evolution of the main dynamical anomalies that were identified as precursors to the heat waves (Z500 and TQ) and the results are displayed in figure 5. None of the variables investigated shows a significant trend during the 1979–2010 period. Dynamics anomalies lasting for 5 d of more are also investigated to examine whether atmospheric anomalies could last longer. Again, no significant trend is found. Based on these results, we infer that the increase of HW events observed in CEC is mainly due to the increase in the background temperature. This finding is consistent with Qian et al (2011) even if the methodology is different. This highlights the importance of the mean change of the temperature over China. It is worth noting that this conclusion is based on regional-scale HW and could be different at smaller scale where local effects may be dominant, such as changes in land use and urbanisation. Moreover, Ding et al (2010) found a significant shift in large scale dynamics when comparing years with low or high occurrence of hot days. Thus the impact of the dynamics at longer timescale can also be important. Here we considered only the high frequency variability of the dynamics (anomalies of one to five days) and this variability do not show a significant shift during the three investigated decades.
Figure 5 (a) Yearly number of days (during the extended summer) with a positive anomaly of Z500 over the CEC region, relative to its 1979–2010 mean. (b) Same as (a) but for TQ at the southern border of the domain. (c) Same as (a) but for positive anomalies on Z500 and TQ occuring at a same day. (d)–(f) is the same as (a)–(c) but for anomalies lasting for at least 5 consecutive days.
Download figure:
Standard image High-resolution image
5. Can results be extended to other regions?
To extend the validity of the above conclusions, the diagnostics are repeated for two other regions in Eastern China (NEC and SEC) and briefly discussed here. The dynamical processes associated with HW in NEC present some similarities to CEC results, with a large signal on Z500, U200 and moisture variables. However the patterns on SLP and wind and their potential feedback processes are different. As for the SEC region, it does not exhibit clear composites with our methodology, but Chen and Lu (2015) showed that for this region there is a local anticyclone, associated with a southwesterly anomaly at the northwest. It is clear that dynamical anomalies associated with HW vary with the region of analysis, and our findings for CEC cannot be generalized. However, both SEC and NEC regions exhibit very similar results for the trends in heat waves and confirm results from Chen et al (2016). Specifically, both experience an increase in occurrences when using an absolute threshold (P90abs), and no significant trend when using anomalies relative to the yearly-averaged temperature to define HW (P90ano). It confirms that the increase in heat wave occurrence over Eastern China is mainly due to the rise in the mean temperature, independently of the chosen region.
6. Concluding remarks
The characteristics of heat waves affecting Eastern China have been investigated in this study. It was found that the main driver of these events is an atmospheric dynamical anomaly. Before a HW, a positive anomaly in the 500 hPa geopotential height develops and is accompanied by a subsidence anomaly and an increase in surface solar radiation. A lag-composite analysis highlighted the leading role of dynamics in heat wave events. It was found that the advection of heat and moisture from tropical regions have clear positive anomalies preceding the HW. Moreover, feedback effects (lack of precipitation and increase in evaporation over CEC, and heat convergence due to the development of a cyclonic anomaly over the northern region) play a significant role in maintaining high temperatures during the events.
The trend in heat waves is found to be positive during the 1979–2010 period when using a fixed threshold based on the absolute temperature during the same period. But no tendency is discernible when using anomalies of temperature to define heat waves, which removes the interannual oscillations and the long-term trend of the mean temperature. This indicates that the background temperature is becoming warm enough that day- and night-time temperatures are considered abnormally warm (compared to the climatology) more often. However, there is no indication that anomalously warm days or nights relative to the yearly mean occur more frequently. Moreover, no significant change in the occurrence of dynamical patterns leading to heat waves was found, confirming that the observed increasing trend in the heat waves is mainly due to the increase in the mean temperature. Similar results were found for other regions in Eastern China (NEC and SEC).
It should be noted that the definition of heat waves in this study include a persistence of five consecutive days criteria. Thus the trends in the number of extreme high temperatures may be different compared to the trend in heat waves, as the number of warm days could still increase (even if removing the trend and oscillation of the background temperature) but not occur consecutively. Finally, heat waves analyzed in this study are based on regional-scale temperatures. Local temperatures could have significant different trends and be associated with predominant local mechanisms especially in urban areas (such as aerosols), and should be studied independently. Aerosols effects are not included in ERAInterim and could have critical impact on the variability of extreme temperatures.
Acknowledgments
This work and its contributors (N. Freychet, S. F. B. Tett, G. C. Hegerl) were supported by the UK-China Research & Innovation Partnership Fund through the Met Office Climate Science for Service Partnership (CSSP) China as part of the Newton Fund. The Newton fund also funded Jun Wang's visit to Edinburgh for its collaborative work. We deeply thank the three reviewers for their comments and corrections that help us to improve this study. The authors wish to acknowledge use of the Ferret program for analysis and graphics in this paper. Ferret is a product of NOAA's Pacific Marine Environmental Laboratory. (Information is available at http://ferret.pmel.noaa.gov/Ferret/). All the scripts used to analyse data are available at http://datashare.is.ed.ac.uk/handle/10283/2341.
Supplementary data (PDF)