

Abstract
The response of lightning rates over Europe to arrival of high speed solar wind streams at Earth is investigated using a superposed epoch analysis. Fast solar wind stream arrival is determined from modulation of the solar wind Vy component, measured by the Advanced Composition Explorer spacecraft. Lightning rate changes around these event times are determined from the very low frequency arrival time difference (ATD) system of the UK Met Office. Arrival of high speed streams at Earth is found to be preceded by a decrease in total solar irradiance and an increase in sunspot number and Mg II emissions. These are consistent with the high speed stream's source being co-located with an active region appearing on the Eastern solar limb and rotating at the 27 d period of the Sun. Arrival of the high speed stream at Earth also coincides with a small (∼1%) but rapid decrease in galactic cosmic ray flux, a moderate (∼6%) increase in lower energy solar energetic protons (SEPs), and a substantial, statistically significant increase in lightning rates. These changes persist for around 40 d in all three quantities. The lightning rate increase is corroborated by an increase in the total number of thunder days observed by UK Met stations, again persisting for around 40 d after the arrival of a high speed solar wind stream. This result appears to contradict earlier studies that found an anti-correlation between sunspot number and thunder days over solar cycle timescales. The increase in lightning rates and thunder days that we observe coincides with an increased flux of SEPs which, while not being detected at ground level, nevertheless penetrate the atmosphere to tropospheric altitudes. This effect could be further amplified by an increase in mean lightning stroke intensity that brings more strokes above the detection threshold of the ATD system. In order to remove any potential seasonal bias the analysis was repeated for daily solar wind triggers occurring during the summer months (June to August). Though this reduced the number of solar wind triggers to 32, the response in both lightning and thunder day data remained statistically significant. This modulation of lightning by regular and predictable solar wind events may be beneficial to medium range forecasting of hazardous weather.
Export citation and abstract BibTeX RIS

Content from this work may be used under the terms of the Creative Commons Attribution 3.0 licence. Any further distribution of this work must maintain attribution to the author(s) and the title of the work, journal citation and DOI.
1. Introduction
The Sun undergoes an approximately 11 year activity cycle driven by the differential rotation rate of the solar convection zone. This differential rotation of the solar plasma distorts the solar magnetic field, gradually converting a polar field into a toroidal one throughout the solar cycle (Babcock 1961). As the magnetic field becomes more distorted, complex regions of intense magnetic field emerge through the photosphere. Observed in visible light, the emerged magnetic flux tubes with larger diameters appear darker than the surrounding photosphere and are known as sunspots. Solar influences on the terrestrial atmosphere, and, in particular, effects on electrified storms have been studied for many years, as summarized by Schlegel et al (2001). Stringfellow (1974), found a correlation between sunspot number and day on which thunder was heard ('thunder days') in the UK while other studies (Pinto et al 2013) have found an anti-correlation between solar cycle variations and thunder days. Brooks (1934) analysed data from a variety of locations and found a large variation in the relationship between sunspots and thunderstorm activity. Markson (1981) demonstrated a positive correlation between galactic cosmic ray (GCR) flux and ionospheric potential which, it has been argued, indicates a sensitivity of thundercloud electrification to ambient electrical conditions. Mechanisms have subsequently been postulated by which solar activity could influence the frequency of terrestrial lightning through modulation of the solar irradiance, the GCR flux or some combination of these two. These are discussed below.
Increase in GCR flux may directly trigger lightning through 'runaway breakdown' of electrons, leading to breakdown (Roussel-Dupré et al 2008). This is supported by recent observations of energetic photons from thunderstorms, as predicted by runaway breakdown theory (e.g. Gurevich and Zybin 2005). In a study using 16 years of lightning data over the USA, Chronis (2009) found lightning activity dropped 4–5 d after a transient reduction in GCRs (a Forbush decrease), with a positive correlation between lightning and GCRs during the winter. Before the final triggering of lightning however, an increase in atmospheric ionization may also reduce the effectiveness of thunderstorm charging processes. In the extreme case of a simulated nuclear winter, in which atmospheric ionization was assumed to be vastly increased, Spangler and Rosenkilde (1979) estimated that charging of thunderstorms would be inhibited. However, following the Chernobyl reactor accident, in which lower troposphere ionization increases occurred, an increase in lightning was observed as radioactivity passed over Sweden, so the response may be complex (Israelsson et al 1987). For example, changes in atmospheric conductivity also occur with natural variation in cosmic ray ionization (Harrison and Usoskin 2010). Hence establishing the sign of the response in lightning to GCRs may therefore be complicated by competing processes, in which different regional meteorological characteristics also play a role. The analysis here uses well-defined marker events in the solar wind to investigate the response in lighting over the UK, as detected by a very low frequency lightning detection system.
2. Solar modulation of GCRs
While most of the solar atmosphere is retained by gravity, energetic particles can still escape and form a continuous stream of plasma into interplanetary space known as the solar wind. There is also an extremely energetic, but intermittent, population of particles known as solar energetic protons (SEPs). The solar wind speed varies between 400 and 2000 km s−1 and is modulated by the local solar magnetic field at its point of emergence. Source regions connected to the heliospheric magnetic field (HMF) through 'open' field lines are associated with high speed solar wind streams while source regions with 'closed' magnetic topology are associated with slow solar wind streams. Despite differential rotation of the solar convection zone and surface, the magnetic field in the solar atmosphere means it rotates as if it were a solid body, resulting in a modulation of the solar wind at Earth of a period close to 27 d as fast and slow solar wind streams sweep past our planet. The passage of a fast solar wind stream also generates a temporary enhancement in plasma density and magnetic field strength of the solar wind at Earth called a 'co-rotating interaction region' (CIR) which further modulates the GCR flux (Rouillard and Lockwood 2007). Because CIRs persist for several solar rotations the decreases in GCR flux they cause tend to recur at Earth every 27 d, whereas the transient Forbush decreases do not.
Transient Forbush decreases at Earth are caused by the passage of coronal mass ejections (CMEs). A CME is generated after a reconfiguration of complex regions of magnetic field in the solar atmosphere which result in vast magnetic 'clouds' of solar plasma erupting into interplanetary space. A typical CME contains around one billion tonnes of material travelling at up to 2500 km s−1. The CMEs add to the quiet solar wind outflow driven by the high temperatures of the solar atmosphere and as CMEs and the solar wind propagate away from the Sun, they extend the solar magnetic field into interplanetary space where it becomes known as the HMF. The occurrence rate of CMEs is modulated by the solar activity cycle, with more occurring at solar maximum. The relative strength of the HMF is therefore greater at the peak of the cycle (Owens and Lockwood 2012). The HMF modulates the flux of highly energetic particles, GCRs, which are pervasive throughout the solar system. These particles have been accelerated to such high energies (typically 0.5 GeV–100 GeV) by extreme events in the Universe such as supernovae. On entering the Earth's atmosphere, these particles collide with gas particles, generating neutrons that can be detected by monitoring stations on the ground (e.g. Usoskin et al 2009). The GCR flux measured in this way is inversely proportional to the strength of the HMF, which in turn approximately follows solar activity and sunspot number (e.g. Rouillard and Lockwood 2004). The passage of a CME past Earth is known to further modulate the GCR flux as it brings with it a localized cloud of magnetized plasma. This enhanced field results in a temporary reduction in the GCR flux, (a Forbush decrease) used as marker events for comparison with lightning in the study of Chronis (2009).
While Earth-directed CMEs generate the largest Forbush decreases in cosmic ray flux, there are relatively few of these events in any given solar cycle. In their analysis, for example, Usoskin et al (2008) identified 39 strong Forbush decreases in data from the World Neutron Monitor Network since 1964. Instead, in this paper, we consider the arrival of high-speed solar wind streams at Earth from 2000 to 2005 and combine these in a superposed epoch analysis to look for a modulation in lightning rates in data from the arrival time difference (ATD) lightning detection network of the UK Met Office (Lee 1989). While these solar wind streams cause smaller decreases in GCR flux than CMEs, they are sufficiently numerous to allow a meaningful statistical analysis (for comparison, Usoskin et al (2008) identified 14 Forbush events between 2000 and 2005).
3. Method
3.1. Identifying trigger events
The arrival of high speed solar wind streams at Earth can be inferred from sudden changes in the Vy component of the solar wind in the Geocentic-Solar-Ecliptic (GSE) frame of reference i.e., anti-parallel with the Earth's orbital direction (e.g. McPherron et al 2004; Denton et al 2009; Davis et al 2012). Here we used solar wind data from the Advanced Composition Explorer (ACE) spacecraft (Stone 1998), orbiting the L1 Lagrangian point 0.01 au upstream from the Earth in the solar wind, along the Sun–Earth line (the X direction of the GSE frame). Arrival of a high-speed stream at Earth was identified if the solar wind Vy component increased by more than 75 km s−1 over 5 h. While the exact Vy threshold used is arbitrary, our results are robust to different choices; the threshold described presents a good compromise, generating 532 pronounced events.
These event times were used as markers around which responses in other solar wind and geophysical parameters were averaged, which is essentially the super-posed epoch or compositing technique originally described by Chree (1908). Compositing provides a useful way of investigating weak yet repeated signals that may otherwise be swamped by larger random variations. By aligning the secondary data according to the times identified in the primary data (the 'trigger' times) and calculating the median response, random responses will average out to zero while any (even small but) consistent signal will remain. Medians rather than means are calculated to ensure that the combined result is not dominated by one or more large outliers in the data. In our study, 'trigger' times were the times at which enhancements were observed in the solar wind Vy component. Repeating the analysis many times using random trigger times, the probability of whether a given response exceeds that expected by chance can be found by calculating the 95 and 99 percentiles of these random responses. The significance of any response can be further investigated by comparing the data used to calculate median values at a range of times before and after the 'trigger' time using a two-sided Kolmogorov−Smirnov test.
3.2. Geophysical parameters considered
In our study we first ensured that we were correctly identifying the arrival of solar wind streams by calculating the median solar-wind velocity, Vy, and magnetic field strength, Bt from periods of data corresponding to an interval of 60 d around the trigger times identified. These times were then used to calculate the associated median variability in solar parameters (total solar irradiance (TSI), sunspot number, Mg II emission, SEP flux and GCR flux), terrestrial lightning rates and thunderstorm activity.
The speed and density of the solar wind were calculated using data from the NASA ACE Spacecraft (Stone et al 1998). The associated variations in TSI, sunspot number and Mg II emissions were used to investigate whether there was any solar variation associated with the generation of high-speed streams. The TSI data used is the PMOD composite of observations (Fröhlich 2006) which is consistent with other solar indicators and with irradiance modelling in its long-term behaviour (Lockwood and Fröhlich 2008). The Mg II emission index (Heath and Schlesinger 1986) was included in this analysis as this is often used as a proxy for many UV emissions (Viereck et al 2001).
Information about the solar wind energetic particles or SEPs was obtained from the GOES dataset (GOES N Databook 2006), which combines data from several spacecraft. Proton energies are recorded in seven channels, each identified by its low energy detection threshold. They are; > 1 Mev, >5 Mev, >10 Mev, >30 Mev, >50 Mev, >60 Mev and >100 Mev.
The GCR flux incident at Earth was determined using data from the neutron monitoring station at Oulu (Kananen et al 1991). This flagship dataset is a widely-used standard within the solar-terrestrial physics community. It is a continuous, well-calibrated dataset, which, because of the station's high latitude location, records cosmic rays of energies down to the atmospheric cut-off of about 1 GeV (at lower latitudes, the geomagnetic field shielding gives higher cut-off energies).
Lightning rates were obtained from the ATD system of the UK Met Office (Lee 1989). This system uses a series of radio receivers located around Western Europe to detect the broad-band radio emission emitted by lightning. Accurate timing of the arrival of such 'sferics' at a range of stations allows the location of lightning to be determined with an accuracy of 5 km over the UK. The ATD system has been designed to have greatest efficiency in detecting cloud-to-ground (CG) lightning over Europe. The current study uses ATD data between September 2000 and June 2005, as this represents a period when the detection sensitivity of the system was not subject to modifications influencing its sensitivity. After this period the system was expanded and increased in sensitivity to form ATDnet, which detects a much larger number of smaller sferics. While the ATD system from 2000–2005 was capable of detecting lightning worldwide, the sensitivity of the network was reduced for large distances. In order to ensure some uniformity of the lightning measurements within our analysis we therefore restricted our data to any event that occurred within a radius of 500 km from central England. The time range of the ATD data used in this study encompasses 405 of the 532 trigger events identified in the ACE spacecraft data.
The presence of thunderstorm activity is also recorded at manned UK Met Office observing sites. Conventionally, a 'thunder day' is considered as any day on which thunder was heard at an observing site. While this observation is subject to false positives (such as vehicle noise or explosions being misidentified as thunder) and is of a lower time resolution compared with the lightning data, it provides an independent measure of the presence of thunderstorm activity on a given day.
4. Results
After identifying when high-speed solar wind streams arrived at Earth (as described in section 3.1), these times were used to define t = 0 in all the geophysical datasets and the median response was calculated for each parameter as a function of event time t for ±60 d around this time.
4.1. Solar wind
Figure 1 presents the median change in solar wind parameters measured by the ACE spacecraft. The top panel shows the distribution of 'trigger' events within the epoch under consideration. As expected, the maximum number of triggers (532) is seen at event time t = 0. Plotting the distribution of triggers used in this study demonstrates that there are no other times within 60 d of the trigger time at which there is such a large number of high-speed streams arriving at Earth. This is demonstrated by the middle panel of figure 1 in which the median response in the solar wind Vy component is presented. Around event time t = 0, the tangential solar wind decreases from a background level just below 0−35 km s−1 and then increases to over 60 km s−1, all within a period of around 2 d, with the greatest change at time zero. The grey band, in this and subsequent plots, represents the standard error in the median for all the data points within each time bin of the composite analysis. Outside this time window there are no other changes in Vy that greatly exceed the 95 and 99 percentiles of the data (represented by the dot-dashed and dashed lines respectively) though there is a hint of the solar rotation rate with slight enhancements in Vy at ± 27 d and ± 54 d. These percentiles were estimated by repeating the composite analysis one hundred times using the same number of trigger times drawn at random from within the scope of the study. The percentiles were then estimated by sorting the distributions in each time bin and ascertaining the 95 and 99 percentiles. The bottom panel of figure 1 shows the associated median change in magnetic field strength associated with high-speed solar wind streams. At t = 0, the total magnetic field strength, Bt, peaks at about 13 nT compared with the background of around 6 nT. The field rapidly increases and decays over 2 d around the peak. Other than this peak around t = 0, there are no significant enhancements in the median solar wind magnetic field magnitude though again there are hints of the solar rotation rate in enhancements at ±27 d and ±54 d.
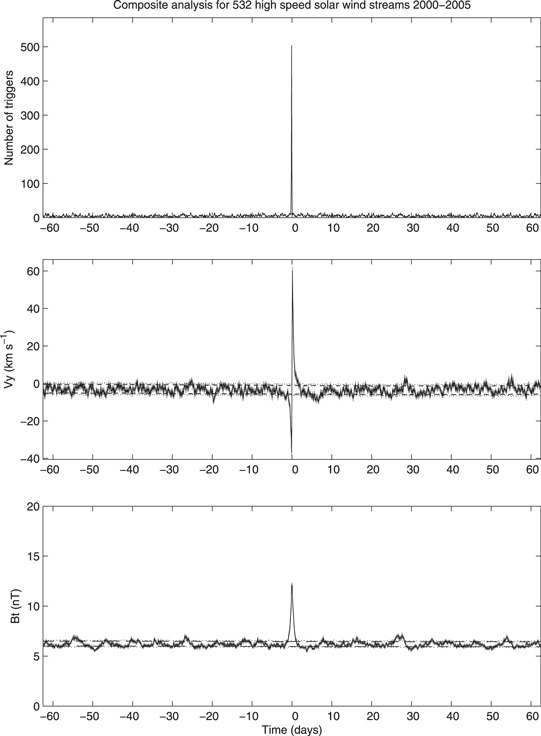
Figure 1. The response of solar wind parameters in a superposed epoch analysis using enhancements in ACE Vy data as the trigger times, during 2000 to 2005. The top panel presents the number of triggers within each hourly time bin of the superposed epoch analysis. 532 events were identified in the ACE solar wind data corresponding to times at which the Vy component of the solar wind increased by more than 75 km s−1 in 5 h. Such an enhancement is indicative of the arrival of a high-speed solar wind stream at Earth. The middle panel contains the median response of the Vy component of the solar wind as measured by the ACE spacecraft. In this, and subsequent plots, the median response is represented by a solid line, the standard error in this median as a grey area around the line while the dashed lines and the dotted lines correspond to the 95% and 99% levels of the dataset respectively. These percentile levels were calculated by repeating the analysis many times using random trigger times and determining the levels in each time bin that contained 95 and 99% of the data points. The lower panel contains the median response in the magnitude of the interplanetary magnetic field, Bt.
Download figure:
Standard image High-resolution image4.2. Solar irradiance
Three associated measures of solar activity are compared in figure 2. The median TSI (figure 2, top panel) shows a small (0.01%) but significant decrease some 7 d ahead of the arrival of fast solar wind streams at Earth. This decrease is associated with a rise in the median sunspot number, which lasts for around 12 d. This is the time taken for half a solar rotation (13.5 d) with respect to the Earth and is likely to be caused by the appearance and rotation of active regions on the solar surface. In the photosphere, active magnetic regions manifest themselves as sunspots—darker cooler regions where the convection of the plasma has been suppressed by the strength of the local magnetic fields. Sunspots have been used as a proxy of solar activity for many hundreds of years. The peak sunspot number and minimum TSI will, on average, be when the sunspots are close to the centre of the solar disk and this occurs between t = −6 d and t = −4 d which is close to the delay expected for the (radial) solar wind from such a region to reach Earth. The complex magnetic field topology around such regions is likely to lead to areas of open solar flux along which fast solar wind streams can emerge and so it is not unexpected that the two phenomena should be linked. The bottom panel of figure 2 presents the median Mg II index of solar emission. This broad emission, centred on a wavelength on 279.9 nm, has been found to be a convenient proxy for UV emissions at other wavelengths. It presents similar behaviour as sunspot number, peaking between 8 d and 2 d before t = 0. The downward overall trends in these parameters results from this study using data from the declining phase of the solar cycle. All three of these distributions appear towards the lower end of their percentile ranges which is a consequence of a minority of triggers coming from the times of enhanced solar activity at the beginning of the study period. We have chosen not to subtract a median value from each epoch of data before calculating the median in these parameters to be consistent with the analysis of all the other parameters in which we are looking for a threshold effect where absolute values are pertinent to their relative weighting.
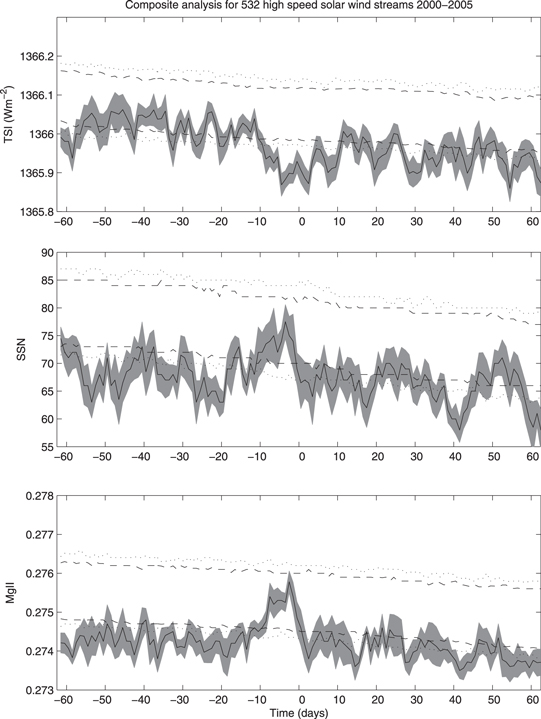
Figure 2. The top panel contains the median total solar irradiance (TSI) measured around the times of the high-speed solar wind streams arriving at Earth. The middle panel contains the median response in sunspot number (SSN). The third panel contains the median response in the Mg II emission.
Download figure:
Standard image High-resolution image4.3. Energetic particles at Earth
Figure 3 presents the response of high energy GCR and lower energy SEP fluxes to the arrival of fast solar wind streams at Earth. The top panel presents the median daily change in cosmic ray flux at Earth, as measured by the Oulu neutron counter. With the approach of the solar wind stream and its associated increase in magnetic shielding, the average GCR flux decreases by 1.4% from around 141 570 counts to a minimum of 139 571 at t = 0. This minimum is significantly outside the 95 and 99 percentiles of the dataset (the dashed and dotted lines, respectively). Before the decrease, the count rates are higher than average (just above the 99 percentile) as was shown to be a persistent feature ahead of CIR s (Rouillard and Lockwood 2007) and demonstrating that the interaction regions are significant depressors of the overall average GCR flux. The decrease starts some 5–10 d before t = 0 and the subsequent recovery to pre-event levels takes around 40 d. This is because the fast/slow solar wind interaction establishes a planar interaction front that is wound into a spiral configuration. Because of the large gyroradius of GCRs in the heliosphere, this can deflect GCRs that would have reached Earth even before it arrives at the Earth (at t < 0), but becomes a more effective shield as it passes over Earth, giving the sudden decline in fluxes seen at t = 0. As the interaction front moves outward GCRs can diffuse into its wake, giving the gradual recovery to pre-event levels that we observe.
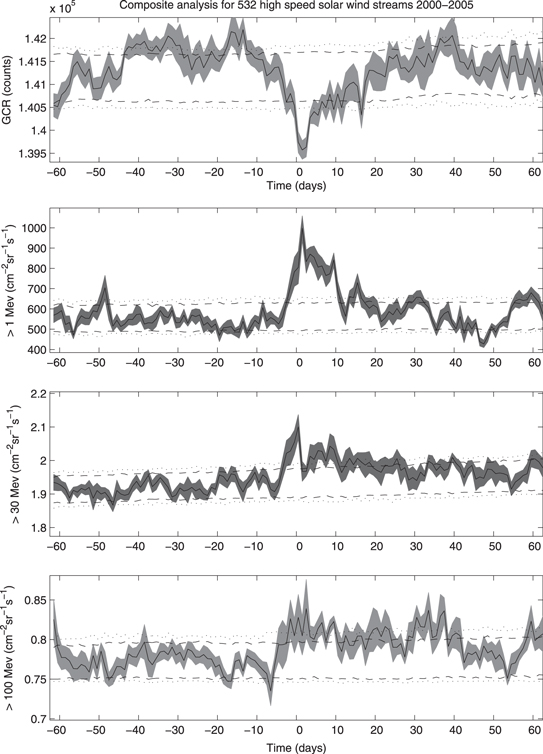
Figure 3. Median response in galactic cosmic ray flux (top panel) as measured by the ground-based neutron monitor at Oulu, Finland. The second, third and fourth panels present median proton flux measurements from the GOES satellite dataset for three energy channels; >1 Mev (top), >30 Mev (middle) and > 100 Mev (lower). The median response in each parameter is represented by a solid line, the standard error in this median as a grey area around the line while the dashed lines and the dotted lines correspond to the 95% and 99% levels of the dataset respectively. These percentile levels were calculated by repeating the analysis many times using random trigger times and determining the levels in each time bin that contained 95 and 99% of the data points.
Download figure:
Standard image High-resolution imageAssociated with the CIRs are enhancements in SEPs. The lower panels presents a selection of energy channels (>1 Mev, > 30 Mev, >100 Mev) measured by the GOES satellites (GOES N Databook 2006). These channels demonstrate the evolution of SEP flux through the observed energy spectrum. There is a doubling in the median proton flux in the lower energy channel (>1 MeV) for 10 d around t = 0, along with subsequent smaller enhancements 27 and 54 d later. Fluxes of protons with energies exceeding 30 Mev (third panel) reveal a 9% increase in particle flux in the 3 d ahead of t = 0, dropping to a level 5% above the pre-trigger levels and decaying from this level over the subsequent 50 d. The highest energy protons (>100 MeV) are once again enhanced over the pre-trigger levels by around 9% and remain elevated for the subsequent 40 d, varying in intensity with a period of 18 d.
4.4. Lightning and thunder days
The top panel of figure 4 presents the median daily response in lightning rates as measured by the ATD system of the UK Met Office. Since the meteorological conditions necessary to produce lightning are not always present, these data are dominated by times for which there was little or no lightning. In order to calculate a meaningful median, these zero values were not included in our calculations by requiring a minimum mean lightning rate of one stroke per hour. This is not unreasonable since it is just recognition of the fact that convective instability must be present for lightning to occur. This reduces the number of data points included in each time bin of the composite analysis to a mean value of 135 ± 2 (of 405 trigger events) with no bin containing fewer than 93 data points, ensuring that any median value is taken from a distribution containing sufficient points that the median would not be influenced by outliers. There is a significant enhancement in median lightning rates starting 10 d before t = 0 compared with median lightning rates from earlier times. This enhanced lightning rate decays back to pre-event levels over the next 50 d. While the lightning rates remain enhanced for many days, there is a variation of around 8 d within these enhanced values and a relatively low response from t = 0 d to t = 5 d. The mean lightning rate for the 40 d before t = 0 is 321 ± 17 while the mean lightning rate for the 40 d after t = 0 is 422 ± 30. A spectral analysis of the daily ATD counts revealed no significant periodicities in the original data.
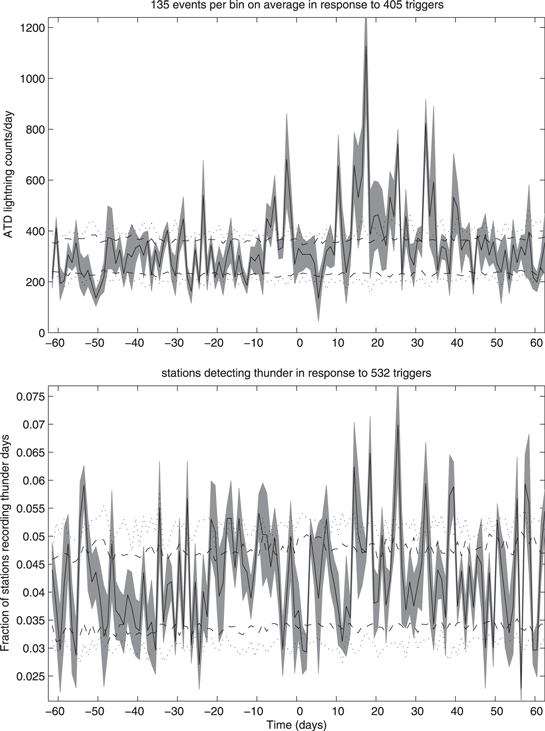
Figure 4. The top panel contains the median daily lightning rate over the UK as measured by the arrival time difference (ATD) system of the UK Met Office, during 2000–2005. The lower panel shows the median response in thunder days recorded at all UK Met Stations scaled by the number of stations making manual measurements each day. The median response in each parameter is represented by a solid line, the standard error in this median as a grey area around the line while the dashed lines and the dotted lines correspond to the 95% and 99% levels of the dataset respectively. These percentile levels were calculated by repeating the analysis many times using random trigger times and determining the levels in each time bin that contained 95 and 99% of the data points.
Download figure:
Standard image High-resolution imageBecause operation of the lightning detection system depends on the propagation properties of the ionosphere, which may also be influenced by the solar changes, we also consider a less sensitive but highly robust measure of thunderstorms, manual acoustic detection of thunder on 'thunder days'. If thunder has been heard by an observer within a 24 h period, a value of 1 is recorded while the absence of thunder over the same period is recorded as 0. Such a binary measurement contains less information than a count of lightning strokes. The advantage of using such data is that it does provide an independent measure of the presence of thunder storms. Since a thunder day is a record of thunder being heard, it is potentially susceptible to other noises, such as explosions or nearby traffic, being wrongly identified as thunder. Such errors are likely to be localized and can be minimized by taking a median value across a number of stations and by setting a threshold to ensure that the results are not dominated by the measurements where little or no lightning is occurring. This threshold was set at 3% of the observed range of values to allow a similar number of (though not necessarily the same) events on average to be recorded as was seen in the daily medians of ATD lightning data (top panel, figure 4). The median fraction of stations on which thunder was heard at around 450 Met stations situated in marine and land locations across the UK is shown in the second panel of figure 4. Since the number of manned stations is expected to have varied throughout the interval being studied, thunder day counts were normalized by the number of stations known to have made manual thunder day observations each day. The number of thunder days after t = 10 is clearly enhanced compared with the number of thunder days prior to t = 10, with an encouraging agreement between the most significant peaks (exceeding the 99th percentile) and the peak lightning rates seen in the ATD data. As the thunder day data effectively records the presence of lightning with sufficient energy to generate audible thunder (Mackerras 1977), it provides an independent measure compared with the radio detection of lightning rates used by the ATD system. The mean fraction of stations recording thunder in the 40 d before t = 0 was 0.0424 ± 0.001 compared with 0.0445 ± 0.002 for the 40 d after t = 0. The significance of the enhancements in lightning and thunder day rates was investigated by conducting Kolmogorov−Smirnov tests on these distributions over 40 d before and after t = 0. This test determines whether the two distributions represent subgroups from the same population or whether they come from statistically distinct distributions. One additional advantage of this test is that it is independent of the shape of the event distribution being investigated. For both the ATD data and the thunder day distributions, values in the 40 d after t = 0 were significantly (to confidence levels >99.9%) different from the distributions of the same parameters in the 40 d before t = 0. Using hourly triggers to identify responses in daily data can result in multiple-selection of response data in a given time bin, effectively weighting the response by the longevity of the solar wind stream. Repeating the analysis for hourly lightning data generates a similar, if noisier, response which passes the KS test at confidence levels far in excess of 99.9%. Such a reanalysis is not possible for the thunder data since it is a daily measurement. There is a sufficiently large number of trigger times within the epoch under consideration that it is highly likely that a small number of lightning data points corresponding to the same trigger time will appear in several time bins of the composite analysis. The top panel of figure 1 shows that while most trigger times are assembled at time = 0, there are a small number of triggers distributed throughout the composite time frame being considered. The fact that the lightning distributions before and after time = 0 pass the Kolmogorov−Smirnov test despite this cross-contamination of points strengthens the statistical significance of this result.
Though the selection of solar wind triggers is independent of any seasonal changes at Earth, they could nevertheless introduce a seasonal bias into the analysis of lightning data if they are not evenly distributed throughout the year. Lightning rates increase dramatically in spring and decline rapidly in autumn. Any bias in the number of trigger events between spring and autumn could therefore potentially introduce a bias throughout the 121 d time period of the superposed epoch analysis. This is indeed the case for the above analysis, with more trigger events occurring in the spring (132) than in the autumn (100) months. In order to investigate the possibility that the observed increase in lightning rates was due to a seasonal bias, we repeated the analysis for triggers occurring during the summer months only and further restricted the selection of triggers to ensure that only one trigger per day could contribute to the analysis. Given that the width of the superposed epoch analysis window is of the order of four months, it would still be possible, despite the restriction in trigger times, for data outside of the summer months to be convolved in the final result. In order to discount this possibility, no data falling outside the summer months were used when calculating the median values in each daily time bin in the restricted superposed epoch analysis. The results of this analysis are presented in figure 5. It can be seen that the responses in both daily lightning and thunder day data are preserved and that the thunder day response is in fact more pronounced. As before, these responses were tested using a Kolmolgorov−Smirnov test to see if the median values for the 40 d either side of t = 0 were drawn from different distributions. Both passed at ≫⃒99.9% (≪⃒0.1% probabilities that these results occurred by chance). The mean values also passed a two sample T-test at 99.1% and ≫⃒99.9% confidence levels (0.9% ≪⃒0.1% that these results occurred by chance) for lightning and thunder data respectively.

Figure 5. Median lightning rates (top panel) and thunder days (lower panel) in response to a restricted set of 36 solar wind trigger occurring during the months of June−August. In order that any seasonal bias does not influence the median values in each time bin of the superposed epoch analysis, all data from times outside this strict seasonal window were excluded before median values were calculated.
Download figure:
Standard image High-resolution image
While these distributions were calculated from a much smaller number of triggers (32), the presence of lightning during the summer months ensured that a high proportion of data in each time bin contained lightning (with a mean of 17.7 ± 0.3).
5. Discussion
Having determined that the arrival of fast solar wind streams at Earth is associated with a subsequent increase in lightning rates, some possible mechanisms can be considered. Figures 4 and 5 present evidence that lightning and thunder rates are enhanced following the passage of an interaction region over similar timescales to the observed depression in GCR fluxes reaching Earth. This appears to contradict the results of earlier studies that have indicated an anti-correlation between sunspots and thunder days (Pinto et al 2013). While sunspots themselves are merely a convenient proxy for solar activity, the mechanism for the observed anti-correlation is thought to be through the modulation of the HMF throughout the solar cycle. At sunspot maximum, the HMF is stronger, providing greater shielding from energetic GCRs at Earth. With GCRs implicated in the triggering of lightning (Roussel-Dupré et al 2008; Gurevich and Zybin 2005), this provides a mechanism by which sunspot number and thunder days would be anti-correlated over solar cycle timescales. In contrast, our study, taken from the declining phase of a single solar cycle, considers the response in lightning rates to the arrival of high-speed solar wind streams at Earth. These co-rotating solar wind streams are associated with a localized enhancement of the HMF and a concomitant drop in GCR flux that ought to, at face value, have the same effect as solar cycle variations. However the physics of these short timescale events is very different. The enhancement of the HMF is at the fast/slow stream interface in the solar wind, resulting in a relatively small (though long-lived) ∼2% decrease in GCR flux. An explanation may be found in the enhancement of lower energy protons of solar origin measured in bands between > 1 Mev and > 100 Mev also associated with these high-speed streams. For those channels with higher energies (>30 Mev) these fluxes are enhanced to around 9% above pre-event levels for 40−50 d after t = 0. Of these, only higher energy particles (>500 Mev) are capable of penetrating the atmosphere far enough to directly modulate atmospheric conductivity in the lower atmosphere (e.g. Calisto et al 2012; Cliver 2006). The evolution in particle distribution seen in the energy channels presented (particle fluxes starting earlier and remaining elevated for longer as the energy threshold increases) is likely to continue beyond the highest detection threshold available on the GOES spacecraft. Furthermore, these particles, being more localized and of lower energies that GCRs, can be significantly deflected by the Earth's magnetic field, modulating their spectrum further. This could explain why the modulation of lightning rates begins before the arrival of the high-speed stream at Earth and peaks between 12 and 18 d afterwards. Particles > 500 Mev have sufficient energies to modulate the atmospheric conductivity above and within thunderclouds though they do not have sufficient energy to be detected at ground level. If these particles are subsequently responsible for the observed modulation in lightning rates it would explain why this result is in apparent contradiction to earlier studies which found an anti-correlation between sunspot number and thunder days. Studies carried out on solar-cycle timescales will be detecting the modulation of GCRs by the HMF. Enhancements of this field during times of high solar activity (large sunspot number) will shield the Earth from GCRs, reducing the rate at which they could trigger lightning. In our study however, the ∼2% decrease in GCR flux is accompanied by a 9% increase in the flux of SEPs, the higher energy flux of which could penetrate the atmosphere far enough to trigger lightning in the same way that GCRs are thought to do (e.g. Gurevich and Karashtin 2013). Indeed, the sharpest drop in GCR flux around t = 0 is accompanied by a relative drop in lightning rates, indicating that the total lightning rate is in fact a convolution of triggering by two distinct populations of particles. While the exact mechanism by which this occurs is still unknown, this study demonstrates that solar wind and atmospheric conditions on these small timescales are very different from the long-term average. It is perhaps not surprising therefore that the response in lightning rates to co-rotating solar wind streams differs from that over a solar cycle.
While a small 27 recurrence can be seen either side of t = 0 in the median response in GCR flux (top panel, figure 3) no such recurrence is apparent in the lightning data (top panel, figure 4). While the arrival times of solar wind streams at Earth can be determined with some precision (figure 1), the subsequent elevation of SEPs lasts for tens of days. If this elevated particle flux is indeed responsible for the observed modulation of lightning rates, any 27 d recurrence would be blurred out in the median values of elevated particle flux and lightning rate.
Some further inferences are possible from the upgrade of the ATD lightning detection system to ATDnet which occurred in 2007 following our analysis period, which led to a much more sensitive lightning detection network for meteorological purposes. The number of lightning strokes detected increased by an order of magnitude, preventing continued detection of the solar wind effects observed between 2000 and 2005. This implies that, in the earlier period considered here, it may have been the magnitude of individual lightning strokes that was increased. Such a shift would bring more lightning strokes above the detection threshold of the ATD system and appear as an increase in the number of strokes. The lack of response in later, more sensitive ATD data is also consistent with a change in the spectrum of lightning magnitude. In the more recent ATD data the detection threshold is much lower, allowing a greater number of smaller lightning strokes to be detected. Without any record of lighting stroke magnitude however, this cannot be tested with the current dataset. A worthwhile future study would be to repeat this analysis using data from a global lightning network such as the World Wide Lightning Location Network (Rodger et al 2005).
It is, however, unlikely that the relatively small changes observed in TSI, SSN and Mg II index (figure 2) could in themselves explain the increased lightning rates through direct modulation of solar irradiance. Furthermore, if irradiance effects were the origin of the changes observed, the much greater variability apparent in these parameters throughout the eleven year solar activity cycle would be expected to modulate the lightning rates over a far greater range than has been observed.
Clearly the existence of suitable weather conditions allowing thunderstorms to form is a pre-requisite for modulation of lightning. The approximately 8 d periodicity seen in peak lightning rates after t = 0 is more comparable with the timescales of weather systems than individual storms though the cause of such a period in our observations remains unexplained. The data presented above does provide evidence that, if weather conditions are suitable to generate active convection and electrified storms, lightning rates appear to be modulated by the SEPs associated with high-speed solar wind streams. Since these high-speed streams co-rotate with the 27 d solar rotation, their arrival at Earth is predictable in advance. This, coupled with an increasing understanding of energetic particle effects on the atmosphere, makes it worthwhile pointing out the potential benefits to forecasting hazardous weather.
Acknowledgements
The authors would like to thank the UK Met Office for use of data from their ATD network and observing stations which were made available via the British Atmospheric Data Centre, the Sodankyla Geophysical Observatory for the use of the Oulu cosmic ray data (http://cosmicrays.oulu.fi), D J McComas (Southwest Research Institute) and N Ness (Bartol Research Institute) for the use of ACE data which were made available via CDAweb (http://cdaweb.gsfc.nasa.gov). The thunder day data were obtained from the Met Office Integrated Data Archiving System (MIDAS) land and marine surface stations (1853-current), made available by the NCAS British Atmospheric Data Centre (http://badc.nerc.ac.uk).