
Abstract
Cropland is crucial for supplying humans with biomass products, above all, food. Globalization has led to soaring volumes of international trade, resulting in strongly increasing distances between the locations where land use takes place and where the products are consumed. Based on a dataset that allows tracing the flows of almost 450 crop and livestock products and consistently allocating them to cropland areas in over 200 nations, we analyze this rapidly growing spatial disconnect between production and consumption for the period from 1986 to 2009. At the global level, land for export production grew rapidly (by about 100 Mha), while land supplying crops for direct domestic use remained virtually unchanged. We show that international trade on average flows from high-yield to low-yield regions: compared to a hypothetical no-trade counterfactual that assumes equal consumption and yield levels, trade lowered global cropland demand by almost 90 Mha in 2008 (3-year mean). An analysis using yield gap data (which quantify the distance of prevailing yields to those attainable through the best currently available production techniques) revealed that differences in land management and in natural endowments contribute almost equally to the yield differences between exporting and importing nations. A comparison of the effect of yield differences between exporting and importing regions with the potential of closing yield gaps suggests that increasing yields holds greater potentials for reducing future cropland demand than increasing and adjusting trade volumes based on differences in current land productivity.
Export citation and abstract BibTeX RIS

Content from this work may be used under the terms of the Creative Commons Attribution 3.0 licence. Any further distribution of this work must maintain attribution to the author(s) and the title of the work, journal citation and DOI.
1. Introduction
While croplands covered only some 12% of the global land area in 2000, they supplied humanity with over 90% of food calories [1]. One half of the overall human biomass appropriation occurs on cropland [2]. Demand for cropland products has increased strongly during the past decades, and this trend is expected to continue as population numbers and per-capita consumption rates are bound to grow [3, 4]. At the global level, cropland area harvested for food production increased by 32% from 1963 to 2005, despite considerable increases in output per unit area [5, 6]. Recent trends in cropland area change differ markedly between world regions: while cropland area has been stable or slightly declining in developed regions and has declined considerably in the former Soviet Union, it has expanded in most other regions, albeit at different rates, with Sub-Saharan Africa, Southeast Asia and Latin America experiencing the fastest growth [1].
Land-use statistics do not indicate whether these changes result from trends in regional consumption levels or from international trade, i.e. are driven by external supply and demand. Trade can enable regions to increase consumption levels without increasing pressure on domestic resources (through imports) or drive cropland expansion unrelated to domestic consumption levels (through exports). Recently, there has been increasing interest in international trade-induced displacement effects linked to the production and consumption of countries and regions. Several studies have investigated displacement of greenhouse gas emissions related to fossil fuel combustion [7–10], and displacement effects related to land use and consumption of land-based products also received increased attention [11–16]. With the growing importance of international trade, the increasing distance of drivers from local land-use decisions and socio-ecological impacts is more and more acknowledged [17–21].
In this study, we analyze global trends in trade-related displacement effects of cropland use from 1986 to 2009. To this end we establish a comprehensive global database that consistently allocates cropland areas in >200 countries to the consumption of almost 450 agricultural products in the same countries, fully accounting for differences in their stages of processing as well as their origin. This dataset goes beyond existing work by providing time-series results as well as in terms of comprehensive coverage and global consistency.
Next to agricultural intensification through optimized local land management [3, 22], the 're-location' of crop production through international trade has also been suggested as a way to reduce land demand and better manage associated natural resources such as water [23–25]. To explore the effect of trade on land demand we use our database to analyze to what extent current trade patterns alter global cropland demand employing a simple no-trade counterfactual. In line with assessments of global water savings [24, 25], this counterfactual assumes that national consumption levels are hypothetically sustained with domestic production and thus domestic cropland yields. For land demand, this comparison indicates, at the global level, to what extent, international trade flows from countries with higher crop yields to countries with lower yields, thereby enhancing the global area efficiency of cropping. However, area-efficiency gains through trade found in such counterfactuals do not imply that international trade reduces global land demand due to feedbacks between production and consumption: for instance, if trade reduced price levels, consumption of agricultural products will increase, especially for products with elastic demand, such as meat or vegetable oils [18].
Yield differences between countries are caused either by differences in natural conditions (climate, soils) or by differences in land management. In order to separate these two effects in relation to international cropland product trade, we repeat the calculation on area-efficiency gains through international trade with present production and trade structures but assuming a global closure of yield gaps, i.e. general application of the best currently available production technologies [22]. These calculations enable us to address questions highly important for sustainably managing future demand for global croplands: Do the yield differences between exporting and importing regions occur due to differences in natural endowment or due to differences in agricultural intensification? How large is the effect of trade on global area efficiency compared to possibilities of improved cropland management? Answers to these questions can inform discussions on how to devise comprehensive supply-side strategies to meet future demand for crop products.
2. Method and data
The aim of this study is to integrate available bilateral trade data and production statistics into a global accounting system that allows to consistently link the consumption of products to the cropland areas on which they are produced, at a country-by-country level. This requires overcoming considerable data limitations and conceptual challenges. Available trade statistics (for example those of the FAO [1]) report trade flows of primary and processed agricultural products in economic and physical terms. They cannot be directly used to quantify cropland requirements associated with trade. The land requirement per unit of traded product depends on the type of product, stage of processing and the origin of the traded goods. These particularities prevent the application of simple multipliers. Therefore we developed a detailed sets of factors that take these differences into account to convert traded products into primary crop equivalents and consequently into cropland requirements. These factor sets have been checked for consistency at the global level to avoid double counting and ensure global balancing3.
Bilateral trade data report the countries of origin where the last valued-adding step in the production chain took place. This poses an additional methodological obstacle as it leads to considerable distortions, if the aim is to link consumption to the locations of crop cultivation (i.e. the beginning of agricultural supply chain).
2.1. The accounting system
Figure 1 visualizes the accounting system used in our study. The left bar (production perspective) shows the domestic production of a nation or region which can be used for domestic consumption or exports. The right-hand side shows the consumption perspective for the same entity: domestic consumption can be either supplied from domestic production or from imports. Note that official statistics can only provide production-perspective totals, all other elements in figure 1 are result of the calculation procedure as outlined here and in figure S1 (available at stacks.iop.org/ERL/9/034015/mmedia). The data underlying the calculations allow for specifying both the destinations of exports and the origin of imports, at the level of nations. We perform our assessments in two basic units: (i) area demand associated with the respective component, expressed in hectares of cropland area harvested per year; and (ii) crop production aggregated into tons of dry matter biomass as common denominator.
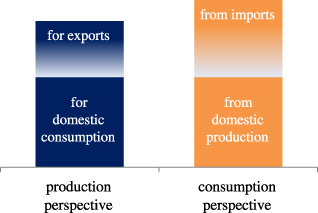
Figure 1. The national-level accounting system used in this study: the domestic production of a nation or region is either used for domestic consumption or for exports. Likewise, the domestic consumption of the same nation or region is either supplied by domestic production or by imports; the difference between the two bars can be interpreted as the net trade balance, in this case net imports. At the global level, the total of the production perspective equal those of the consumption perspective; for details see method section and figure S1 (available at stacks.iop.org/ERL/9/034015/mmedia).
Download figure:
Standard image High-resolution imageThe accounting system presented in figure 1, while conceptually straightforward, warrants a few comments: (i) a major objective of this study was to establish accounts that are consistent at the global level, implying that the area demand as quantified in the global-consumption-perspective totals equals total global area demand according to the production perspective. This ensures consistency at the global level by avoiding double counting or omission of areas (regarding the treatment of waste along the supply chain see the limitation section below). When accounting for land areas, the use of bilateral trade data with specific national yields is crucial, as using global average yields for trade data would lead to inconsistencies. (ii) When aggregating nations into regions, the calculation based on bilateral trade linkages allows distinguishing interregional from intraregional trade flows. Again, this ensures consistency at the global level: the exports from all regions equal the imports of all regions, while the net trade within a region is zero. (iii) Consumption in our approach refers to apparent consumption at the national level (= domestic production plus import minus export). Trade in processed products is included in this account at the level of detail covered in the FAOSTAT trade data [1]. This typically covers products up to a high level of processing, for instance various types of fruit juice, cheese and bread. (iv) Next to products directly derived from crops, our account also includes the cropland feed required for the consumption of animal products. And finally, (v) trade flows of crop products from country A through country B into country C will not show up in our result for country B. This implies our global trade volumes will be lower than simply summing up all reported trade flows, as our approach avoids double counting if the same primary product is traded internationally twice or more often, also if products are processed in the transit country (for details see below and [26]).
2.2. Data
Data are available on annual basis from 1986 to 2009 for over 200 countries. All calculations are performed at the level of individual products and countries, enabling to trace trade flows as well as related cropland areas for almost 450 products through over 200 countries. In this paper, we aggregate the results into eleven regions: North America, Central America and the Caribbean, South America, EU 15+, the Former Soviet Union and other Europe, Sub-Saharan Africa, Northern Africa and Western Asia, Eastern Asia, Southern Asia, Southeast Asia and Oceania. The composition of these regions as well as country-level results are available in the SI (table S2, SI dataset available at stacks.iop.org/ERL/9/034015/mmedia; for detailed crop-specific results, please contact the authors). Our study covers cropland areas for 157 primary crops, excluding planted fodder crops (see SI available at stacks.iop.org/ERL/9/034015/mmedia for details). Table S3 (available at stacks.iop.org/ERL/9/034015/mmedia) list the included primary products. Data on crop production, trade in agricultural products and animal feed data were taken from FAOSTAT [1]; refer to table S1 and the SI (available at stacks.iop.org/ERL/9/034015/mmedia) for details on these data and their handling.
2.3. Calculations
2.3.1. Conversion factors
Production data are converted into tons of dry matter, using standard factors on water contents [2]. Each processed product is assigned to the respective primary product (for instance, soy oil to soybean) and converted into primary equivalents based on factors calculated as the ratio of dry matter content of the processed product and the dry matter content of the primary product. These factors are cross-checked for consistency with so called commodity trees, which give a representation of flows and conversion factors from a primary commodity into various derived processed products [27].
2.3.2. Trade flows and consumption accounts
The trade data were arranged into consistent country by country matrices where each cell corresponds to a trade flow from country A to country B. These matrices are converted into 157 matrices of primary crop equivalents. For these crops, production data are available. The structure of these data allows to apply the procedure described in Kastner et al [26] to arrive at accounts in line with accounting scheme presented in figure 1. The resulting data provide, for each of the 157 crops, a country by country matrix indicating the origin of a country's domestic consumption (columns of the matrix) as well as the destination of a country's production (rows of the matrix). Establishing these consistent accounts relies on the crucial assumption that imports and domestic production of a given crop contribute to the country's domestic consumption and exports in proportional shares. For the more complex treatment of crop products 'embodied' in traded animal products refer to figure S1 and SI (available at stacks.iop.org/ERL/9/034015/mmedia) text.
2.3.3. Area-efficiency gains through international trade
In analogy to the concept of global water savings [24, 25], we calculate the global effect of yield differences between exporting and importing on area efficiency on croplands. To quantify this effect, we compared the area of land that would have been needed to produce a traded item in the importing country (assuming current yields of the respective crop and unchanged consumer preferences; the consequences of this assumption is discussed in the limitation section below) to the land needed to produce the good in the exporting country. We perform this calculation for all countries and crops, based on the country-by-country biomass trade matrices described above. This enables us to assess import yields weighted by the yields of all the sending countries for all crops. To arrive at a value for this area-efficiency effect it is necessary that the receiving countries also produce the respective crop. As this is not always the case (e.g., coffee imports into the European Union), our results only cover a certain fraction of global trade flows in crop products.
Next to performing these calculations with production, yield and trade data for the years 1986–2009, we also assess global land demand and the impact of international trade on area efficiency based on actual production and trade levels but using crop yields attainable through optimizing land management. We perform this calculation for 15 major crops and 155 countries (see table S4 available at stacks.iop.org/ERL/9/034015/mmedia), covering about three quarters of the global cropland area. For these crops, a comprehensive national-level dataset on yields attainable by optimizing nutrient and water management was recently published [22]. If reported national yields are higher than the attainable yields according to [22] we use the yields as reported by FAO. We then calculate area-efficiency gains resulting from international trade as outlined above under this yield assumption. This approach is used to remove (and by this quantify) the management component: persistent efficiency gains under attainable yields can be interpreted as trade flows directed from nations with cropland more suitable for present agricultural practices to nations with less favorable conditions. We present the result for a 3-year mean around 2000 to match the reference year of the attainable yield data.
3. Results
3.1. Global and regional developments 1986–2009
In the last two decades, global cropland area grew on average by 0.5% yr−1. Almost all of this growth resulted from increases in the area of cropland needed to produce internationally traded goods (+2.1% yr−1 on average), whereas cropland directly used for domestic consumption remained almost constant (table 1). In the year 2008, cropland used for exports amounted to over 20% of total global cropland area, which is more than twice the area of North America's entire croplands. More than 80% of the total trade-related cropland area was linked to trade between the 11 world regions distinguished in this letter.
Table 1. Global trends in cropland area and the amounts of cropland associated with international, inter- and intraregional trade. Values are 3-year means around the respective year. Table S5 (available at stacks.iop.org/ERL/9/034015/mmedia) presents the same results for crop products aggregated into dry matter biomass.
| Area harvested (%) | Annual changes rates (%) | |||||
|---|---|---|---|---|---|---|
| 1987 | 1997 | 2008 | 1987–1997 | 1997–2008 | 1987–2008 | |
| Global cropland area (Mha |
1172 | 1217 | 1321 | 0.4 | 0.7 | 0.5 |
| For domestic use | 995 | 1012 | 1049 | 0.2 | 0.3 | 0.3 |
| For export | 178 | 205 | 272 | 1.4 | 2.6 | 2.1 |
| Interregional trade |
153 | 157 | 211 | 0.3 | 3.1 | 1.8 |
| Intraregional trade |
25 | 48 | 52 | 6.8 | 0.8 | 3.6 |
| Global population (Mio capita) | 5030 | 5887 | 6740 | 1.6 | 1.2 | 1.4 |
a1 Mha = 1 millionhectares = 104 km2 = 1010 m2. bDiscerning 11 world regions (see section 2).
The numbers on global net changes do not reveal the much larger dynamics in individual world regions (figure 2). North America's croplands were large suppliers of cropland products to the world market throughout the study period, with relatively little dynamics over time. Central America and the Caribbean were characterized by greatly increasing dependencies on croplands outside their own territories. In South America, use of cropland for exports more than doubled in the second decade of the study period, while land linked to domestic consumption remained relatively stable. The EU 15+ region experienced a slight decline of domestic cropland, while land associated with consumption remained stable at considerably higher levels, indicating increasing reliance on croplands outside its own territory. The Former Soviet Union and other Europe saw abandonment of croplands in the first decade after the collapse of the Soviet Union in 1991. Since the turn of the century, croplands remained relatively stable. During the study period, the region changed from a 'net importer' of cropland to a 'net exporter'. Sub-Saharan Africa saw a fast increase in cropland area of just below 60 Mha which was largely used for domestic consumption. Cropland areas related to trade were balanced and played only a minor role.
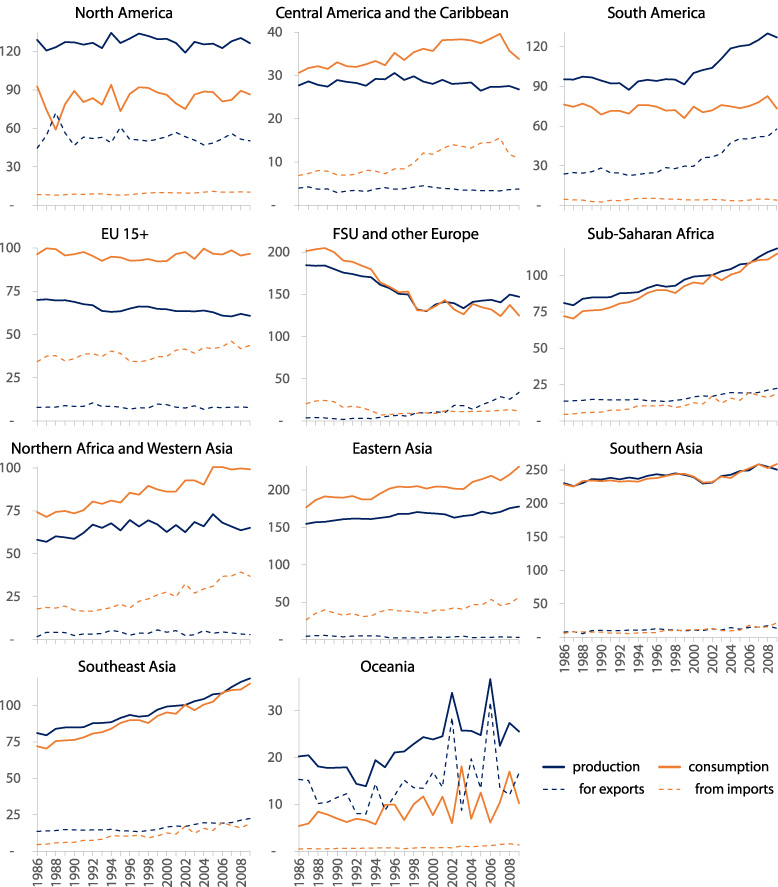
Figure 2. Regional trends in cropland area under production and areas associated with consumption and import and export flows, following the accounting scheme in figure 1 for the period 1986–2009. Values in million hectares of cropland harvested per year, trade flows reflect interregional trade only. Note the different scales of the y-axes. Figure S2 (available at stacks.iop.org/ERL/9/034015/mmedia) presents the same graphs for crop products aggregated in terms of dry matter biomass.
Download figure:
Standard image High-resolution imageThe region of Northern Africa and Western Asia depended strongly, and increasingly, on cropland outside its own territory. Increases in 'cropland imports' were considerably larger than the expansion of domestic cropland. The same holds true for Eastern Asia, where cropland associated with imports amounted to 56 Mha in 2009. In Southern Asia cropland also expanded; here the influence of trade was minimal and balanced in terms of cropland area. Southeast Asia experienced a rapid expansion of cropland required for its domestic consumption, as well as domestic cropland area. In that region cropland area linked to trade was considerable but imports and exports were balanced; in 2009 they amounted to almost 20% of production (for exports) and consumption (from imports), with imports growing faster than exports during the study period. For Oceania, figure 2 reveals that the region is an exporter of cropland area, with large annual fluctuations and cropland used for exports is typically in the same range as cropland used for domestic consumption.
Figure 3 presents maps of the main global interregional trade linkages in terms of the associated cropland areas for the beginning and the end of the study period (3-year means around 1987 and 2008, respectively). The color of a region indicates its self-sufficiency rate, expressed as the ratio of land under crop production to land linked to consumption of crop products; the arrows in figure 3 show the interregional trade flows associated with >4 Mha of cropland. In general, figure 3 reveals increasing self-sufficiency values for net exporters and decreasing values for net importers, an indication for growing global interdependencies.
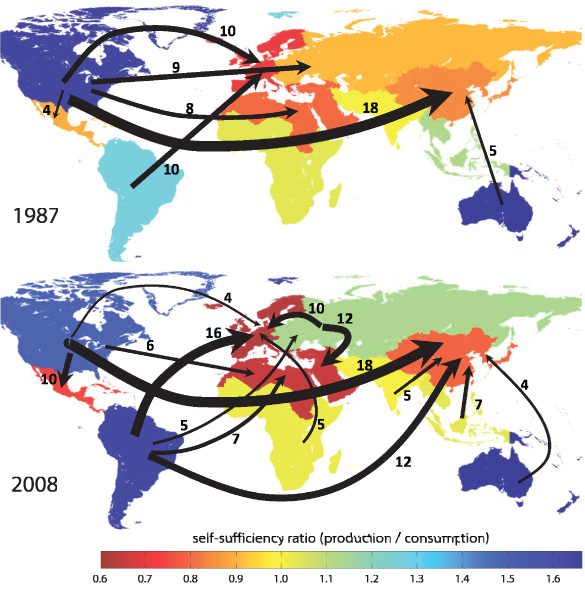
Figure 3. Croplands associated with interregional trade; the color of the regions shows rates of self-sufficiency (production/consumption). Values in million hectares of cropland harvested per year; flows larger than 4 Mha are shown. The flows shown account for respectively 44% (1987) and 58% (2008) of the total area related to interregional trade. Values are 3-year means around the respective year. Figure S3 (available at stacks.iop.org/ERL/9/034015/mmedia) presents the same picture for crop products aggregated in terms of dry matter biomass.
Download figure:
Standard image High-resolution imageCroplands associated with interregional trade were dominated by Northern America as main exporter in 1987 (figure 3). The picture was more diverse in 2008 where South America emerged as another main exporting region and considerable export flows also came from the FSU and other Europe region as well as Oceania and Southeast Asia. Major importing regions were Eastern Asia, the EU 15+ and Northern Africa and Western Asia. While these regions diversified the sources of their main suppliers of crop products and the related cropland demand, Central America and the Caribbean increased their imports mainly from only one source region, Northern America. Regional yield differences influence the patterns of croplands linked to trade compared the patterns of traded cropland products (figure 3 compared to figure S3 available at stacks.iop.org/ERL/9/034015/mmedia). For instance, owing to high domestic yields, the EU 15+ relies to a larger extent on outside cropland areas than its biomass trade volumes would suggest. In contrast, Sub-Saharan Africa's trade is balanced in terms of cropland underlying trade flows, while the region is increasingly a net importer in terms of crop products (figure S2 available at stacks.iop.org/ERL/9/034015/mmedia); the reason being low domestic yields compared to the import yields.
3.2. The effect of crop product trade on global area efficiency
Trade-induced area-efficiency gains are estimated by calculating how much land would have been needed to meet global demand based only on domestic production, i.e. assuming domestic yields. This calculation yields a cropland demand significantly larger than the actual global extent of cropland (table 2, 7% in 2008). The numbers reveal that presently crop product trade flows from nations with higher yields to nations with lower yields: in 2008, yields of importers were, on average, 30% lower than those of exporters. The absolute magnitude of this effect almost doubled during the two decades covered in this study, from 43 to 88 Mha yr−1. In addition, table 2 reveals that such an approach can cover just over two thirds of the cropland area linked to international trade. The other third is comprised of crops that are not grown in the importing country.
Table 2. Effect of area-efficiency gains resulting from international trade of cropland products; values in million hectares of cropland harvested per year (3-year means around the respective year); note that the results shown in figures 2 and 3 include both (b) and (c).
| 1987 | 1997 | 2008 | |
|---|---|---|---|
| (a) Cropland associated with internationally traded products | 178 | 205 | 272 |
| (b) Cropland associated with crops that are not grown in the importing countries (e.g. coffee, bananas) | 58 | 67 | 67 |
| (c) Cropland associated with crops that are grown in the importing countries (a minus b) | 120 | 144 | 206 |
| (d) Cropland demand for (c) assuming domestic yields for imports (no-trade counterfactual) | 162 | 191 | 294 |
| (e) Effect of area-efficiency gains resulting from international trade (d minus c) | 42 | 54 | 88 |
Figure 4 compares the magnitude of global-area-efficiency gains resulting from international trade with the land demand reduction potential of raising cropland yields to a level attainable through available management techniques, as defined in [22]. To this end, we present cropland demand for four cases: (i) in the year 2000, the 15 crops included in the calculation (details see method section) covered 829 Mha. (ii) The result of the no-trade counterfactual for these 15 crops is 8% or 67 Mha higher and indicates that the prevailing trade structure increased the area efficiency of land use. (iii) Assuming the trade pattern prevailing in 2000 and (hypothetically) that all countries would reach attainable yield levels reduces global cropland demand to 539 Mha, implying a reduction of 35% compared to case (i). (iv) Finally, a case with both counterfactuals combined (attainable yields and no-trade) results in a reduction of cropland area to 563 Mha (−32% compared to the year 2000 value). This thought experiment shows that even with the highest currently attainable yields, trade would flow from countries with higher yields to countries with lower yields, but the overall effect would be much smaller (4%, or half of the effect) compared to the case with the yields recorded in 2000.

Figure 4. Global cropland demand for 15 major crops for four cases. The dark bar shows the situation in 2000, the light bars represent hypothetical cases: the left bar shows the cropland demand assuming year 2000 yield and consumption levels, but no international trade; the center-right bar shows cropland demand assuming attainable yields but no trade at year 2000 consumption levels and the rightmost bar represents cropland demand under year 2000 trade and consumption structure, assuming attainable yields in all nations. Yield potentials were taken from [22]. Values in million hectares of cropland area harvested.
Download figure:
Standard image High-resolution image
4. Discussion
4.1. Global cropland area for export production is growing rapidly
Our results show large and increasing differences between domestic cropland areas and the croplands on which the products consumed in any country or region were produced. On the one hand, trade can even out differences in resource endowment (in terms of land suitable for cropping) and, for certain regions, help to allow population densities larger than those that would prevail if these regions would have to rely solely on domestic supply. Cities supported by their hinterlands [19] are an obvious case in point, but the pattern gains importance also for entire countries or even regions, as our results reveal. On the other hand, trade can also be a means to sustain affluent lifestyles of wealthy nations, while reducing negative environmental impacts of crop production on their own territories, allowing them to shift burdens elsewhere [11, 12]. Both developments warrant that policies affecting national consumption levels of land-based products increasingly have to consider distant impacts caused by this consumption.
Consumption-based accounts of carbon emissions from fossil fuels typically find developed regions to be the main beneficiaries of imports [8, 9]. Our assessment of land demand and trade related to cropland products gives less clear-cut results: while the European Union is a major importer of crop products and, to an even higher amount, of associated cropland area, Northern America was the most important supplier throughout the study period.
Demand for crop products grew throughout all regions, with highest growth rates in developing regions (figure S2 available at stacks.iop.org/ERL/9/034015/mmedia). Recent price spikes in agricultural commodities underlined the vulnerability of many poor and malnourished in regions depending on products from the world market [28]. For instance, in our results the food price crises of 2007 and 2008 appears to have led to declining crop product consumption (and cropland demand) in Central America and the Caribbean, South America and to a lesser extent also in Sub-Saharan Africa (figure S2 available at stacks.iop.org/ERL/9/034015/mmedia and figure 2). The case of South America is particularly interesting as area for export production continued to increase while area for domestic consumption declined. For a comprehensive analysis of the effect of the crisis on global agricultural trade and cropland demand the time series would have to be extended for a few more years, which is not possible with presently available data.
The growing importance of bioenergy, which is up to now often directly derived from food crops, might aggravate the situation. If the EUs biofuel targets could only be met by increasing imports of biomass products, this would have impacts on the global food market. And while the impact of the US corn ethanol program on international demand for land resources remains contested [29, 30], our results show that areas linked to crop exports from North America decreased to all regions with one exception (Central America and the Caribbean). At the same time, South America rapidly emerged as second-largest global supplier of cropland products. This region hosts the largest remaining tropical forest area and experiences high rates of deforestation. As croplands associated with domestic consumption remained stable during the study period, our results indicate that a large fraction of the cropland expansion in this region was export-driven. A recent study suggested that trade constitutes a central driver for deforestation and loss in ecosystem carbon in the region [31].
4.2. Trade flows and crop yields
The number of major interregional trade flows depicted in figure 3 doubled from 1987 to 2008, suggesting that interdependencies between regions increased considerably during the two decades. As demand for crop products is likely to increase in the coming decades [3, 32], international trade has been suggested as an option to limit global demand for land resources by concentrating production in regions with higher land productivity [23, 25]. Our thought experiment on the impact of international trade on global area efficiency reveals that trade currently flows, on average, from high-yield countries to low-yield countries. This effect was substantial: in 2008, global cropland demand would have been 84 Mha (table 2) larger if all products grown in the recipient countries would have been grown domestically (refer to the limitation section below for limitations and caveats to be kept in mind when interpreting this number).
Agricultural intensification through optimized land management and reallocation of global fertilizer resources is a central supply-side option for addressing increased demand for crop products [3, 22]. Our results (figure 4) show that the potential to reduce land demand by closing yield gaps with available production techniques is substantially larger than the hypothetical land savings achieved through international trade. This exercise also shows that if all nations were to reach yields attainable with present technologies, trade would still flow from countries with higher yields to countries with lower yields, but the quantity would be considerably smaller. These numbers imply that differences in natural endowment account for only half of the effect of international trade on global area efficiency. The other half is explained by differences in the level of agricultural intensification, indicated by the distance of present yields from attainable yields. At the global level, yield gaps in importing regions are larger than in exporting regions. Figure 4 can be read as indication that optimizing local crop management in terms of area efficiency represents a more promising strategy than shifting production between regions. The former strategy would also help poor importing regions to increase their self-sufficiency in terms of crop products, making them less vulnerable to global market fluctuations and might—due to the large yield gaps of many developing regions—also be environmentally attractive [3].
4.3. Limitations of the study and the underlying datasets
Our results show that global trade of agricultural products flows, on average, from nations with higher yields to nations with lower yields. This finding does not necessarily imply that land demand would be higher in a 'no-trade world:' levels of consumption as well as yields depend on trade patterns. For instance, the no-trade counterfactual (figure 4) would imply considerable cropland expansion on lands with limited suitability for cropping (figure S4 and SI available at stacks.iop.org/ERL/9/034015/mmedia text), as limits of land availability would be reached faster without international trade. In addition, about one third of the cropland area associated with trade could not be included in the calculation of area-efficiency gains (table 2) because these products are not grown locally. Hence, trade can enable consumption of products that would otherwise not be available at all, thereby increasing global demand for these products. However, the net effect will depend on the extent to which these products replace other products (and their land demand).
Increased production efficiencies (be it, in our case, through changing trade patterns or through closing of yield gaps) may increase overall demand. This effect has been denoted as 'rebound effect' and is well documented for energy use [33, 34], but have recently also been discussed for land use [18, 35]. This implies that, in order to keep global cropland expansion in check, supply-side measures as discussed in this paper may have to be complemented by demand-side measures. Despite the huge potentials to contribute to GHG mitigation through reduced land demand, such demand-side measures are difficult to implement [36] and large-scale success stories are lacking to this date.
A number of important caveats relate to the use of global-level datasets. We largely rely on FAOSTAT data, which provide the only consistent global-level database for this line of research. While these data in general match national statistics, reliability and robustness issues persist, especially in developing countries. However, FAO's commodity balance model [37] enables for consistency checks in terms of production, trade and food availability and should prevent large-scale errors and inconsistencies. The second part of our study relies of global estimates on crop yield gaps, which only consider nutrient and water application as management components [22]. The management component includes, however, a much wider variety of factors (e.g., weed and pest control) not captured in that study. Additionally, closing yield gaps may not be the top priority for farmers under many circumstances (as compared to, for instance, optimizing profits or minimizing labor efforts). If limiting global cropland demand were an important policy goal, actions addressing such local realities would be required and both global and local studies are needed to address scale mismatches. Finally, the actual quantities of persisting yield gaps are a matter of debate, which is also linked to inherent uncertainty when applying a measure developed at the farm level [38] for global-level analyses. For a comprehensive overview on the usefulness and the limitations of the yield gap approach at different scales refer to [39] (also includes a discussion of the global dataset [22] used in this study).
A necessary simplification of our study refers to the fact that we assume the same national average crop yields for both exports and direct domestic consumption. This is due to the inexistence of comprehensive subnational data differentiating areas for export production and a common assumption in similar studies (e.g., [6, 11, 12, 25]). However, this might lead to distortions if areas for export production have vastly different characteristics than overall country totals, for instance, if they are farmed more intensively and exhibit higher yields. A comprehensive global assessment of how export areas differ from overall national averages would be a worthwhile effort, but might be difficult to achieve for any country where most agricultural produce (both for domestic use and for export) passes through common markets.
Recently, interest in the amount of biomass waste generated along agricultural supply chains has been growing [40, 41]. In this context, it is important to note that the presented consumption-perspective accounts aim to include global totals of cropland and primary crops and assign them to consuming nations. The amount of biomass actually consumed will be lower due to wastes along supply chains as well as due to conversion losses (above all, through animal products). A follow-up study could look into ratios of actual consumption (e.g. expressed as food calories or as bioenergy supplied) to demand for primary crops and cropland to allow for statements on differences and trends in resource-use efficiencies of biomass supply chains.
The SI (available at stacks.iop.org/ERL/9/034015/mmedia) text compiles a number of additional, more technical, limitations and caveats along with a comparison of some of our results to existing studies.
5. Conclusions
Global trade flows forge increasingly closer ties between nations around the globe. Our results for croplands linked to agricultural products suggest that international trade has led to a rapidly increasing disconnect between trajectories of land under production and trajectories of land associated with national consumption: cropland for export production grew rapidly from 1986 to 2009, while cropland supplying crops for direct domestic use remained virtually constant. Accounts like the one presented in this paper enable localizing the global land-use impacts of national and regional consumption patterns. Such accounts can form a valuable starting point for comprehensive global assessments of international leakage effects related to ecosystem carbon flows, in line with existing assessments for fossil fuel emissions and to identify the largest potential for limiting impacts both on the production and on the demand side. Our study also reveals that, at the global level, exporting nations have higher yield levels than importing regions, which can only partly be explained by differences in natural endowment. A large part of these yield differences can be attributed to differences in land management and agricultural intensification, with importing nations exhibiting, on average, larger yield gaps than exporting nations. Efforts to close yield gaps, while keeping negative environmental consequences in check, appear to be more a promising supply-side strategy than hoping for reductions of land demand from increased international trade.
Acknowledgments
We gratefully acknowledge funding from European Commission (EU-FP7 projects 265104 VOLANTE, 266642 EJOLT and ERC Grant 236522 LUISE), and the Austrian Science Fund (FWF), project P20812-G11, the Austrian Academy of Sciences as well as the provision program of the Austrian Federal Ministry of Science. This research contributes to the Global Land Project (www.globallandproject.org/).
Footnotes
- 3
Approaches using multi-regional input–output analysis (MRIO; e.g., [12]) also ensure consistent balancing at the global level. However, such datasets are typically not available in time-series format; moreover, recent research [15] suggests considerable differences between MRIO and approaches such as that followed here, warranting exploration of multiple methods until these divergences have been resolved.