
Abstract
A new rainfall framework is constructed to describe the complex probability distribution of southeastern United States (SE US) summer (June–July–August) rainfall, which cannot be well represented by traditional kernel fitting methods. The new framework is based on the configuration of a three-cluster finite normal mixture model and is realized by Bayesian inference and a Markov Chain Monte Carlo (MCMC) algorithm. The three rainfall clusters reflect the probability distribution of light, moderate, and heavy rainfall in summer, and are linked to different climate factors. The variation of light rainfall intensity is likely associated with the combined effects of La Niña and the tri-pole sea surface temperature anomaly (SSTA) over the North Atlantic. Heavy rainfall concurs with a 'horseshoe-like' SSTA over the North Atlantic. In contrast, moderate rainfall is less correlated with the SSTA and likely caused by atmospheric internal dynamics. Rainfall characteristics and their linkages with SSTAs help improve seasonal predictions of regional climate. Such a new framework has an important implication in understanding the response of regional hydrology to climate variability and climate change; and our study suggest that it can be extended to other regions and seasons with similar climate.
Export citation and abstract BibTeX RIS

Content from this work may be used under the terms of the Creative Commons Attribution 3.0 licence. Any further distribution of this work must maintain attribution to the author(s) and the title of the work, journal citation and DOI.
1. Introduction
The importance of warm season precipitation on the southeastern (SE) United States (US) agriculture, ecology, and economy has been well recognized (e.g. Riha et al 1996, Manuel 2008, Martinez et al 2009). Extensive efforts have been made to understand the underlying physical controls of seasonal mean precipitation (e.g. Seager et al 2009, Wang et al 2010, Li et al 2011, 2012).
While the total amount of rainfall is important in shaping the regional hydrology, high-impact climate events are more associated with the tail behavior of the rainfall distributions (e.g. Katz and Brown 1992). Thus, comprehensively assessing the climatic impact of SE US summer rainfall requires the knowledge of a complete summer rainfall spectrum. Furthermore, a better knowledge of the complete spectrum of rainfall behavior and its linkage with climate factors could potentially improve the seasonal prediction of SE US summer rainfall.
Obtaining such a goal depends on accurate construction of rainfall probability density functions. This is usually realized by fitting proposed distributions to observed precipitation. Previous studies have proposed many distributions to fit precipitation, such as Log-Normal (Cho et al 2004), gamma (Wilks 1990, Becker et al 2009), and Weibull (Duan et al 1998). However, the kernels2 of these distributions are 'uni-modal', which may not accurately represent the 'multi-modal'3 features of SE US summer rainfall (figures 1(a) and S1, available at stacks.iop.org/ERL/8/044017/mmedia). Figure 1(b) compares the percentages of those summers with uni-modal, bi-modal and multi-modal rainfall probability density features, respectively. In the period 1949–2010, the number of years with multiple modes in rainfall PDFs is significantly greater than those with 'uni-modal' PDFs (figure 1(b)). Thus, a more general probability framework that can overcome the limitation of distribution shapes is needed to understand the complete spectrum of SE US summer rainfall.
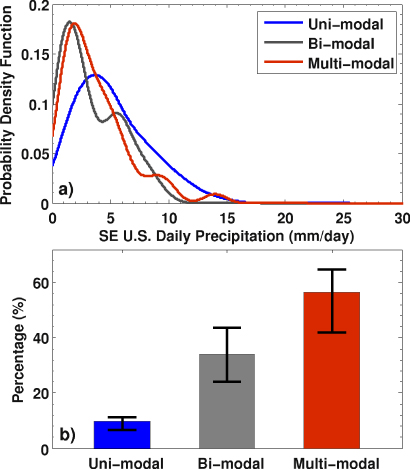
Figure 1. (a) Empirical probability density functions (PDFs) of SE US summer rainfall with typical uni-modal (blue curve), bi-modal (gray curve), and multi-modal (red curve) features; and (b) the percentage of summers with a rainfall probability density showing uni-modal (blue bar), bi-modal (gray bar), and multi-modal (red bar) features. In (a), the empirical PDFs are calculated using the Gaussian kernel density estimator, the bandwidth of which is chosen by implementing Silverman's rule-of-thumb. The modality of the distribution is assessed according to the number of local maxima in empirical rainfall PDFs. The error bars denote the uncertainty range of the identified number of modes, which is introduced by the choice of smoothing kernels and the bandwidth of kernel density estimators.
Download figure:
Standard image High-resolution imageThe aim of this study is to (1) construct a new probability framework that can accurately represent the 'multi-modal' features and thus the complete spectrum of SE US summer rainfall distribution; (2) explore the possible linkages between climate factors and the complete spectrum of rainfall distribution; and (3) assess the potential predictability skill according to these linkages.
The rest of the letter is organized as follows. In section 2, the new statistical framework and the Markov Chain Monte Carlo (MCMC) algorithm are described. The complete spectrum of SE US summer rainfall is described in section 3. Section 4 discusses the linkage between the probability behavior of SE US summer rainfall and climate signals. Concluding remarks are presented in section 5.
2. Finite Normal mixture model as a new framework for SE US summer rainfall
In this study, the statistical behavior of SE US daily rainfall during 1949–2010 summers (defined as June–July–August (JJA) here) is analyzed. The JJA rainfall is of interest in this study because the precipitation in the summer is generally higher than in the other seasons over the region, and also because precipitation in the southeast contributes significantly to both the mean and variation of warm season rainfall over the continental US (Wang et al 2010). The rainfall data come from the Climate Prediction Center (CPC) Unified Daily Precipitation Archive (Higgins et al 2000). The daily precipitation is averaged over the terrestrial SE US (91° W–76° W, 25° N–36.5° N) to characterize the sub-continental scale features and associated climate factors (Li et al 2013).
To describe the probability distribution of SE US summer rainfall, a three-cluster finite Normal mixture model is constructed. The advantage of the Normal mixture model lies in its flexibility of distribution shapes, because any smoothed distribution can be approximated by a combination of a finite number of Normals. This characteristic of the Normal mixture model is especially important for SE US summer rainfall due to its ability to represent the multi-modal feature of rainfall distribution (figures 1 and S1).
When constructing finite Normal mixture models, choosing the optimal number of clusters is difficult and sometimes controversial (e.g. Richardson and Green 1997, McLachlan and Peel 2000, Melnykov and Maitra 2010). Generally, adding more clusters to the mixture model could better approximate the true distribution of rainfall. However, an unlimited increase in clusters increases the risk of over-fitting (Lin et al 2007), blurs the physical meanings of each cluster, and hampers the interpretation of mechanisms that control the rainfall probability distribution. In this study, a three-cluster Normal mixture is constructed to physically represent light, moderate, and heavy rainfall according to the American Meteorological Society (2013).
The 'goodness of fit' of the constructed three-cluster Normal mixture model is shown in figure 2. In this 2009 summer example, the constructed finite Normal mixture model outperforms traditionally used distribution kernels (Gamma, Exponential, Weibull, etc) in describing the probability distribution of SE US summer rainfall, especially its ability to capture the 'multi-modal' features of the rainfall distribution4 (figure 2). We also test the 'goodness of fit' of the four models using rainfall samples from the remaining 61 summers. For 94% of the summers, the Normal mixture model better describes the probability behavior of SE US summer precipitation than the other three models. The results suggest that the new probability framework based on this three-cluster Normal mixture model has advantages over traditional methods, and could thus substantially improve the understanding of regional hydroclimate over the SE US.

Figure 2. Probability distribution of SE US daily precipitation (mm d−1) in 2009 summer (red curve), and those constructed using the three-cluster Normal mixture model (black curve), and the Gamma (blue crossed curve), Exponential (dark blue curve), and Weibull (dark blue dashed curve) distributions, respectively.
Download figure:
Standard image High-resolution imageThe three-cluster finite Normal mixture model takes the mathematical form:
where π is the weight of rainfall clusters, μ is the cluster mean, and ϕ is the precision of Normal distributions. h∈(1,2,3) is the cluster index.
To obtain the distribution parameters (π,μ, and ϕ) in the mixture model, Bayesian statistical inference is implemented. The priors about π,μ, and ϕ are as follows:


In equation (3), κ is the degree of freedom, and the Gamma(ϕh|αh,βh) is parameterized to have mean αh/βh and variance  . The parameters in the priors (equations (2)–(3)) are assigned according to the definitions of light, moderate, and heavy rainfall (American Meteorological Society 2013)5, and are kept weakly informative to incorporate more data information into the posterior distribution: a1 = 0.50,a2 = 0.35,a3 = 0.15,μ0h = (1.0,8.0,20.0),κh = (1,1,1),αh = (1.0,1.0,0.4), and βh = (1.0,1.0,1.0).
Since the priors (equations (2)–(3)) and the likelihood model (equation (1)) are semi-conjugate, the full conditional posterior distributions can be derived analytically (Gelfand 2000). The Gibbs sampler for posterior computation using the MCMC algorithm is as follows:

where  ;
;  ;
;  ; and
; and  . Here,
  denotes the number of samples in cluster h, and
  is the sample mean of cluster h.

In this study, the MCMC algorithm (equations (4)–(6)) is applied to daily rainfall in each summer during 1949–2010. Since heavy rainfall intensity is always stronger than moderate rainfall and light rainfall, this physical constraint is placed upon μh (μ1 < μ2 < μ3) to deal with label switching issues (Stephens 2000). The MCMC algorithm is run 1000 times and the first 200 samples are discarded.
3. Bayesian inference on summer rainfall intensity over the SE US
The parameters describing the SE US summer rainfall distribution can be obtained from equations (4)–(6). From a climate perspective, the intensity of light, moderate, and heavy rainfall (described by μ in this study) is of primary concern (e.g. Higgins et al 2007). Thus, the remainder of the letter focuses on the interannual variation of μ.
Figure 3 shows the interannual variation of μ for the three rainfall clusters. The 62-year climatology is about 2.5 mm d−1 for light rainfall, 6.2 mm d−1 for moderate rainfall, and 12.3 mm d−1 for heavy rainfall, respectively. Since constrains are applied on μ, no overlapping of sampled μ between rainfall clusters is observed in the MCMC algorithm (figure 3).

Figure 3. Interannual variation of μ in each SE US summer rainfall cluster: light rainfall (gray solid curve), moderate rainfall (black dashed curve), and heavy rainfall (blue solid curve) cluster. The x-axis is the year from 1949–2010; and the y-axis is the precipitation rate (mm d−1). The red dots represent the maximum likelihood estimator (MLE) of μ sampled from full conditional posterior distributions (equations (4)–(6)). The error bars denote one standard deviation of the sampled μ.
Download figure:
Standard image High-resolution imageThe sampling uncertainty about μ from the MCMC algorithm is also calculated (Hoff 2009). Confidence about the light rainfall intensity is the highest among all three clusters (figure 3), because nearly 60% of the rainfall cases fall into that cluster. With a relatively larger sample size, the variance ( ) of the cluster mean (μ1) decreases, reducing its uncertainty. In contrast, the heavy rainfall cluster has the least rainfall samples, and thus the cluster mean μ3 usually shows larger uncertainty compared to μ1 and μ2 (figure 3). During 1949–2010, the sampling uncertainty almost reaches the magnitude of interannual variability of the heavy rainfall. Thus, the results regarding the heavy rainfall intensity should be interpreted with caution.
4. Linkage between the complete spectra of SE US summer rainfall and climate variability signals
Previous studies have suggested that global climate modes could change large-scale circulation patterns, alter the synoptic-scale systems, and thus influence daily rainfall. In the US, the occurrence and severity of droughts and floods are usually linked to climate factors such as the El Nino–Southern Oscillation (ENSO) (e.g. Gershunov and Cayan 2003) , the Pacific Decadal Oscillation (PDO) (e.g. Higgins et al 2007), the Atlantic Multi-decadal Oscillation (AMO) (e.g. Curtis 2008), and anthropogenic forcing (e.g. Kunkel et al 2003, Villarini et al 2013). The linkage between the SE US summer rainfall intensity in each cluster and climate factors is analyzed by regressing sea surface temperature anomaly (SSTA) upon sampled μ (figure 3). Establishing such linkages could provide insights for seasonal prediction of SE US summer rainfall6.
Figure 4 shows the precedent and synchronized SSTA regressed upon the μ of the three rainfall clusters. Light rainfall intensity in summer can be derived from the SSTA signals four months ahead (February–March–April (FMA)) over the tropical Pacific and the North Atlantic (figures 4(a)–(f)). The regressed FMA SSTA shows a negative signal over the eastern tropical Pacific (figure 4(b)), indicating a potential development of La Niña events. At the same time, a zonally oriented tri-pole SSTA pattern is observed over the North Atlantic, with positive SSTA over the subtropical basin surrounded by negative SSTAs over the tropical and mid-latitude Atlantic (figure 4(b)). During the following months, the SSTA patterns associated with light rainfall intensity are characterized by a gradually developing La Niña event, with negative SSTA expanding over the eastern tropical Pacific (figures 4(c)–(f)), consistent with previous work (e.g. Mo et al 2009, Wang et al 2010). Over the North Atlantic, the tri-pole SSTA remains until the JJA season (figures 4(c)–(f)). Overall, the developing La Niña combined with the North Atlantic tri-pole SSTA provides a potential source of predictability for SE US light rainfall intensity.
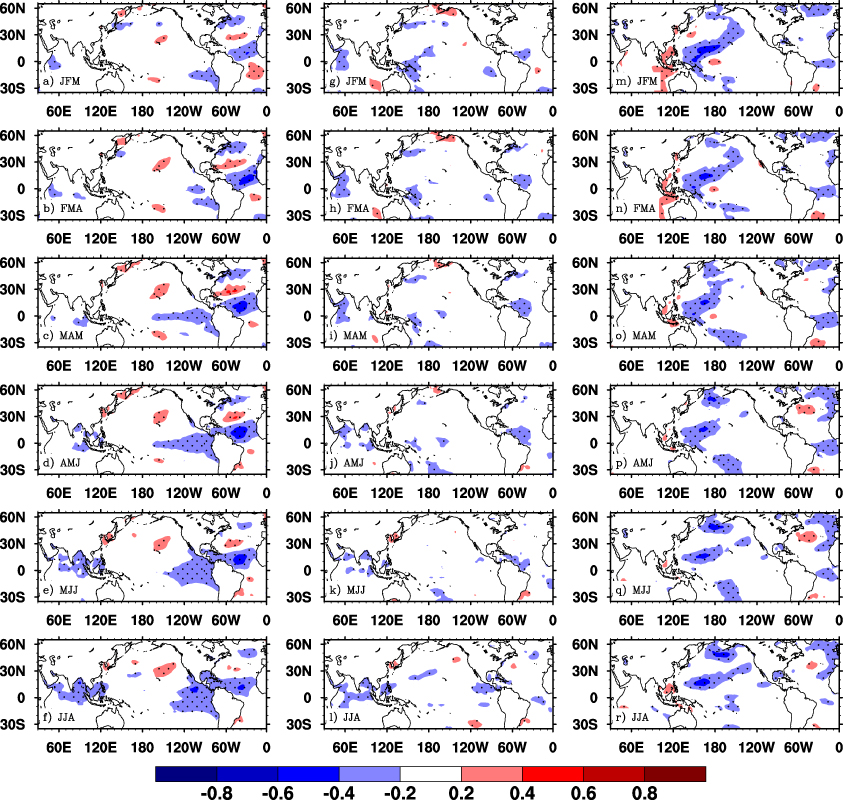
Figure 4. Global SSTA (shaded; unit: normalized; dimensionless) regressed upon rainfall intensity (μ) in each cluster. SSTA significant at α = 0.05 level by 1000-time Monte Carlo simulation is stippled. From top to bottom, panels are regressed SSTA during January–February–March (JFM), February–March–April (FMA), March–April–May (MAM), April–May–June (AMJ), May–June–July (MJJ), and June–July–August (JJA) seasons. The left column is SSTA regressed upon light rainfall intensity (a)–(f); the middle column is SSTA regressed upon moderate rainfall intensity (g)–(l); and the right column is SSTA regressed upon light rainfall intensity (m)–(r).
Download figure:
Standard image High-resolution imageSimilar to the light rainfall, heavy rainfall intensity over the SE US also shows a linkage with a 'horseshoe-like' SSTA pattern over the North Atlantic, i.e., positive SSTA over the subtropical gyre surrounded by negative SSTAs (figures 4(p)–(r)). Such a SSTA pattern and the seasonal evolution of the overlaying atmospheric circulation (figure S2, available at stacks.iop.org/ERL/8/044017/mmedia) bear an imprint of an extra-tropical air–sea interaction during warm seasons (e.g. Kushnir et al 2002, Hu and Huang 2006). A significant 'horseshoe-like' SSTA (α = 0.05 level by 1000-trail Monte Carlo test) appears in April–May–June (AMJ), indicating that heavy rainfall intensity can be predicted from this 'horseshoe-like' SSTA two months in advance (figure 4(p)).
Concurring with the 'horseshoe-like' SSTA pattern, an anomalously high sea level pressure (SLP) is located off the US eastern coast (figure S2(d)). The influence of this anomalously high pressure on the SE US heavy rainfall might be twofold. First, the anomalously high pressure and SSTA-associated large-scale circulation anomalies—including an intensification of the Caribbean low-level jet; the intrusion of high latitude cold air by the anomalous northwesterly wind (figure S3, available at stacks.iop.org/ERL/8/044017/mmedia); and the anomalous 200 hPa trough over the US continent and ridge over the ocean (figure S4, available at stacks.iop.org/ERL/8/044017/mmedia)—provide favorable atmospheric conditions to sustain heavy rainfall over the SE US (Konrad 1997, Cook and Vizy 2010, Li et al 2012).
In addition, the high pressure off the US eastern coast (figure S2(d)) may contribute to SE US heavy rainfall by regulating Atlantic hurricane movement (Kossin et al 2010). Previous studies suggested that the anomalously high SLP pattern similar to that in figure S3(d) tends to lead the Atlantic hurricanes to move westward and make landfall over the SE US (Wang et al 2011, Colbert and Soden 2012). Since landfalling hurricanes contribute to a large portion of extreme rainfall events over the SE US (especially the coastal areas) during warm seasons (Konrad and Perry 2010, Barlow 2011, Kunkel et al 2012, Prat and Nelson 2013) the large-scale circulation pattern associated with the 'horseshoe-like' SSTA over the North Atlantic likely favors hurricane landfall and enhances the extreme rainfall over the SE US (figure S2(d)).
In contrast to both the light and heavy rainfall, the moderate rainfall cannot be easily inferred from SSTA signals. No significant and systematic SSTA pattern is discernable during either synchronized or precedent seasons (figures 4(g)–(l)), indicating that moderate rainfall may not result from direct SSTA forcing. Instead, its intensity might be regulated by atmospheric internal variability, similar to Seager et al (2009). In the 850 hPa geopotential height field, a wave-train pattern can be observed during JJA: negative (positive) geopotential height anomalies tend to occur over the SE US (off the eastern coast) during years with abnormally strong moderate rainfall (figure 5(b)). Such a circulation pattern intensifies the southerly wind over the SE US, which amplifies moisture convergence to sustain large-scale summer rainfall (Li et al 2013). Given the relatively short memory of the atmosphere, such circulation patterns hardly generate predictive skill for moderate rainfall intensity.
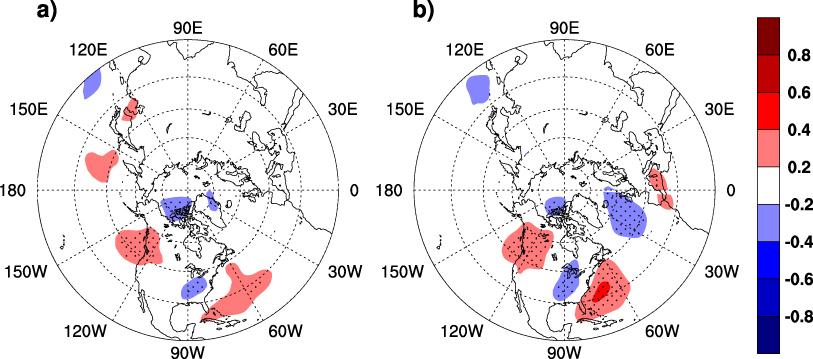
Figure 5. (a) MJJ and (b) JJA 850 hPa geopotential height anomaly (shaded; units: normalized, dimensionless) regressed upon SE US moderate rainfall intensity. Geopotential height anomalies significant at the α = 0.05 level by 1000-time Monte Carlo simulation are stippled.
Download figure:
Standard image High-resolution imageThis analysis indicates that the predictive skill of SE US summer rainfall differs among the three rainfall clusters. The light rainfall intensity can be predictable given the knowledge of a La Niña developing phase and a tri-pole SSTA over North Atlantic four months in advance. In addition, certain predication skills of heavy rainfall intensity can be developed from the SSTAs over the extra-tropical North Atlantic. It is noteworthy, however, that large sampling uncertainty exists about the heavy rainfall intensity. Therefore, the linkage between the North Atlantic SSTA and SE US heavy rainfall obtained in this study should be interpreted with caution. In contrast, seasonal prediction of the moderate rainfall intensity remains challenging due to its lack of connection with SSTAs over adjacent oceans.
5. Discussion and concluding remarks
Knowledge of the complete spectrum of SE US summer rainfall is highly desired in order to understand the impact of climate variability/change on regional hydrology, ecology and agriculture. Such a need, however, is hampered by the lack of accurate statistical inference, due to the limitation of traditional kernel fitting methods (e.g. Katz et al 2002, Panorska et al 2007), which fail to capture the 'multi-modal' features of SE US summer rainfall (figures 1 and S1).
To overcome this limitation, a new framework is constructed based on a three-cluster finite Normal mixture model to describe the complete spectrum of SE US summer rainfall. Compared to traditional probability models (Gamma, Log-Normal, and Weibull, etc), the Normal mixture model better captures the behavior of SE US summer rainfall (figure 2). Thus, this new rainfall framework improves the statistical inference of SE US summer rainfall, which can help in appropriately assessing climate impact on regional hydrology, ecology, agriculture, etc.
The configuration of the framework is realized by Bayesian inference and a MCMC algorithm. In our framework, the three-cluster Normal mixture model reflects a comprehensive spectrum of SE US summer rainfall by synthesizing the probability distribution of light, moderate, and heavy rainfall (American Meteorological Society 2013). It is found that the majority (∼60%) of SE US summertime daily rainfall events fall into the light rainfall cluster, while the heavy rainfall cluster receives the least rainfall samples. Given the disproportionate sample size in each rainfall cluster, the Bayesian inference shows highest (lowest) confidence in the light (heavy) rainfall behavior.
The cluster specified statistics (i.e., cluster mean in this study) of SE US summer rainfall are found to correspond to different climate factors. Our study suggests that the variation of light rainfall intensity is likely associated with the combined effects of La Niña developing phases over the tropical Pacific and a tri-pole SSTA pattern over the North Atlantic. These SSTA signals emerge in a precedent spring season, which leads summer (JJA) by four months. In addition, the heavy rainfall cluster also shows a relationship with the North Atlantic SSTA. Stronger than normal heavy rainfall concurs with a 'horseshoe-like' SSTA pattern, reflecting the typical extra-tropical air–sea interaction pattern (Kushnir et al 2002, Hu and Huang 2006). In contrast, the interannual variation of moderate rainfall correlates less with the SSTA and is probably generated by atmospheric internal variability.
Our analysis links the complete spectrum of SE US summer rainfall to climate factors, which has implications for seasonal prediction of regional climate given the above-mentioned SSTA–rainfall relationships. The study suggests that this new rainfall framework can be extended to other similar regions/seasons as a convenient tool for regional climate analysis and climate impact assessment.
Acknowledgments
The authors thank Drs David Dunson, David Bank, and Qiuhong Tang for helpful discussion; Mr Patrick T Brown for help with data analysis and editorial assistance; and two anonymous reviewers and a Board member for insightful comments. This work is supported by the NSF Grant AGS-1147608.
Footnotes
- 2
The distribution kernel is a reduced form of the probability density (mass) function in which any factor that does not contain the variables is omitted. For example, the Normal distribution has the kernel function
 ; and the gamma distribution kernel takes the form p(x|α,β2) ∝ xα−1e−βx.
 - 3
The mode of a probability density function (PDF) is where the probability density attains a local maximum. The number of modes is thus identified as the number of local maxima in the probability density curve. The PDF curves with one mode are defined as 'uni-modal'; while those with more than one mode are 'multi-modal' distributions. The empirical PDFs are calculated using a Gaussian kernel density estimator, the bandwidth of which is chosen by implementing Silverman's rule-of-thumb. It is noteworthy that the choice of smoothing kernels and the degree of smoothing can introduce uncertainty in the mode identification processes. The error bars in figure 1(b) denote such uncertainties.
- 4
The probability distribution curves as shown in figure 2 are calculated using a posterior predictive. The posterior predictive is calculated as Pr(y) = ∫L(y|θ)P(θ)dθ, where L(y|θ) is likelihood model, and P(θ) is the posterior distribution.
- 5
According to the AMS glossary, light rainfall lies in the range of 0–6 mm d−1. The ranges of moderate and heavy rainfall are 6–18 mm d−1 and >18 mm d−1, respectively.
- 6
The SST data used in this study is NOAA extended reconstructed SST (ERSST) Version 3 (Smith et al 2008).