
Abstract
We compared planktonic primary and secondary production across twenty meltwater ponds on the surface of the McMurdo Ice Shelf in January 2007, including some ponds with basal brines created by meromictic stratification. Primary production ranged from 1.07 to 65.72 mgC m−3 h−1 in surface waters. In stratified ponds primary production was always more than ten times higher in basal brines than in the corresponding mixolimnion. Regression tree analysis (r2 = 0.80) identified inorganic nitrogen (as  ) as the main factor limiting planktonic primary production. However, there was also evidence of inorganic carbon co-limitation of photosynthesis in some of the more oligotrophic waters. Neither C nor N limited carbon fixation at [NH4–N] > 50 mg m−3, with photoinhibition the factor most likely limiting photosynthesis under such conditions. Primary production was the only factor significantly correlated to bacterial production and the relationship (r2 = 0.56) was non-linear. Nitrogen limitation and tight coupling of planktonic primary and bacterial production is surprising in these ponds, as all have large pools of dissolved organic carbon (1.2–260 g m−3) and organic nitrogen (all >130 mg m−3). The dissolved pools of organic carbon and nitrogen appear to be recalcitrant and bacterial production to be constrained by limited release of labile organics from phytoplankton.
Export citation and abstract BibTeX RIS

Content from this work may be used under the terms of the Creative Commons Attribution 3.0 licence. Any further distribution of this work must maintain attribution to the author(s) and the title of the work, journal citation and DOI.
1. Introduction
The McMurdo Ice Shelf (MIS) is a small part of the Ross Ice Shelf, located in the WSW corner of the Ross Sea (figure 1). The MIS is an unusual ice shelf in that parts of its surface are covered with marine-derived sediments, in an undulating terrain that supports a variety of meltwater ponds. This property derives from adfreezing of seawater beneath the ice shelf (Debenham 1920), during which process marine sediments (and organisms) are incorporated into the ice, which then slowly migrate to the ice surface as the surface ice ablates (Swithinbank 1970, Gow and Epstein 1972). The density of debris varies, depending on the velocity of the ice, giving rise to two types of ice shelf surface topography, the 'pinnacle ice' and the 'undulating ice' (Howard-Williams et al 1989). Pinnacle ice is highly dynamic, with thin patches of sediment, ephemeral meltwater channels and pools forming amongst ice mounds with a relief of 1–2 m. Undulating ice is, in contrast, slow moving, being topographically constrained between Bratina Island and Brown Peninsula, and has a rolling surface relief of approximately 10 m, with most of the surface covered by >100 mm of sediment. The undulating ice carries an array of sediment-lined, long-lived meltwater ponds of a few 10's to 100's of square metres, lying between rounded mounds of ice-cored sediment (Hawes et al 2008).
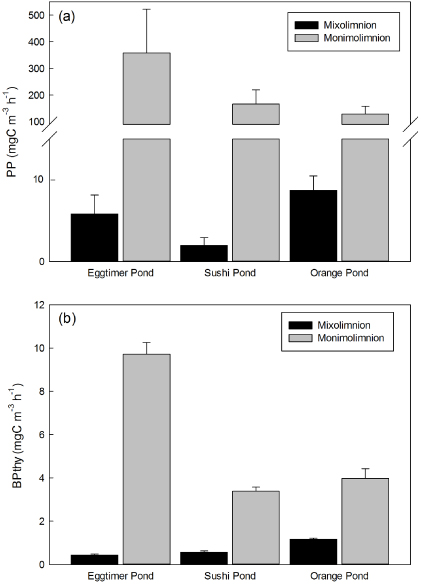
Figure 1. Comparison of (a) primary production and (b) secondary production (measured as BPthy) between layers of meromictically stratified ponds. Mean values with standard deviations (n = 4).
Download figure:
Standard image High-resolution imageIn an environment where the availability of liquid water is the major factor restricting life, the array of meltwater ponds on the MIS supports highly diverse microbial communities. Important to the high biodiversity value of these ponds are the wide range of size, degree of ice cover and chemistries that have evolved in different ponds (Howard-Williams et al 1989, Hawes et al 1993), and the seasonal changes in ambient conditions (Hawes et al 2011a, 2011b). In many cases habitat diversity is enhanced by persistent stratification with an upper, relatively fresh layer overlying basal brines established through freeze-concentration of salts during autumnal freezing (Wait et al 2006, Hawes et al 2011a). Across the spectrum of meltwater ponds on the MIS, well developed, species-rich microbial mats tend to dominate pond biogeochemical processes (Suren 1990, Hawes et al 1993, Quesada et al 2008, Hawes et al 2011b). Benthic dominance does not, however, preclude the development of a species-rich plankton, dominated by bacteria, flagellates and ciliates, often associated with the saline basal layers (James et al 1995, Hawes et al 1997, Safi et al 2012).
Controls on the activity of the plankton are poorly understood. There is little evidence to suggest top-down control by grazing (Safi et al 2012) and limitation by low nitrogen flux to the ponds has been suggested (Howard-Williams and Hawes 2007). Phytoplankton also appears to suffer photoinhibition in the relatively bright, 24 h daylight environment, perhaps exacerbated by the effects of low temperature (Rae et al 2000). Controls on bacterial production are even less well understood. In ice-based systems allochthonous sources of labile organic carbon are minimal and we might expect planktonic photosynthesis and bacterial production tightly coupled, as in other freshwater communities where autochthonous production dominates (Kirchman 1993, Fouilland and Mostajir 2010).
The goal of this contribution is to determine the factors controlling planktonic populations of algae and bacteria in the meltwater ponds of the MIS. To do this we have adopted a comparative approach, measuring primary and secondary production across the salinity and nutrient ranges of meltwater ponds during summer, including the concentrated monimolimnetic brines. Specifically, the hypotheses that have guided this research are that:
- (i)rates of primary and secondary production are tightly coupled within the planktonic community,
- (ii)brines are important foci of primary and secondary planktonic production; and
- (iii)because of coupling between primary and secondary production, both will be limited by the supply of inorganic nutrients.
In order to test these hypotheses, we have compared classification and regression tree (CART) analysis and multiple linear regression to explore gradients in production along nutrient gradients in twenty discrete ponds and three brines. A secondary aim of the study was to compare the applicability of these two approaches in analysing datasets with the non-linear relationships and multiple interacting factors that are often a feature of field production studies.
2. Study area and experimental design
The McMurdo Ice Shelf is a 1500 km2 ablation region, with a covering of moraine and marine sediment supporting extensive areas of melt water during summer (Swithinbank 1970). Immediately south of Bratina Island (78°00'S,165°35'E) is an area of sediment-covered ice supporting numerous discrete, sediment-lined meltwater ponds with lifetimes of several decades, that vary in size from tens to hundreds of square metres (Howard-Williams et al 1989, Hawes et al 2011a). The site contains ponds with a wide variation in water chemistry, due to localized salt lenses, sea water intrusions and pond ages, allowing biological comparisons across environmental gradients untainted by significant geographical variation. Permanent daylight, mild temperatures and high photosynthetic activity result in high pH values in many ponds during the summer open water period.
The study was carried out in late January 2007, at the time of maximum ice melt and peak summer temperatures (5.0–8.5 ° C). We selected twenty ponds ranging from dilute, fresh water (0.1 mS cm−1) to highly saline (>60 mS cm−1) for production comparisons (table 1). Most of these ponds (all local unofficial names) have been described and mapped in various previous studies (Howard-Williams et al 1989, Wait et al 2009, Hawes et al 2011a). Stratification was examined by profiling from the shore, using a combined temperature/conductivity probe suspended from a 4 m long telescopic aluminum probe. At the time of our study three ponds (Orange, Eggtimer and Sushi Ponds) showed meromictic stratification; the remainder had fully mixed water columns. The experimental design was therefore based on a comparison of the 20 ponds plus a comparison of surface and brine layers in the three stratified ponds. Two ponds (Duet Pond and Permanent Ice Pond) retained extensive surface ice with 1–2 m-wide thawed moats, but the remainder were fully ice-free at the time of sampling.
Table 1. Physicochemical variables of all ponds studied, and of the monimolimnion brines of the three meromictically stratified ponds.
| Pond | Conductivity (mS cm−1) | DRP (mg m−3) | NH4–N (mg m−3) | NO3–N (mg m−3) | TDN (mg m−3) | TDP (mg m−3) | Chl a (mg m−3) | DOC (g m−3) | pH | DIC (mol m−3) |
|---|---|---|---|---|---|---|---|---|---|---|
| Surface mixolimnion | ||||||||||
| Duet | 0.1 | 41 | <1 | <1 | 136 | 49 | 0.9 | 1.2 | 9.8 | 0.2 |
| Permanent ice | 0.2 | 19 | 2 | 2 | 133 | 28 | 1.1 | 7.9 | 10.2 | 0.3 |
| Fogghorne | 0.7 | 0 | 8 | <1 | 496 | 17 | 0.6 | 8.1 | 9.7 | 2.2 |
| Skua | 0.7 | 107 | 10 | 2 | 441 | 133 | 2.3 | 9.4 | 8.4 | 0.9 |
| Sushi | 0.9 | <1 | 9 | 1 | 754 | 11 | 0.5 | 10.0 | 9.1 | 1.8 |
| Fresh | 1.1 | 81 | 4 | 6 | 381 | 106 | 1.0 | 6.4 | 7.6 | 0.9 |
| K081 | 1.1 | 74 | 7 | <1 | 517 | 102 | 1.3 | 7.4 | 7.9 | 0.9 |
| Casten | 1.4 | 183 | 11 | 2 | 743 | 233 | 4.3 | 9.8 | 9.0 | 2.3 |
| Dosli | 2.1 | 41 | 31 | <1 | 1 520 | 116 | 1.8 | 17.6 | 9.8 | 0.4 |
| Legin | 3.1 | 3 | 15 | 2 | 899 | 33 | 1.6 | 13.3 | 9.0 | 1.6 |
| Orange | 3.3 | 7 | 55 | 7 | 2 130 | 102 | 1.5 | 21.0 | 9.6 | 6.4 |
| Pond 2 | 3.7 | 386 | 9 | 7 | 908 | 456 | 3.0 | n.d. | 8.4 | 2.8 |
| Eggtimer | 4.1 | <1 | 5 | <1 | 818 | 24 | 0.7 | 12.8 | 9.2 | 3.9 |
| Howard | 4.4 | 66 | 7 | 4 | 220 | 81 | 0.6 | 1.6 | 9.2 | 0.5 |
| Huey | 6.4 | <1 | 59 | 40 | 2 010 | 47 | 8.4 | 21.8 | 10.1 | 2.1 |
| P70 | 6.4 | 13 | 5 | <1 | 1 950 | 73 | 1.0 | 26.2 | 9.6 | 2.7 |
| Pond 3 | 7.0 | 21 | 49 | 1 | 3 580 | 147 | 4.7 | 61.1 | 9.7 | 11.1 |
| Upper | 8.4 | 76 | 41 | 1 | 3 340 | 258 | 8.4 | 23.7 | 9.9 | 7.4 |
| P70E | 9.3 | <1 | 2 | 11 | 1 040 | 24 | 1.2 | 11.9 | 8.7 | 2.0 |
| VXE6 | 10 | <1 | 19 | 2 | 1 800 | 41 | 1.9 | 19.9 | 8.8 | 1.8 |
| Brack | 20 | 3 | 14 | 7 | 4 430 | 230 | 7.3 | 20.1 | 10.0 | 2.9 |
| Salt | 66 | 26 | 111 | 5 | 18 430 | 892 | 37.2 | 236.0 | 9.8 | 7.9 |
| Monimolimnion brines | ||||||||||
| Eggtimer brine | 92.9 | <1 | 270 | <1 | 24 760 | 455 | 363.0 | 406.0 | 8.5 | 92.9 |
| Orange brine | 48.0 | 180 | 601 | <1 | 38 660 | 1560 | 111.7 | 640.0 | 9.2 | 108.9 |
| Sushi brine | 14.2 | 23 | 260 | <1 | 1 560 | 340 | 27.9 | n.d. | 9.3 | 55.6 |
Surface waters were collected by hand from the shore, as far from the edge as possible. For the stratified ponds we used a pulley attached to a line stretched across each pond to lower a weighted, acid rinsed, 5 mm diameter plastic hose into the brine, extracting the liquid with a hand-operated vacuum pump. Production assays involved incubations and were carried out under common conditions (see below) rather than in situ for in each pond, to exclude the effects of localized differences in light and temperature. During the summer melt period, the light and temperature regimes are in any case relatively similar in most ponds (see Hawes et al 2011a, 2011b, Safi et al 2012).
3. Methods
3.1. Water chemistry
All water for experiments and analysis was collected in acid-washed polyethylene bottles. The pH was measured immediately upon collection with a Mettler portable pH meter, calibrated using standard buffers, and temperature and conductivity measured with a C-90 conductivity–temperature meter (TPS Ltd, Springwood, Australia), calibrated using a two-point procedure against air and a conductivity standard.
We measured dissolved inorganic carbon (DIC) on 0.5 or 1.0 ml samples injected into pre-washed, partially evacuated 4 ml vacutainers containing 0.2 ml of 10% phosphoric acid. Headspace subsamples were subsequently analysed on a LiCor infrared gas analyser, calibrated with standard solutions of sodium bicarbonate. Samples for total dissolved organic carbon (DOC) were filtered through a pre-combusted GF/F filter and stored, unfrozen, in pre-combusted brown glass bottles for return to New Zealand. Analysis was as described by Hawes et al (2011b). For estimating planktonic chlorophyll a (chl a), we filtered samples onto Whatman GF/F filters which were stored frozen for return to New Zealand. Dissolved nitrogen and phosphorus species were determined on the filtrate, which was also frozen. Methods for nutrient and chlorophyll analysis were as described by Hawes et al (2011b).
3.2. Phytoplankton photosynthetic activity
Planktonic photosynthesis (PP) was measured on 10 ml of freshly collected pond water in glass vials (n = 4), to which 10 μCi of 14C-labelled bicarbonate was added (Amersham International Ltd). The vials were incubated for 24 h in a common outdoor water bath at 6 ° C under ambient daylight, with dark controls for each wrapped in foil and incubated simultaneously. At the end of incubations, 0.2 ml of 10% HCl was added to preserve the sample and remove unfixed inorganic carbon. To test the efficacy of HCl, we also ran acidified control vials in parallel to our experimental vials, which confirmed complete removal of inorganic 14C. Less than 3% of the added 14C was assimilated in all incubations, confirming that DIC depletion was not an issue during these experiments. Vials were counted and photosynthetic rates calculated after return to New Zealand as described by Hawes et al (2011b).
3.3. Bacterial activity
Bacterial production (BP) was measured from parallel 3H-thymidine (BPthy) and 3H-leucine (BPleu) incorporations (Kirchman et al 1985, Kirchman and Ducklow 1993, Bell 1993) on 10 ml pond water samples. Quadruplicate samples and two killed controls (0.5 ml filtered (0.2 μm) formalin, pH 7.0) were incubated at 6 ° C with 24 nmol l−1 radiotracer over 2, 4, 12 and 20 h and stopped with 0.5 ml formalin. Time courses showed linearity until 12 h; hence all rates were based on the 4 h incubations. After return to New Zealand, vials were centrifuged at 16 000 g for 7 min, washed and counted in Optiphase HiSafe (Wallac) scintillation cocktail, as described by Hawes et al (2011b). Thymidine and leucine uptake were converted to carbon fixation rates using the equations and conversion factors of Kirchman (1993) and Kirchman and Ducklow (1993).
3.4. Data analysis
We compared multiple linear regression and regression tree analyses in exploring factors controlling variation in PP and BP in the pond environment. Correlations and multiple linear regression (using stepwise forward regression and a significance level for each variable of P = 0.05) were conducted with variables transformed to meet assumptions of normality. CART analysis is particularly suited to data with non-linear relationships and where there are many variables with large numbers of potential interactions (De'Ath and Fabricius 2000, Forbes et al 2008). They do not require data to be normally distributed or homoscedastic, as they rank continuous variables and partition data recursively into subsets that reveal the hierarchy of which factors are most important among interacting variables (Qian et al 2003, Scott et al 2008). Regression tree models were generated by cross-validation, running a series of 50, ten-fold cross-validations, and then pruning the tree to achieve the smallest tree size with an estimated error rate within one standard error of the minimum (Breiman et al 1984). All analyses were performed in JMP 10.0 for Windows 7 (SAS Institute Inc., Cary, NC).
4. Results
4.1. Pond chemistry and metabolic rates
Water chemistry parameters in the ponds varied up to three orders of magnitude, with the most saline ponds more than 60 times higher in conductivity, 135 times higher in TDN, and 200 times higher in TDP and DOC, than the most dilute (table 1). Both inorganic nitrogen and phosphorus values ranged from below detection limits to >100 mg m−3. Inorganic nitrogen was consistently low compared with TDN, reaching a maximum of 5%, and was mainly present as ammonium rather than nitrate. 70% of ponds had a chlorophyll biomass of <2 mg m−3, with an overall range of 0.5–37.2 mg m−3. Conductivity and nutrients were also high in the monimolimnetic brines of the three stratified ponds, and these also had high chlorophyll biomass, and accumulated high concentrations of DOC and nutrients compared with the mixolimnions of the same ponds, or the mixed water column in any of the other ponds.
All waters sampled had high pH (>8.4) with values over pH 10.0 in some cases, but in general pH did not differ greatly and pH of brines was similar to pH of mixed surface layers. In contrast, there was a wide range in DIC, from 0.2 mol m−3 in the more oligotrophic ponds, to high concentrations (up to 7.9 mol m−3) in some of the more nutrient-rich ponds. Brines were rich in inorganic carbon, with DIC in the brine in Orange Pond as high as 109 mol m−3, 17 times higher than its mixolimnion.
PP ranged from 1.07 mgC m−3 h−1 in Duet Pond, to 65.72 mgC m−3 h−1 in Salt Pond (table 2), but was even higher in the brines (figure 1(a)). PP rates in all three brines were higher than in any of the mixed pond waters, and were 61, 84 and 14 times higher in Eggtimer, Orange and Sushi Pond brines than in the corresponding mixolimnions. Specific assimilation rates of phytoplankton were more uniform, with mean values ranging from 0.83 to 5.97 mgC mg−1 chl h−1, most of the variation in volumetric rates therefore resulting from differences in algal biomass between ponds. Notably, the specific assimilation rates of the brines were well within the range of the surface waters (0.99, 1.15 and 5.97 mgC mg−1 chl h−1 in Sushi, Orange and Eggtimer brines).
Table 2. Photosynthetic and bacterial production rates of 20 study ponds. Mean values (n = 4) with SD in brackets.
| Pond | Photosynthesis (mgC m−3 h−1) | Photosynthesis (mgC mg−1 chl h−1) | Bacterial production thymidine method (mgC m−3 h−1) | Bacterial production leucine method (mgC m−3 h−1) |
|---|---|---|---|---|
| Duet | 1.07 (0.43) | 1.18 (0.48) | 0.08 (0.01) | 0.03 (0.01) |
| Permanent ice | 1.30 (0.31) | 1.18 (0.29) | 0.11 (0.01) | 0.28 (0.05) |
| Fogghorne | 2.59 (0.85) | 4.32 (1.41) | 0.46 (0.02) | 1.27 (0.21) |
| Skua | 3.64 (1.18) | 1.58 (0.51) | 0.68 (0.03) | 1.00 (0.66) |
| Fresh | 2.44 (0.99) | 2.44 (0.99) | 0.60 (0.02) | 1.96 (0.36) |
| K081 | 2.85 (0.42) | 2.19 (0.32) | 0.57 (0.07) | 1.13 (0.14) |
| Casten | 11.49 (3.75) | 2.67 (0.87) | 1.53 (0.12) | 1.48 (0.10) |
| Dosli | 1.53 (1.13) | 0.85 (0.63) | 0.17 (0.03) | 0.54 (0.16) |
| Legin | 2.13 (1.28) | 1.33 (0.80) | 0.46 (0.03) | 0.92 (0.39) |
| Orange | 8.71 (1.76) | 5.81 (3.87) | 1.15 (0.18) | 1.60 (0.50) |
| Pond 2 | 8.66 (2.57) | 2.89 (0.86) | 0.48 (0.03) | 1.66 (0.17) |
| Howard | 1.71 (0.21) | 2.85 (0.36) | 0.28 (0.01) | 1.06 (0.07) |
| Huey | 15.90 (2.40) | 1.89 (0.29) | 0.60 (0.04) | 1.50 (0.03) |
| P70 | 2.09 (0.54) | 2.09 (0.54) | 0.30 (0.01) | 0.87 (0.13) |
| Pond 3 | 5.79 (1.40) | 1.23 (0.29) | 0.75 (0.06) | 1.39 (0.13) |
| Upper | 16.08 (6.01) | 1.92 (0.72) | 1.07 (0.40) | 2.22 (0.24) |
| P70E | 2.76 (0.87) | 2.30 (0.73) | 0.36 (0.02) | 0.85 (0.13) |
| VXE6 | 4.38 (3.43) | 2.30 (1.81) | 0.74 (0.05) | 2.13 (0.16) |
| Brack | 6.05 (2.80) | 0.83 (0.38) | 1.42 (0.06) | 2.08 (0.38) |
| Salt | 65.72 (29.47) | 1.77 (0.79) | 1.66 (0.17) | 3.14 (0.43) |
BP rates also differed between mixed surface waters of ponds (table 2), but rates were lower and within a narrower range (0.08–1.66 mgC m−3 h−1 for BPthy, 0.03–3.14 mgC m−3 h−1 for BPleu) than photosynthesis. Thymidine and leucine methods correlated well (r2 = 0.64,P < 0.0001), but BPleu rates were slightly higher than BPthy with an overall Leu:T ratio of 1.26 (t-test t =− 6.87,P < 0.0001). BPthy in the brines was more than twice as high as any of the surface waters and within-pond comparisons (figure 1(b)) showed large differences between layers in individual ponds, although not as large as differences in photosynthesis.
Several chemical and biological variables were strongly correlated (table 3). The conductivity gradient that guided pond selection was reflected in other chemical variables, with many significant positive correlations between conductivity, TDN and TDP, ammonium, DOC and DIC as shown in table 3. Conductivity, TDN, TDP, ammonium and DIC were all strongly associated with chlorophyll, which in turn was well correlated to PP. DIC was the single variable most strongly correlated to PP (r = 0.917). BPthy was associated with ammonium, DIC and PP, whereas BPleu correlated only to BPthy and not to other variables. Three variables (pH, DRP and nitrate) were not significantly correlated to any other variables.
Table 3. Pearson correlation coefficients of log-transformed data for all variables. Correlations >0.55 and significant at P < 0.05 shown in bold. Cond is conductivity, PP is phytoplankton production, BPthy and BPleu are bacterial production measured with the thymidine and leucine methods.
| Cond | DRP | NH4–N | NO3–N | TDN | TDP | Chl a | DOC | pH | DIC | PP | BPthy | BPleu | |
|---|---|---|---|---|---|---|---|---|---|---|---|---|---|
| Cond | 1 | −0.214 | 0.754 | 0.109 | 0.890 | 0.603 | 0.687 | 0.783 | 0.027 | 0.785 | 0.766 | 0.596 | 0.523 |
| DRP | 1 | −0.003 | −0.138 | −0.137 | 0.568 | 0.052 | −0.087 | −0.167 | −0.103 | −0.013 | 0.113 | 0.156 | |
| NH4–N | 1 | −0.042 | 0.833 | 0.659 | 0.788 | 0.771 | 0.127 | 0.841 | 0.856 | 0.743 | 0.587 | ||
| NO3–N | 1 | −0.024 | −0.026 | −0.023 | −0.063 | −0.008 | −0.164 | −0.039 | 0.060 | 0.258 | |||
| TDN | 1 | 0.663 | 0.754 | 0.936 | 0.137 | 0.829 | 0.804 | 0.585 | 0.444 | ||||
| TDP | 1 | 0.754 | 0.626 | −0.084 | 0.604 | 0.724 | 0.580 | 0.410 | |||||
| Chl a | 1 | 0.731 | 0.015 | 0.744 | 0.837 | 0.571 | 0.271 | ||||||
| DOC | 1 | 0.060 | 0.784 | 0.752 | 0.463 | 0.370 | |||||||
| pH | 1 | 0.021 | 0.031 | −0.059 | −0.087 | ||||||||
| DIC | 1 | 0.917 | 0.759 | 0.499 | |||||||||
| PP | 1 | 0.730 | 0.430 | ||||||||||
| BPthy | 1 | 0.829 | |||||||||||
| BPleu | 1 |
4.2. Multiple linear regression
The stepwise forward multiple linear regressions modelled the production rates by selecting the best predictors on the basis of those describing most of the variance; models and equation parameters are shown in table 4. For each of PP and BPthy multiple regression models selected two significant variables; PP was best predicted from DIC and chlorophyll, and the DIC–PP relationship was apparent over the whole range of the DIC concentrations present in pond waters (figure 2(a)). The overall r2 for the PP model was 0.88 (adjusted r2 = 0.87). DIC also made the greatest contribution to the multiple regression model for BPthy (figure 2(a)), with ammonium as a second parameter (figure 2(b)); the strong collinearity between variables in table 3 suggests caution in interpreting this as a direct causal limitation. The overall r2 for the BPthy model was 0.56 (adjusted r2 = 0.52). The multiple linear regression model for BPleu identified a single significant parameter, ammonium, with r2 of 0.53 (adjusted r2 = 0.50).
Table 4. Multiple linear regression statistics describing dependence of phytoplankton production and bacterial production rates on predictor variables.
| Variable | Parameter estimate | P > F | Partial r2 (adjusted r2) |
|---|---|---|---|
| Phytoplankton production model | |||
| Log DIC | 0.625 | <0.006 | 0.825 |
| Log Chl a | 0.290 | <0.0001 | 0.057 |
| Model summary | 0.882 (0.870) | ||
| Bacterial production model (BPthy) | |||
| Log DIC | 0.305 | <0.0001 | 0.510 |
| Log NH4–N | 0.218 | <0.05 | 0.051 |
| Model summary | 0.561 (0.517) | ||
| Bacterial production model (BPleu) | |||
| Log NH4–N | 0.538 | <0.001 | 0.531 |
| Model summary | 0.531 (0.502) | ||
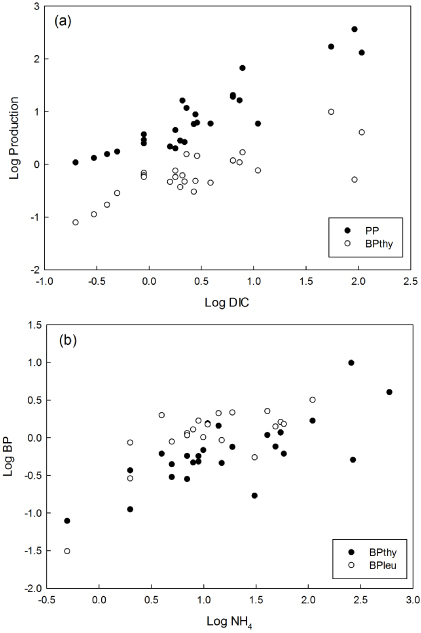
Figure 2. The relationship of significant predictors from multiple linear regression of (a) inorganic carbon limitation and (b) ammonium limitation on primary and secondary production.
Download figure:
Standard image High-resolution image4.3. Regression tree models
The regression tree model for PP (figure 3) selected two significant variables, NH4+ and DIC (table 5). These two variables together explained 80% of the variation in PP, with NH4+ accounting for most of the variation in the model (partial r2 = 0.683). The NH4+ threshold was 50 mg m−3, with the high-NH4+ group including the brines and the four ponds with highest surface NH4+; these sites had the highest mean production rates (1.78 ± 0.54 mgC m−3 h−1). Sites with NH4–N < 50 mg m−3 were further split into two groups across a DIC threshold of 2.29 mol m−3 (partial r2 = 0.119). The lowest mean production rates (0.34 ± 0.18 mgC m−3 h−1) occurred in the group of sites with both low DIC and low NH4+.
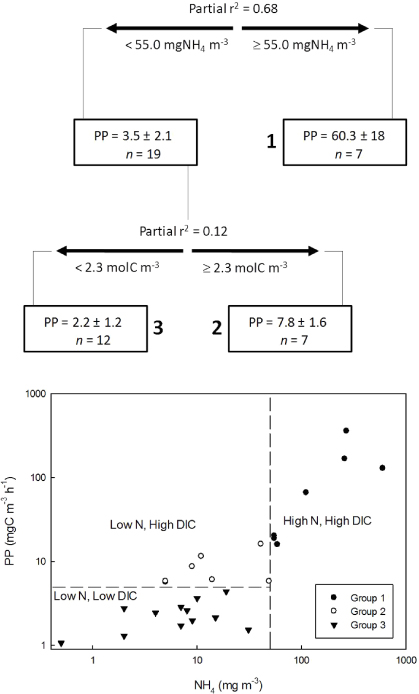
Figure 3. Results from CART analysis of phytoplankton production rates (mgC m−3 h−1). Threshold values of predictors are shown below each split, and variance explained for predictors is shown above each split. Mean values ±1SD and the number of samples (n) are shown for each subset of data, with the three terminal groups identified by numbers in bold. The total variation explained by this CART model was 80%. Scatterplot illustrates the relationship between PP and NH4–N, with datapoints identified into the three CART groups. The vertical dashed line identifies the NH4–N value that best explained variation in PP, and the horizontal line is the PP threshold between the N-limited sites that are limited or not limited by inorganic C.
Download figure:
Standard image High-resolution imageTable 5. Regression tree threshold values, uncertainty estimates, and P-values for phytoplankton production and bacterial production.
| Variable | Threshold (95% CI) | Partial r2 |
|---|---|---|
| Phytoplankton production model | ||
| NH4–N | 54.95 | 0.683 |
| DIC | 2.29 | 0.119 |
| Model summary | 0.802 | |
| Bacterial production model (BPthy) | ||
| PP (first threshold) | 6.03 | 0.426 |
| PP (second threshold) | 2.14 | 0.134 |
| Model summary | 0.560 | |
| Bacterial production model (BPleu) | ||
| PP | 2.45 | 0.451 |
| Model summary | 0.451 | |
The regression tree analyses identified NH4+ availability as the main factor limiting PP (table 5). Figure 3 indicates that the NH4–N threshold of 50 mg m−3 is the saturation concentration on a NH4+–PP response curve, above which PP is not nutrient-limited. DIC co-limitation is seen in the linear response of PP to DIC (figure 2) and in the stepwise regression model, although it exaggerates the overall importance of DIC relative to NH4+ because the DIC–PP response is linear, whereas the NH4+–PP response is non-linear. PP at NH4–N < 50 mg m−3 was notably related to inorganic carbon availability, with a group of low-N, high DIC (>2.29 mol m−3) sites that is solely N-limited and not C-limited (mean PP = 0.89 ± 0.18 mgC m−3 h−1), and the oligotrophic group in which N and C are both low and, according to the model, co-limiting. The next split, which was pruned from the tree, was a chl a split with r2 = 0.009 that did not contribute explanatory power to the model.
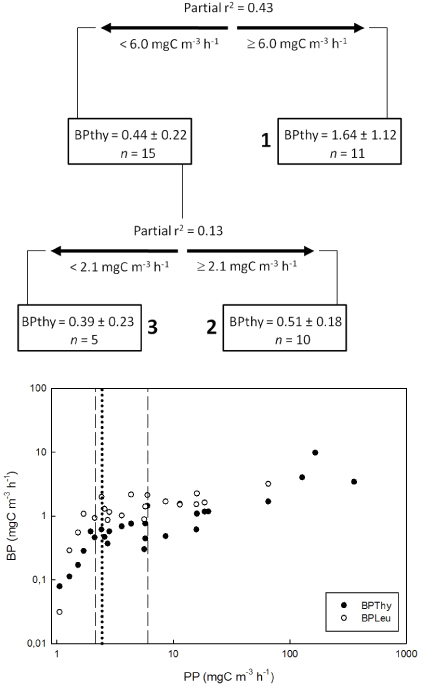
In the regression tree model for BP, PP was the only significant variable (figure 4), with the pruned regression tree explaining 56% of the variation in BPthy and 45% of the variation in BPleu (table 5). The BPthy model identified three significantly distinct groups of BPthy rates, a consequence of the highly non-linear relationship between PP and BPthy (figure 4). At PP < 2.1 mgC m−3 h−1, PP is strongly limiting BPthy, and this threshold is the onset of saturation of the PP–BPthy relationship. It is almost identical to the PP threshold identified in the BPleu model (PP = 2.45 mgC m−3 h−1), confirming that both bacterial production methods were responding similarly to PP. The additional threshold at PP = 6.03 mgC m−3 h−1 in the BPthy model is driven by the high rates in the brines, which were not studied with the BPleu method.
Figure 4. Results from CART analysis of bacterial production rates (mgC m−3 h−1, thymidine method). Threshold values of predictors are shown below each split, and variance explained for predictors is shown above each split. Mean values ±1SD and the number of samples (n) are shown for each subset of data, with the three terminal groups identified by numbers in bold. The total variation explained by this CART model was 56%. Scatterplot of relationships of BPthy and BPleu to PP, the only significant parameter selected by regression tree analysis for both methods (CART for BPleu not shown). The vertical lines identify the values of PP that best explained variation in BPthy (dashed lines) and BPleu (bold dotted line).
Download figure:
Standard image High-resolution image
The PP and BP models together thus implicate a causal chain from strong inorganic N limitation of PP (with a secondary effect of inorganic carbon), with PP in turn primarily limiting BP (table 5). The models exclude other variables that correlate strongly with PP and BP (table 3), and suggest that the significant linear regressions on BP of NH4+ and DIC (table 4) are merely indirect consequences of their importance for PP. The response of BP to PP in figure 4 is a saturation curve, with higher rates of BP sustained at high PP in the brines than in the mixolimnions.
5. Discussion
The range of carbon fixation rates found in this study for phytoplankton of meltwater ponds of the MIS is similar to rates measured in many fresh and brackish waters in small and/or shallow lakes in temperate latitudes (Kalff 2002, p 337). This is true of both volumetric rates and of assimilation numbers (photosynthesis expressed per chlorophyll biomass). MIS pond assimilation numbers are lower than in most tropical and warm-climate waters, but similar to or even higher than many temperate lakes. During the brief summer melt period, temperatures and light intensities in the ponds are comparable to those at many temperate locations, and the TDN and TDP concentrations are also comparable to those found in temperate lakes and ponds. In this regard the MIS ponds are unusual for Antarctic inland waters, when compared against the permanently ice-covered large lakes where light attenuation and very low nutrient concentrations lead to assimilation numbers that are more than an order of magnitude lower (e.g. Lizotte and Priscu 1992). Phytoplankton biomass in waters further inland and in supraglacial ponds is also much lower than on the MIS (Webster-Brown et al 2010).
The predominant limitation of carbon fixation in the MIS ponds by nitrogen availability in our study is consistent with earlier work at the site (Howard-Williams et al 1989). Both stepwise regression and CART identified N, and never P, as important in nutrient limitation. Inorganic N:P ratios also identified N limitation, with 15 of the ponds having an inorganic N:P < 7.2, but again there was no relation between N:P and PP or the CART output.
The large number of ponds sampled in this study has allowed us to explore and model the ancillary factors affecting and limiting primary production more fully. Inorganic carbon limitation or co-limitation of photosynthesis is often thought to be rare in marine and freshwater phytoplankton (Hein and Sand-Jensen 1997, Clark and Flynn 2000), especially as most phytoplankton species have carbon-concentrating mechanisms, particularly bicarbonate usage (Raven et al 2008). At the prevailing summer temperatures, in the putatively C-limited (low-C, low-N) group identified in the CART analysis, bicarbonate still forms about 50% of the inorganic carbon (Stumm and Morgan 1970). However, DIC itself is also low, leading to bicarbonate concentrations <0.2 mol m−3, which are low enough to reduce carbon fixation due to trade-offs between investment in carbon-concentration and RuBisCo specificity, limitations of uptake of micronutrients, and competition (Morel et al 1994, Clark and Flynn 2000, Tortell 2000, Wirtz 2011). Based on these studies, we believe it is likely that there is an inorganic C co-limitation of photosynthesis and growth with N (e.g. Saito et al 2008) in this group of ponds. Nitrogen limitation may exacerbate such trade-offs in investment in N-intensive protein-based enzymatic systems.
The high-N, high-C group, which includes the meromictic brines, has the highest carbon fixation rates and is unlikely to be directly limited by either N or C. Instead, severe photoinhibition (Rae et al 2000) is probably the limiting factor here, as it appears phytoplankton in this group are unable to fully exploit the available inorganic N and C. Phytoplankton of the brines may also suffer photorespiration and photooxidative stress, as these are super-saturated with dissolved oxygen (>60 mgO2 l−1, Safi et al 2012). Nevertheless, the brines are by far the most productive of all the waters of the MIS, and given that meromictic stratification is a prolonged feature during summer for most MIS ponds (Wait et al 2006, Howard-Williams and Hawes 2007), may previously have been underestimated as a contributor to both algal and bacterial production.
Strong nitrogen limitation of carbon fixation may initially appear counter-intuitive given the relatively high TDN concentrations in almost all the MIS ponds studied here. It is likely that most of this DON and the DOC is recalcitrant, as commonly observed in other aquatic ecosystems (Wetzel 1990, Berman and Bronk 2003, Willett et al 2004).
The predominance of recalcitrant DOC also apparently holds for the bacterial production of the MIS ponds, which was related only to PP in the CART analysis and not to any of the organic or inorganic nutrient pools. Such close coupling of BP to PP argues that release of immediately labile DOM from the phytoplankton is the predominant C (and perhaps N) source for the bacteria, with the large DOC and DON pools largely unavailable to them. Correlations between primary and bacterial productivity in aquatic ecosystems are common, as bacteria are strongly dependent on labile organic carbon release from phytoplankton (Cole et al 1988). There is nevertheless considerable variability in the PP:BP relationship between different types of aquatic ecosystems, with the strongest relationships occurring in smaller water bodies where PP and BP respond more rapidly to changes in nutrient inputs (Fouilland and Mostajir 2010). In many aquatic ecosystems BP can greatly exceed PP due to allochthonous organic inputs, but the much lower BP than PP at the MIS is consistent with predominantly closed pond basins receiving no external nutrient inputs from barren catchments. The total bacterial carbon demand includes both that incorporated in biomass (as measured by the thymidine and leucine methods) plus bacterial respiration (Rochelle-Newall et al 2008), and in oligotrophic systems bacterial growth efficiencies are low (del Giorgio et al 1997), but even applying the highest growth efficiencies of ca. 25% suggested by del Giorgio et al (1997) to our data suggests that total bacterial carbon demand is much less than PP. The two bacterial production methods gave similar results, especially given uncertainties in converting label uptake to C and the tendency for the thymidine method, which predominantly labels nucleic acids, to underestimate BP relative to leucine, which labels proteins (van Looij and Riemann 1993, Tuominen 1995).
Our study shows that the regression tree method can be a valuable approach for describing algal and bacterial production in aquatic ecosystems along an environmental gradient. Tree models are most useful when there is a hierarchical structure to the predictor–response relationships and relationships are non-linear. Such patterns are common in ecology and were certainly evident in the PP models on the MIS. In contrast, multiple linear models fit all parameters simultaneously and can underestimate the importance of predictors with a non-linear fit to the response. For example, the exaggerated effect of DIC over NH4+ on PP in the multiple regression analysis is a function of PP increasing linearly with DIC but non-linearly with NH4+. The wide range of nutrient availabilities and other physicochemical parameters that are available on the MIS, unconfounded by other factors due to the limited geographical range of the site and simplicity of systems, provided a powerful comparison of these approaches, and CART allowed us to extract the important features of this unusual site from the many strongly correlated parameters that are driven by the range in size of the ponds on the shelf.
In conclusion, this study has supported the three hypotheses proposed for planktonic production in ice shelf ponds. It has highlighted the very close coupling of primary and secondary production in these waters during the summer melt phase, and that this is a function of strong inorganic nutrient, especially N, limitation. It has also for the first time identified a secondary inorganic C limitation in some ponds, which is a function of the high pH and low inorganic C concentrations. Finally it has highlighted the basal brines as zones of high activity, although biomass-specific productivity in brines is similar to the surface waters suggesting that this reflects high biomass concentration rather than specific activity.
Acknowledgments
This study was funded by the New Zealand Foundation for Research, Science and Technology (Contract C01X306) with logistical support provided by Antarctica New Zealand (Project K081).