
Abstract
The hygroscopic growth of aerosols is controlled by the relative humidity (RH) and changes the aerosols' physical and hence optical properties. Observational studies of aerosol–cloud interactions evaluate the aerosol concentration using optical parameters, such as the aerosol optical depth (AOD), which can be affected by aerosol humidification. In this study we evaluate the RH background and variance values, in the lower cloudy atmosphere, an additional source of variance in AOD values beside the natural changes in aerosol concentration. In addition, we estimate the bias in RH and AOD, related to cloud thickness. This provides the much needed range of RH-related biases in studies of aerosol–cloud interaction.
Twelve years of radiosonde measurements (June–August) in thirteen globally distributed stations are analyzed. The estimated non-biased AOD variance due to day-to-day changes in RH is found to be around 20% and the biases linked to cloud development around 10%. Such an effect is important and should be considered in direct and indirect aerosol effect estimations but it is inadequate to account for most of the AOD trend found in observational studies of aerosol–cloud interactions.
Export citation and abstract BibTeX RIS

Content from this work may be used under the terms of the Creative Commons Attribution 3.0 licence. Any further distribution of this work must maintain attribution to the author(s) and the title of the work, journal citation and DOI.
1. Introduction
Aerosol effects on clouds, through microphysical and radiative processes, are considered as one of the biggest uncertainties in climate studies (Forster et al 2007). Aerosols serve as cloud condensation nuclei (CCN), and/or ice nuclei (IN), providing an estimate for the initial number and size distribution of cloud droplets and ice particles. Changes in aerosol loading result in variations in the cloud particle's size distributions and hence impact cloud processes and properties. Clouds developing in a polluted environment have more but smaller droplets (Squires 1958, Rosenfeld and Lensky 1998). As a result, the collision–coalescence process is less efficient (Warner 1968, Albrecht 1989) and it delays the onset of warm rain formation. The smaller drops are pushed higher in the atmosphere and because the freezing process is also less efficient, they freeze in higher altitudes, releasing the latent heat in colder environment and further increase the buoyancy and the updraft in the clouds. This chain of processes, leading to deeper convective clouds in a high aerosol loading environment is called the cloud invigoration effect (Andreae et al 2004, Koren et al 2005, 2010, Yuan et al 2011, Wang 2005, Khain et al 2005, and others). This effect can be reflected in other cloud properties, such as a larger cloud fraction (Koren et al 2005, Kaufman et al 2005, Lin et al 2006, Small et al 2011), larger anvils (Koren et al 2010) and stronger electrical activity (Altaratz et al 2010, Yuan et al 2011). The invigoration effect has the potential to produce fundamental climate consequences, through impact on the radiation budget, water cycle and thermodynamic balance of the Earth.
For retrieving aerosol properties from space one has to overcome many obstacles. Aerosols have a relatively weak optical signal that often suffers from a low signal-to-noise ratio. This task becomes even harder in the vicinity of clouds, since the separation between clouds and aerosols is not always clear (Koren et al 2007) and the likelihood of cloud contamination (contribution of small and thin clouds to the aerosols signal) is higher (Zhang et al 2005). In addition, clouds can illuminate the aerosols in their vicinity (3D radiative effects, Marshak et al 2006). Such illumination may falsely be translated as enhanced AOD.
In addition to these problems, aerosols can change their properties in the vicinity of clouds due to hygroscopic growth in a humid environment. Therefore, one of the main uncertainties related to aerosol properties is the radiative signature of aerosols due to changes in RH.
The commonly used first approximation for CCN concentration in aerosol–cloud interaction studies is AOD (Andreae 2009). Such an approximation assumes similar conditions of RH and might be significantly offset, when an increase in the AOD due to humidification is interpreted, as an increase in aerosol loading. In particular such biases might pose a problem for cloud invigoration by aerosol studies, since thicker clouds may be correlated with environments characterized by higher RH.
Global circulation model (GCM) studies suggested that aerosol humidification might be responsible for most of the observed correlation between aerosols and cloud properties, such as cloud depth, area or rain rate (Quaas et al 2010, Boucher and Quaas 2013).
Previous studies have examined the variations in aerosol optical properties due to hygroscopic growth, both in the laboratory (Flores et al 2012) and in field campaigns (Feingold and Morley 2003, Carrico et al 2003). The aerosol hygroscopic growth as a function of the surrounding RH value can be described by a single parameter representation, namely the kappa parameterization (Petters and Kreidenweis 2007).
where g is the hygroscopic growth factor, κ is the aerosol hygroscopicity and RH is the relative humidity value (%).
The hygroscopic growth equation (equation (1)) has a RH/(100 − RH) kernel that dictates a fast growing behavior near RH= 100% controlled by the (100−RH)−1 term. This implies a moderate g increase for most of the RH range that increases steeply as the RH value approaches 100%. The steepness of the hygroscopic growth as a function of humidity is modulated by κ. Therefore, when one wishes to study changes in hygroscopic growth due to perturbations in the RH field, one needs to know both the perturbation and the background RH.
Recent studies of the RH spatial distribution within cloud fields (Bar-Or et al 2012) showed that RH exponentially decays from values around 100% when moving away from cloud edges. The e-fold distance scale, is relatively short, reaching a background value within a distance of a few hundred meters from the clouds. Therefore, the significant hygroscopic growth is limited to a thin belt (of a 100's meter scale) around clouds, while the rest of the field exhibits relatively small spatial RH variations around the background value. These results are supported by a few in situ measurements of RH and specific humidity near clouds (Twohy et al 2009, Wang and Geerts 2010).
The lower atmosphere is likely to contain most of the aerosol mass (95% up to 2 km from the surface, Blanchard and Woodcock 1980), with the possible exception of long range transport cases. Moreover, it was also shown that the aerosols in this layer of the atmosphere have the highest hygroscopicity (κ) values, due to a larger contribution of marine hygroscopic aerosols (Pringle et al 2010).
In this study we wish to explore two effects related to the link between RH and AOD, using measurements of radiosondes. First, we estimate the expected RH background and variance values in the lower cloudy atmosphere (LCA). It provides an estimate for the additional source of variance in AOD values beside the natural aerosol concentration variability. Such estimates are important both for direct and indirect effect calculations. Variance as opposed to bias should converge to the mean for a large enough dataset. Therefore the variance does not provide an estimate for a possible systematic shift in AOD values as a function of the cloud vertical development (related to cloud invigoration by an aerosol effect). In the second part of this letter, we divide the data into shallow versus thick cloudy layers and estimate the range of systematic shift in RH values and the derived AOD, related to cloud thickness. This provides the much needed range of RH-related biases (namely not linked to aerosol microphysical effects) in cloud invigoration by aerosol studies.
2. Methods and data
A 12 year (2000–2011, between June–August) dataset of radiosonde measurements (Durre et al 2006) from 13 registered World Metrological Organization (WMO) stations (seven continental and six maritime) is analyzed in this study. All data are obtained from the Atmospheric Sounding dataset of the University of Wyoming (http://weather.uwyo.edu/upperair/sounding.html). The radiosonde data parameters that are used in this study include vertical profiles of height (m), temperature (T), dew point temperature (Td) and relative humidity (RH).
The accuracy of radiosonde water vapor measurements, used for RH estimations, improved since the year 2000. It is estimated as 6–8% for relative humidity values between 20 and 99%, measured during the daytime, in temperature conditions warmer than −20 ° C (Miloshevich et al 2009).
The analyzed atmospheric profiles are classified into three types: (1) 'inside a low-level-cloudy profile'—the low part of the profile (below 2 km) is measured inside a cloud and is characterized by an RH > 99%, (2) 'potentially cloudy atmosphere profile'—part of the profile that is located above the calculated lifting condensation level (LCL, explained in detail below), indicates a possible cloud formation and (3) 'cloud-free profile'—the profile does not support cloud formation conditions in the lower atmosphere. In this study, we focus on subset number 2, namely the profiles that allow cloud formation, yet are not measured inside clouds. Such profiles represent the environment in the vicinity of clouds, in which aerosol properties are retrieved from space. The vast statistics of these profiles should represent well the mean background values of RH over the selected locations. The radiosonde profiles are analyzed for characterizing the RH in the LCA in layers of 1 and 2 km depth, above the surface.
For estimating the possible contribution of the humidification effect to the observed correlations between AOD and cloud vertical extent, one should look for the corresponding changes in RH values as a function of cloud vertical extent. Therefore, we use the radiosonde profile information to estimate the thickness of the potentially cloudy layer. For each radiosonde profile, the lowest convective cloudy layer is determined between the lifting condensation level—LCL (Bolton 1980) and the equilibrium level (EL). The LCL is defined as the height at which an air parcel (having the average properties of the lowest 500 m of the atmosphere) reaches saturation, when it is cooled according to the dry adiabatic lapse rate. We chose the subset of profiles with LCL < 2 km, with no stable layers located below it. The EL is the height above the LCL where the temperature of a buoyantly rising moist parcel becomes equal to the temperature of the environment. In case the parcel does not rise above a level of free convection (colder than the environment) the top of the potentially cloudy layer is determined as the base of the lowest inversion layer located above the LCL. Due to the radiosonde sampling resolution, the minimal depth of a cloudy layer is chosen to be 75 m. For estimation of the RH difference correlated with variations in cloud thickness, each station dataset is divided into two subsets of shallower and deeper clouds, containing equal numbers of samples. The total number of cloudy profiles in the dataset ranges between 374 (in Manaus) and 959 (Hilo), for the full details about all stations see table 1 in the supporting materials (available at stacks.iop.org/ERL/8/034025/mmedia).
The radiative transfer calculations are performed using the spherical harmonic discrete ordinate method—SHDOM (Evans 1998). Two types of aerosols are simulated: aerosol dominated by sea-salt, with a high κ of 0.7 and biomass burning dominated aerosol, with a κ of 0.3 (Andreae and Rosenfeld 2008). The initial dry aerosol size distribution is set to be a bimodal log-normal distribution, comprising fine mode and coarse mode aerosol distributions. The fine mode (coarse mode) geometric mean radius is 0.06 (0.6) μm, the log-standard deviation is 0.7 (0.6) and the total mass content 5 (50) μg m−3.
3. Results
First we characterize the mean RH  in the lower cloudy atmosphere (LCA) and its standard deviation values (σRH). These two moments provide a good approximation for the background value in these cloud fields. Figure 1 shows the results for 13 globally distributed stations, during the months June–July–August, separately for layers extending 1 and 2 km above the surface.

Figure 1. The location of the 13 selected continental (circles) and maritime (squares) stations (upper right). The RH standard deviation (σRH) as a function of the mean RH  , as calculated for the lower cloudy atmosphere (LCA) of seven continental (circles) and six maritime (squares) stations, using an LCA depth of 1 km (lower left) and 2 km (lower right). The data represents day time measurements during June–July–August, between 2000 and 2011.
Download figure:
Standard image High-resolution imageThe 1 km layer results show a  value of 77% for the maritime stations, with σRH,1 km around 9%, and a mean value of 70%, (with a σRH,1 km of 11%) for the continental stations. Full details about the mean and variance values for all stations are presented in table 2 in the supporting materials (available at stacks.iop.org/ERL/8/034025/mmedia).
It can be seen that the variance per station (specific geographic location along a limited period) is relatively narrow. Moreover, a clear negative correlation between the  and σRH appears in the two graphs.
The potentially cloudy layer thickness is used in this work as a measure for the clouds vertical extent. It is well known that this layer depth does not represent the vertical extent of all the clouds in the field, since convective clouds tend to 'overshoot' the equilibrium level. Nevertheless, the potentially cloudy layer depth is strongly correlated with the mean vertical extent of the clouds in the field (North and Erukhimova 2009).
The distributions of cloudy layers' thickness (per station) can be approximated by a normal distribution. The mean values range between 1000 and 2400 m in the maritime stations, and between 1300 and 5500 m in the continental stations (see table 1 in the supporting materials).
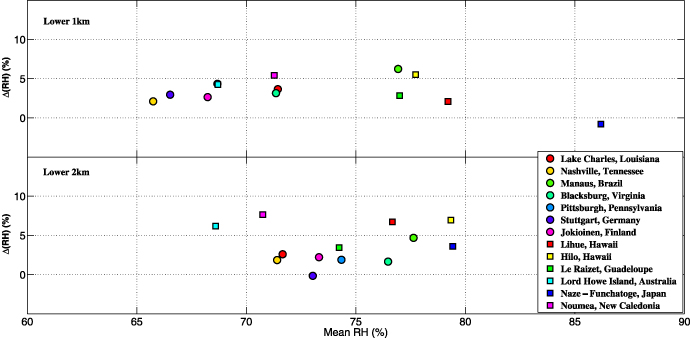
Figure 2 shows the differences between the mean RH values of deeper and shallower cloudy layer subsets (Δ(RH)), as a function of  , for all the stations, in layers of 1 and 2 km above the surface (see table 2 in the supporting materials). The results show that for a layer of 1 km (2 km) depth, the average Δ(RH) is 3% (6%) around an
  of 77% (75%) for the maritime stations and Δ(RH) of 3% (3%) around an
  of 70% (74%) for the continental stations.
Figure 2. The difference between the mean RH values in the vicinity of thick versus shallow cloudy layers (Δ(RH)), as a function of the  values, for seven selected continental (circles) and 6 maritime (squares) stations, for a 1 km layer depth (upper panel) and 2 km (lower panel) above the surface. The data represents day time measurements during June–July–August, between 2000 and 2011.
Download figure:
Standard image High-resolution image
Using the above results, we examined the partial contribution of the aerosol humidification to the observed correlations between cloud vertical extent and AOD. Radiative transfer calculations reveal that the combination of Δ(RH) and  can lead to a maximal AOD increase of 6% and 11% for 1 km and 2 km, respectively, in the maritime stations, when the aerosol hygroscopic growth factor is taken to be relatively low (κ = 0.3). A similar AOD increase range of 6% and 11% for 1 km and 2 km, respectively, is found when the aerosol is considered hygroscopic (κ = 0.7) which is more typical of the maritime stations. Calculations for the continental stations reveal a smaller effect on the AOD with an increase of 4% and 5%, for 1 km and 2 km layers, respectively, for κ = 0.3, and 5% and 4% for κ = 0.7. These results suggest a much smaller effect on the AOD differences related to RH differences between the vicinity of thicker versus thinner clouds (figure 2) compared to the natural day-to-day variance (figure 1).
4. Discussion and summary
Hygroscopic growth of aerosols in a humid environment may change their physical and hence optical properties. Remote sensing studies that examine aerosol–cloud interactions use the AOD as a measure of CCN concentration. The hygroscopic growth that is controlled by the environmental RH, influences the AOD (and hence the estimated CCN concentration). In this study the RH in the lower maritime and continental cloudy atmosphere is characterized, in order to evaluate the humidification impact on the AOD.
The optical impact depends on two parameters, the differences around a given mean RH and the mean RH. To estimate the possible range of the optical effect we estimate the RH mean and variance for 13 stations (June–August) using 12 years of an atmospheric sounding dataset, which is to the best of our knowledge the most extensive and reliable in situ measurement source for RH vertical profiles. The aim of limiting the data to the boreal summer is the need to reduce the meteorological variability as much as possible.
The 1 km layer results show a mean  value of 77% for the maritime stations, with σRH around 9%, and a mean value of 70%, (with σRH of 11%) for the continental stations. The results show that the realistic RH range per geographic location (per station) in a specific season is relatively narrow. Moreover, the negative correlation found between the stations
  and the corresponding σRH, acts to limit the effect of changes in RH on measured AOD, such that in regions with relatively high background
  values, the σRH is low and vice versa. The maximal expected effect on the AOD due to day-to-day variance is on the order of 28% (in the 2 km layer) with a mean of 20%. This provides an estimate for the additional source of variance in AOD values on top of the natural variance in aerosol concentration and properties. Variance is not a measure for a systematic bias. For large enough statistics the results should converge to the mean value. Therefore, we next aimed to estimate biases in the RH effect on AOD, linked to the vertical development of clouds, by sub-setting the data to potentially shallow and thicker clouds.
The estimated bias in AOD is shown to be around 11% for the maritime stations and 5% for the continental stations.
This maximal effect of around 10% on the AOD is important and should be accounted for in both direct and indirect aerosol effect studies. However, in most of the cloud invigoration by aerosol studies the differences in AOD values between clean and polluted conditions are more than a few hundred per cent (Koren et al 2005, 2010, Small et al 2011, Ten Hoeve et al 2012). It is an order of magnitude higher than the humidification effect on AOD shown here (see a discussion about this issue in Boucher and Quaas 2013, Koren et al 2013).
Another source of error in examination of the link between aerosol and cloud properties is the big meteorological variability that controls cloud properties. To minimize this meteorological variance the data can be further divided (in addition to the seasonal division) according to key meteorological parameters that are best correlated with clouds properties (Koren et al 2010, 2012). Such classification of the data is expected to significantly reduce the humidification effect on the AOD since it creates subsets of similar meteorological conditions with similar mean RH values. In this study for example, when dividing the dataset into two groups according to the potential cloudy layer thickness, the estimated bias in AOD, due to differences in RH values between thick and thin cloud environments, is reduced by more than half (5% for the maritime and 3% for the continental stations). When the atmospheric sounding data is available, such a method may offer a straightforward meteorological classification that can significantly improve future aerosol–cloud interaction studies, reducing biases due to both meteorological variance and aerosol humidification effects.
Acknowledgments
We wish to thank the financial support of The Dr Scholl Center for Water and Climate Research and of the Israel Science Foundation (grant No. 1172\10).
We thank the University of Wyoming, Department of Atmospheric Sciences for the sounding data (downloaded from http://weather.uwyo.edu/upperair/sounding.html).