

Abstract
This article provides consolidated estimates of water withdrawal and water consumption for the full life cycle of selected electricity generating technologies, which includes component manufacturing, fuel acquisition, processing, and transport, and power plant operation and decommissioning. Estimates were gathered through a broad search of publicly available sources, screened for quality and relevance, and harmonized for methodological differences. Published estimates vary substantially, due in part to differences in production pathways, in defined boundaries, and in performance parameters. Despite limitations to available data, we find that: water used for cooling of thermoelectric power plants dominates the life cycle water use in most cases; the coal, natural gas, and nuclear fuel cycles require substantial water per megawatt-hour in most cases; and, a substantial proportion of life cycle water use per megawatt-hour is required for the manufacturing and construction of concentrating solar, geothermal, photovoltaic, and wind power facilities. On the basis of the best available evidence for the evaluated technologies, total life cycle water use appears lowest for electricity generated by photovoltaics and wind, and highest for thermoelectric generation technologies. This report provides the foundation for conducting water use impact assessments of the power sector while also identifying gaps in data that could guide future research.
Export citation and abstract BibTeX RIS

Content from this work may be used under the terms of the Creative Commons Attribution 3.0 licence. Any further distribution of this work must maintain attribution to the author(s) and the title of the work, journal citation and DOI.
1. Introduction
Water requirements throughout the electricity generation life cycle have important implications for the electricity sector. Although the operations of thermoelectric power plants require substantial water withdrawals (Kenny et al 2009, Macknick et al 2012), all electricity generation technologies, including those that do not require cooling for steam cycle processes, utilize water throughout their life cycles. This means that the power sector can be vulnerable to constraints caused by drought conditions and other changes in water resources not only directly, due to water required for operations (e.g., Huertas 2007, NETL 2009b), but also indirectly, due to water required throughout fuel supply chains and power plant equipment life cycles. For example, the 2011 drought in Texas not only impacted actual and expected statewide generation (Saathoff 2011) but also led to temporary shutdowns of hydraulic fracturing and other natural gas extraction operations (Carroll 2011, Passwaters 2011). Despite relatively low operational water demands compared to other generation technologies, photovoltaic and wind generation technologies also require water during manufacturing and construction.
The water requirements associated with choices along the life cycle of electricity generation, such as the selection of fuel type or cooling technology, are not well understood. Previous studies address water use across this life cycle to varying degrees (e.g., Gleick 1994, DOE 2006, Fthenakis and Kim 2010, Mielke et al 2010, McMahon and Price 2011), but these studies do not provide sufficient information for water and energy managers to quantify the magnitude and duration of expected impacts. Some reviews focus on water consumption and omit withdrawals for many or all processes (e.g., Gleick 1994, Mielke et al 2010, McMahon and Price 2011, Grubert et al 2012). Most reviews rely on a subset of available data. For example, two representative policy reviews (Mielke et al 2010, Wilson et al 2012) incorporate small amounts of new data but pull primarily from a few key, decades-old compilations (DOE 1983, Gleick 1994), as reflected in figure 1's schematic of the data provenance. Other reviews cover only specific life cycle stages (e.g., Macknick et al (2012) focus only on operations) or geographic contexts (e.g. Grubert et al (2012) evaluate life cycle water impacts from switching from coal- to natural gas-fired electricity generation in Texas). In addition, recent research (GAO 2009, Averyt et al 2013) questions the reliability of some data in commonly referenced statistics on thermoelectric power plant water use from the United States Geological Survey (USGS) (e.g., Solley et al 1998, Hutson et al 2004, Kenny et al 2009) and from the Energy Information Administration (EIA) (e.g., EIA 2011a, 2011b).

Figure 1. This schematic depicts the main provenance of data for some of the key references addressing the water use of electricity generation technologies. As shown, the sources for most data in even contemporary references are many decades old.
Download figure:
Standard imageThis paper assesses the life cycle water withdrawals and consumptive uses for renewable and non-renewable electricity generation technologies, hereafter referred to as generation technologies. It provides concise estimates of water use throughout the life cycle of electricity generation in the United States that are supported by a thorough review of available literature. Where available data differentiate water use among generation technology sub-categories, cooling technologies, or fuel cycle characteristics, we define each collective combination as a production pathway and present separate estimates for each. We collect estimates from a broad review of literature across multiple disciplines, publication types, and stages of the life cycle, applying consistent quality and relevance screens and harmonizing methodological differences. This review is intended to support more informed decisions on technological choice, research and development, and water resources management and to identify gaps where further research could significantly improve understanding of the water requirements for electricity generation.
2. Scope and methods
Following the USGS (Kenny et al 2009), this paper classifies water use into water withdrawals, referring to 'water removed from the ground or diverted from a surface-water source for use' (p 49), and water consumption, referring to the portion of withdrawn water not returned to the 'immediate water environment' (p 47). The generic term water use is employed only where both metrics are discussed concurrently. Consistent with these definitions, we only address externally sourced water; therefore, we omit estimates addressing geologically produced and storm water that requires treatment. We focus only on water quantity requirements, although the life cycle of electricity generation may be associated with water quality issues as well (e.g., Lustgarten 2009, Ward 2010, EPA 2011).
This paper reviews the water use throughout the life cycle of each of seven categories of electricity generation technologies: coal, natural gas, nuclear, concentrating solar power (CSP), geothermal, photovoltaics (PV), and wind. It does not address other technologies due to data complexities and uncertainties. For example, a separate literature addresses biopower's water requirements (e.g., Berndes 2008, Gerbens-Leenes et al 2009, Stone et al 2010), but estimates vary by multiple orders of magnitude across regions, crops, and production methods. Reservoir evaporation complicates hydropower's accounting, leading to estimates ranging from zero to 18 000 gal MWh−1 (Gleick 1994, Torcellini et al 2003). Co-generation leads to challenges in allocating water use across co-products, and other generation technologies, such as ocean power, lack usable data.
Our broad literature review starts with the more than 2000 references amassed by the National Renewable Energy Laboratory's (NREL) Life Cycle Assessment (LCA) Harmonization project (www.nrel.gov/harmonization). Using keyword database searches, works cited lists, and known reference repositories, we expand this review to also include other peer-reviewed scientific literature, government reports and statistics, and corporate sustainability reports pertaining to life cycle water use or water use in any specific phase of the life cycle of electricity generation for the selected technologies.
We perform a series of three screens, described in more detail in the supplementary data (available at stacks.iop.org/ERL/8/015031/mmedia): two at the reference level and a third at the level of individual estimates. First, we screen this complete body of literature for any written quantification of water use within any electricity generation life cycle stage. Passing references receive a second screen, analogous to the screens for systematic review developed by the LCA Harmonization project (Moomaw et al 2011, Heath and Mann 2012), based on methods quality, completeness of reporting, and current technological relevance; this requires sufficient documentation by which the methods for developing results could be trusted and traced. With the exception of a few frequently cited, older sources (DOE 1983, Tolba 1985, Gleick 1994), which are retained because of both their importance to other literature and difficulties in tracking down many of their sources, we also eliminate references that did not provide primary data.
We gather data from all references passing the first two screens and present all non-duplicate estimates in the supplementary data (available at stacks.iop.org/ERL/8/015031/mmedia). In addition to removing duplicates, the third screen focuses on the reasonableness of individual estimates, considering both engineering principles and the preponderance of evidence. With a bias toward retaining estimates, we subject questionable estimates to further scrutiny, considering the thoroughness of documentation and the age of both the questionable reference and of alternative estimates' sources. We also omit otherwise reasonable estimates that lack sufficient disaggregation along the production pathway. In the results below, we discuss any unique estimates omitted in this third screen and otherwise focus presentation and analysis on data that pass all screens. Of the 138 sources passing the reference-level screens, one (Inhaber 2004) provides quantified water use data for all seven technologies we address, one more (Gleick 1994) addresses all but wind (for which water use is listed as 'negligible'), but the majority cover only one or two technologies each with primary data. A given reference can have multiple estimates, even for the same generation technology.
We categorize gathered data by generation technology and life cycle stage. As shown in figure 2, we separate the life cycle into three main stages: fuel cycle, which pertains only to coal, natural gas, and nuclear generation technologies; power plant, which represents the life cycle of the physical power plant equipment; and operations, which includes cooling for thermal technologies and all other plant operation and maintenance functions. Careful tracking of stage definitions and boundaries, which vary by study, is required to avoid double counting as much as possible when adding estimates across stages. This analysis does not account for electricity transmission, distribution, or end use, neither in terms of resource uses nor electricity losses.
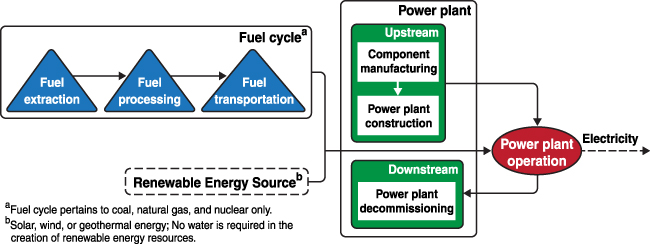
Figure 2. A schematic of the significant life cycle stages for each electricity generation technology demonstrates the additional role of fuel cycle water use in contributing to the life cycle water use for coal, natural gas, and nuclear generation technologies. The power plant life cycle stage consists of an upstream component manufacturing and plant construction phase and a downstream phase when the power plant is decommissioned.
Download figure:
Standard imageReflecting the spatial and temporal impacts of water use, most of this analysis focuses on water use disaggregated across life cycle stages. In addition, although the distinction between withdrawal and consumption is essential for understanding these impacts, many references do not specify which type of water use they report. Therefore, we infer this distinction from context and other information where possible and, where not, omit estimates because of insufficient reporting quality. In some cases of insufficient information, noted below, we assume withdrawals equal consumption, seeking balance between underestimating withdrawals when estimates actually report consumption and overestimating consumption when estimates actually report withdrawals.
We define life cycle water use factors (waterLC) as ratios of life cycle (LC) water use per unit of generated electricity, expressed as gallons per megawatt-hour (gal MWh−1). We calculate factors for the life cycle water consumption and withdrawal associated with each generation technology. These factors represent weighted sums of the water use factors for each of the three major life cycle stages defined in figure 2:
where waterFC is the amount of water used in the fuel cycle (FC) per unit of fuel (expressed as gal ton−1 for coal, gal MMscf−1 for natural gas, and gal kg−1 converted, enriched, and fabricated uranium fuel (i.e., UO2) for nuclear); elifetime is the amount of electricity generated by a power plant over its lifetime (MWh/lifetime); fuellifetime is the amount of fuel used by a power plant over its lifetime (ton/lifetime, MMscf/lifetime, or kg/lifetime, as appropriate); waterPP is the amount of water used for component manufacturing, power plant construction, and power plant decommissioning (i.e. the power plant equipment life cycle (PP) as defined in figure 2) (gal/lifetime); and waterOP is the amount of water used in the operations (OP) of the power plant per unit of generated electricity (gal MWh−1).
In addition to water use estimates, we record parameters relevant to fuel attributes, fuel cycle characteristics, and power plant performance, which can influence the amount of water used in life cycle stages. Where possible with available data, we harmonize all estimates to the common performance parameters shown in table 1; the goal of harmonization is to reduce analytical variability by adjusting previously published estimates to ones based on a more consistent set of methods and assumptions (Heath and Mann 2012). These parameters are selected to match those published in LCA harmonization and other benchmark studies on electricity generated by coal (MIT 2007, Whitaker et al 2012), natural gas (EIA 2011c, O'Donoughue et al 2012), nuclear power (NETL 2012a, Warner and Heath 2012), CSP (Burkhardt et al 2012), PV (Hsu et al 2012, Kim et al 2012), and wind (Dolan and Heath 2012). We assume that, on first order and holding all other aspects of equation (1) constant, each performance parameter affects elifetime or waterOP (as physically appropriate) as:

or

where p is the relevant parameter, the subscript o signifies an original value, and the subscript h signifies a harmonized value. Because elifetime is increasing in each parameter p, the ratio  scales elifetime,o to the proportional change in parameter value. In contrast, generated electricity is in the implicit denominator of waterOP, so the inverse ratio
  scales waterOP,o to the proportional change in parameter value. The supplementary data (available at stacks.iop.org/ERL/8/015031/mmedia) presents all collected estimates as well as statistics on the availability of information for harmonization; the majority of estimates did not have relevant information and cannot be harmonized.
Table 1. Performance parameters used for harmonization and the life cycle stage in which each is applied.
| Parametera | Valueb | Stages for which parameter applies | ||
|---|---|---|---|---|
| Fuel cycle | Power plant | Operations | ||
| Thermal efficiency | ||||
| Coal: PC | 35.4% (LHV), 34.3% (HHV) | ×c | ×c | ×c |
| Coal: SC | 39.9% (LHV), 38.4% (HHV) | ×c | ×c | ×c |
| Coal: IGCC | 39.8% (LHV), 38.5% (HHV) | ×c | ×c | ×c |
| Coal: CFB | 38.3% (LHV), 34.8% (HHV) | ×c | ×c | ×c |
| Natural gas: CC | 51.0% (HHV) | × | × | × |
| Natural gas: CT | 33.0% (HHV) | × | × | × |
| Nuclear: fuel conversion | 2.81 kg U3O8/kg UF6(natural) | × | ||
| Nuclear: fuel enrichment (diffusion) | 10.4 kg UF6(natural)/kg UF6(enriched) | × | ||
| Nuclear: fuel enrichment (centrifugal) | 10.8 kg UF6(natural)/kg UF6(enriched) | × | ||
| Nuclear: fuel fabrication | 3.42 kg UF6(enriched)/kg UO2 | × | ||
| Nuclear: fuel use | 0.004 33 kg UO2 MWh−1 | × | ||
| Fuel heat content | ||||
| Coal | 21.01 MMBtu/ton (LHV) | × | ||
| Natural gas | 1031 Btu/scf (HHV) | × | ||
| Solar-to-electric efficiency | ||||
| CSP: trough | 15.0% | × | × | |
| CSP: power tower | 20.0% | × | × | |
| PV: performance ratio | 80% | × | × | |
| PV: m-Si | 13.0% | × | × | |
| PV: p-Si | 12.3% | × | × | |
| PV: a-Si | 6.3% | × | × | |
| PV: CdTe | 10.9% | × | × | |
| PV: CIGS | 11.5% | × | × | |
| Solar resource | ||||
| CSP | 2400 kWh m−2 yr−1 | × | × | |
| PV | 1700 kWh m−2 yr−1 | × | × | |
| Capacity factor | ||||
| Coal | 85% | × | ||
| Natural gas | 85% | × | ||
| Nuclear | 92% | × | ||
| Wind: onshore | 30% | × | ||
| Wind: offshore | 40% | × | ||
| Power plant lifetime | ||||
| Coal | 30 yr | × | ||
| Geothermal | 30 yr | × | ||
| Natural gas | 30 yr | × | ||
| Nuclear | 40 yr | × | ||
| CSP | 30 yr | × | ||
| PV | 30 yr | × | ||
| Wind | 20 yr | × | ||
aPC =pulverized coal, sub-critical; SC =pulverized coal, super-critical; CFB =circulated fluidized bed; IGCC =integrated gasification combined cycle; CC =combined cycle; CT =combustion turbine; m-Si =mono-crystalline silicon; p-Si =poly-crystalline silicon; a-Si =amorphous silicon; CdTe =cadmium telluride; CIGS =copper indium gallium selenide. bParameters match those published in LCA harmonization and other benchmark studies on electricity generated by coal (MIT 2007, Whitaker et al 2012), natural gas (EIA 2011c, O'Donoughue et al 2012), nuclear power (NETL 2012a, Warner and Heath 2012), CSP (Burkhardt et al 2012), PV (Hsu et al 2012, Kim et al 2012), and wind (Dolan and Heath 2012). We base the lifetime of geothermal on the lifetime used for other technologies. cAlthough LHV is the preferred measure for all life cycle stages of electricity generation by coal, data limitations require the use of HHV for the operations stage.
We develop estimates for each major life cycle stage for each generation technology (where coal, natural gas, and nuclear power have three major stages and all other generation technologies have two, as shown in figure 2). In many cases, such as different fuel extraction methods, cooling technologies, and generation prime movers, distinct production pathways have differentiated water use characteristics. We analyze such choices separately where data provide sufficient detail and aggregate such choices where data are more limited. For each production pathway option, we select the median estimate as reflecting the central tendency of the distribution of available data. Although gathered estimates are not a random sample of actual water use factors from the existing stock of generation facilities, we consider the median to be a reasonable representation across multiple references and technological variability within a category. Finally, we aggregate our selected, harmonized estimates into full life cycle water use estimates and investigate the sensitivity of life cycle water use to different values of the performance parameters shown in table 1.
The broad scope of this analysis necessitates important caveats and assumptions. Studies demonstrate considerable methodological inconsistency, and our attempts to address these through harmonization are limited by available information in the source literature. For example, the majority of thermoelectric operational water use estimates are not accompanied by thermal efficiency data so cannot be harmonized on this parameter. Reported boundaries around life cycle stages, including whether estimates include indirect water use, differ across references, but some references lack clear descriptions of the boundaries applied. As a result, we may overestimate life cycle water use in some cases where overlap leads to double counting and underestimate it in other cases where gaps in our estimate arise from processes being excluded from source data. Because available information suggests that most, but not all, reported estimates exclude indirect water use, we likely underestimate total attributable water use but overestimate on-site water use throughout the life cycle stages of electricity generation technologies. Although the magnitude of these errors is unknown, one expects it to correlate with an electricity generation technology's energy return on energy invested. In addition, although recycling and the use of degraded water both can dramatically reduce the amount of water used in multiple life cycle stages, particularly for withdrawals, we do not explicitly address these technological advances. Water use can vary substantially owing to site-specific differences such as local climate conditions, the age of equipment, and characteristics of the water source (Yang and Dziegielewski 2007) and the application of different environmental compliance technologies; the gross level of analysis presented here necessarily neglects such considerations. The assumption that performance parameters act proportionally upon water use factors does not account for non-linear effects; for example, higher irradiation increases CSP output directly but also may reduce the efficiency if operating temperatures are also raised (Turchi et al 2010). Finally, the estimates provided are neither predictions nor meant to exactly characterize all potential examples of deployment of a certain technology.
3. Results: water use across individual life cycle stages
Tables 2–12 present summary statistics of harmonized estimates of water consumption and withdrawal for major life cycle stages and production pathways for each generation technology, using the performance parameters shown in table 1. The full data these statistics summarize are available in the supplementary data (available at stacks.iop.org/ERL/8/015031/mmedia). Although median estimates are selected to represent each category, ranges reflect not only variability in the analytical reliability of collected estimates but also the aggregation of many potential sub-categories within technologies and life cycle stages. However, the minimum and maximum in the available literature may not represent the true minimum or maximum considering all deployment conditions, technological permutations, etc. Reflecting both the variability and uncertainty in the estimates for broad technology categories, reported results are limited to two significant digits.
Table 2. Summary statistics of selected, harmonized estimates of water consumption and withdrawal for major life cycle stages and production pathways for coal-fired electricity generation.
| Sub-categorya | Consumption (gal MWh−1)b | Withdrawal (gal MWh−1)b | |||||||
|---|---|---|---|---|---|---|---|---|---|
| Median | Min | Max | nc | Median | Min | Max | nc | ||
| Fuel cycled,e,f | Surface mining | 22 | 6 | 58 | 7 | 22 | 6 | 60 | 7 |
| Underground mining | 56 | 17 | 230 | 7 | 57 | 17 | 230 | 7 | |
| Power plantf | Upstream and downstreamg | 1 | <1h | 25 | 8 | 1 | <1h | 12 | 8 |
| Operations | PC: cooling tower | 530 | 200 | 1300 | 20 | 660 | 460 | 1 200 | 21 |
| PC: open loop cooling | 140 | 71 | 350 | 11 | 35 000 | 15 000 | 57 000 | 16 | |
| PC: pond cooling | 740 | 300 | 1000 | 11 | 10 000 | 300 | 26 000 | 10 | |
| PC + CCS: cooling tower | 940 | 900 | 940 | 3 | 1 300 | 1 200 | 1 400 | 3 | |
| SC: cooling tower | 500 | 460 | 590 | 7 | 600 | 580 | 670 | 7 | |
| SC: open loop cooling | 100 | 64 | 120 | 3 | 23 000 | 23 000 | 23 000 | 3 | |
| SC: pond cooling | 42 | 4 | 64 | 3 | 15 000 | 15 000 | 15 000 | 3 | |
| SC + CCS: cooling tower | 880 | 850 | 910 | 2 | 1 100 | 1 100 | 1 100 | 3 | |
| CFB: cooling tower | 560 | 560 | 560 | 1 | 1 000 | 1 000 | 1 000 | 1 | |
| CFB: open loop cooling | 210 | 210 | 210 | 1 | 20 000 | 20 000 | 20 000 | 1 | |
| IGCC: cooling tower | 320 | 35 | 440 | 14 | 390 | 160 | 6 700 | 16 | |
| IGCC + CCS: cooling tower | 550 | 520 | 600 | 4 | 640 | 480 | 740 | 7 | |
aPC =pulverized coal, sub-critical; SC =pulverized coal, super-critical; CFB =circulated fluidized bed; IGCC =integrated gasification combined cycle; CCS =carbon capture and sequestration. bStatistics based on harmonized estimates, with respect to life cycle stage boundaries as well as relevant parameters shown in table 1. cFor estimates constructed from multiple disaggregated stages or processes (reported in table 3), 'n' reports the average number of estimates over each of the stages, plus any included estimates that are not disaggregated. For categories with exactly 2 estimates, the median is defined as the arithmetic mean. dFuel cycle estimates include estimates constructed from estimates for individual stages reported in table 3 in addition to estimates only for aggregated fuel cycle water use. eAll fuel cycle estimates assume train transportation; mine-mouth conversion to electricity would decrease estimates negligibly and slurry pipeline transport would increase estimates substantially. fFuel cycle and power plant estimates are harmonized to the thermal efficiency of a sub-critical pulverized coal power plant. gPower plant includes both upstream water use estimates (primarily for dust suppression during plant construction but also for manufacturing power plant raw materials) and downstream water use estimates (for decommissioning power plants). The latter contributes negligibly to the total for this life cycle stage. h<1 designates a value between 0.1 and 0.5 (due to rounding), and ≪1 designates a value less than 0.1.
3.1. Coal
Coal fuel cycle water factors, shown in table 2, are differentiated between surface and underground mining. Based on available data, we estimate that the fuel cycle uses approximately 22 gal MWh−1 with surface mining or 56 gal MWh−1 with underground mining, based primarily on US mining data and with estimates constructed from the individual process stages shown in table 3. Most water during extraction is used for dust suppression in mines and on roads, and higher surface mining estimates include water used for land reclamation whereas lower ones do not. We assume consumption equals withdrawals because consumption is often difficult to measure for mines; for example, NETL (2010a) reports that 'no specific data were located on the water consumed during mine operations...(consumption data) could not be separated from the storm water output' (p 33).
Table 3. Summary statistics of selected, harmonized estimates of water consumption and withdrawal for major production pathways in the coal fuel cycle.
| Consumption (gal MWh−1)a | Withdrawal (gal MWh−1)a | |||||||
|---|---|---|---|---|---|---|---|---|
| Median | Min | Max | n | Median | Min | Max | n | |
| Extraction (surface)b | 3 | <1c | 13 | 9 | 3 | <1c | 13 | 9 |
| Extraction (underground)b | 27 | 8 | 180 | 8 | 27 | 8 | 180 | 8 |
| Extraction (type not specified)b | 45 | 12 | 120 | 4 | 45 | 12 | 120 | 4 |
| Processingb | 18 | 9 | 1000 | 8 | 18 | 9 | 1000 | 8 |
| Transport (train) | <1c | ≪1c | 1 | 3 | 1 | <1c | 2 | 3 |
| Transport (slurry)b | 110 | 100 | 410 | 6 | 110 | 100 | 410 | 6 |
aStatistics based on harmonized estimates, with respect to life cycle stage boundaries as well as relevant parameters shown on table 1; estimates are harmonized to the thermal efficiency of a sub-critical pulverized coal power plant. This table does not include estimates that are reported only for the entire fuel cycle. bReflecting data limitations and the nature of water use, we assume withdrawal and consumption are equal for all estimates in this category. c<1 designates a value between 0.1 and 0.5 (due to rounding), and ≪1 designates a value less than 0.1.
We omit older estimates of withdrawals up to 17 000 gal MWh−1 for coal cleaning (Tolba 1985) in favor of newer, better documented estimates and therefore estimate that processing, which may or may not occur at the mine, contributes a median of 18 gal MWh−1 to the fuel cycle total. In the final fuel cycle stage of coal transportation, although slurry pipelines consume 110 gal MWh−1 of water, train transport is more common currently, with the median water use reported in table 2 corresponding to a 205 mile transport distance (NETL 2010c).
When amortized to the power plant's lifetime generation, upstream and downstream water use for the coal power plant's equipment is negligible. In contrast, coal power plant cooling requires hundreds to thousands of gallons withdrawn and consumed per MWh. Water use factors vary substantially by cooling technology, with open loop cooling (also known as once-through cooling) requiring much greater withdrawals and recirculating cooling towers consuming relatively more water, as shown in table 2 and described in more detail elsewhere (Macknick et al 2012). Estimates for pond-cooled systems vary widely, because they can be operated similarly to either once-through or recirculating tower systems.
Generally, more efficient combustion technologies (e.g., integrated gasification combined cycle (IGCC)) require less water per unit generation for cooling than less efficient ones (e.g., sub-critical pulverized coal). Variation in reported estimates arises from variation in specific operating conditions as well as whether estimates include non-cooling water uses. For example, additional operational needs, such as pollution controls specific to coal, can be substantial; one study reports 155 gal MWh−1 for coal–ash handling, 12 gal MWh−1 for NOx control, and 60 gal MWh−1 for SOx scrubbing (TWDB 2003). Flue gas desulfurization increases water use by about 40 gal MWh−1 using dry technology and about 70 gal MWh−1 using wet technology (NETL 2009a).
As shown in table 4, collected data suggest that carbon capture and sequestration (CCS) can increase operations water consumption by about 75% and water withdrawal by between 64% and 97%, due to a combination of lower efficiencies and additional process demands for certain CCS technologies. Efficiency penalties also increase the fuel cycle and power plant equipment life cycle water use per generated MWh. However, the water use of all CCS technologies has not been characterized in the literature, and technologies with different efficiency and operational characteristics would lead to different relative water impacts.
Table 4. Estimated effect of carbon capture and sequestration (CCS) on life cycle water use for coal- and natural gas-fired electricity generation.
| Pulverized coal (sub-critical) | Pulverized coal (super-critical) | Circulating fluidized bed | Integrated gasification combined cycle | Natural gas combined cycle | ||
|---|---|---|---|---|---|---|
| Thermal efficiency (HHV)a | w/o CCS | 34.3% | 38.5% | 34.8% | 38.4% | 51.0% |
| w/ CCS | 25.1% | 29.3% | 25.5% | 31.2% | 43.9% | |
| Change | −27% | −24% | −27% | −19% | −14% | |
| Power plant, consumption (gal MWh−1)b | w/o CCS | 0.9 | 0.8 | 0.8 | 0.8 | 0.4 |
| w/ CCS | 1.2 | 1.0 | 1.1 | 1.0 | 0.8 | |
| Change | 37% | 31% | 36% | 23% | 100% | |
| Power plant, withdrawal (gal MWh−1)b | w/o CCS | 1.3 | 1.2 | 1.2 | 1.2 | 0.6 |
| w/ CCS | 1.8 | 1.5 | 1.6 | 1.5 | 1.0 | |
| Change | 37% | 31% | 36% | 23% | 67% | |
| Fuel cycle, consumption (gal MWh−1)c | w/o CCS | 22 | 19 | 20 | 20 | 4 |
| w/ CCS | 30 | 25 | 27 | 24 | 5 | |
| Change | 37% | 31% | 36% | 23% | 16% | |
| Fuel cycle, withdrawal (gal MWh−1)c | w/o CCS | 22 | 19 | 20 | 20 | 5 |
| w/ CCS | 31 | 25 | 27 | 24 | 6 | |
| Change | 37% | 31% | 36% | 23% | 16% | |
| Operations, consumption (gal MWh−1)d | w/o CCS | 530 | 500 | 560 | 320 | 210 |
| w/ CCS | 940 | 880 | 980f | 550 | 380 | |
| Change | 77% | 76% | 75%f | 72% | 81% | |
| ne | 3 | 2 | 0f | 4 | 2 | |
| Operations, withdrawal (gal MWh−1)d | w/o CCS | 660 | 600 | 1000 | 390 | 250 |
| w/ CCS | 1300 | 1100 | 1800f | 640 | 510 | |
| Change | 97% | 83% | 81%f | 64% | 104% | |
| ne | 3 | 3 | 0f | 7 | 3 | |
aAs reported in MIT (2007) for coal technologies and NETL (2010b) for natural gas technology. bWe estimate power plant water use for different coal-fired generation technologies with and without CCS by adjusting the parameter for thermal efficiency from our base case (for sub-critical pulverized coal without CCS) to the reported thermal efficiencies. For natural gas-fired generation with CCS, we use the estimate reported by NETL (2010b). cWe estimate fuel cycle water use for different generation technologies with and without CCS by adjusting the parameter for thermal efficiency from our base cases for coal- and natural gas-fired generation to the reported thermal efficiencies. dEstimated using median reported values as reported in tables 2 and 5. e'n' reports the number of operations water use estimates for each prime mover technology with CCS, as reported in tables 2 and 5. fWe estimate water use during operations of a circulated fluidized bed power plant equipped with CCS based on the weighted average of the other generation technology's estimates, due to a lack of reported estimates.
3.2. Natural gas
The natural gas-fired electricity life cycle also includes a fuel cycle, with the key water-relevant fuel cycle distinction being the use of hydraulic fracturing for shale gas extraction versus other conventional methods of extracting gas sources, as shown in tables 5 and 6. For hydraulic fracturing in shale, reported water use ranges from 300 000 gallons per well (Noble Energy Inc. and CSU 2012) to nearly 9 million gallons per well (TWDB 2012), with 50% of collected data reporting between 2 and 5 million gallons per well. Amortized by play-specific estimated ultimate recovery (EUR) of a well as reported in EIA (2011c), this corresponds to a median of 16 gal MWh−1 for shale gas hydraulic fracturing. Reflecting recent interest on the topic (e.g., GAO 2012, JISEA 2012, TWDB 2012), we found many estimates for water use in shale gas hydraulic fracturing and display these in figure 3. The variation in estimates corresponds to the range of water volumes associated with technological differences; to variations in EUR, which can vary by as much as a factor of 10 across wells even within the same formation (GAO 2012); and to variation in other factors such as well length.
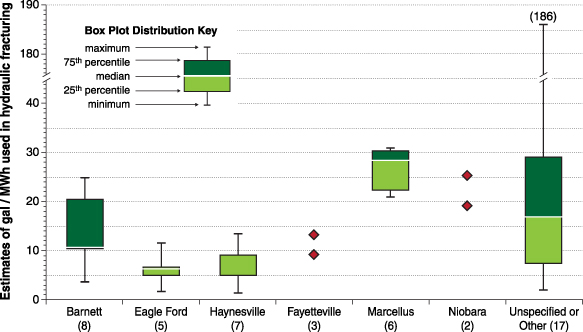
Figure 3. Distributions of estimates of water use for hydraulic fracture stimulation for shale gas extraction, expressed as a function of generated electricity, demonstrate variability both within and across different shale plays. Estimates do not include water used for drilling. The number of estimates for each play is presented in parentheses. The broken y-axis accommodates one outlier estimate reported as the upper limit of water use by IEA (2012). This figure is based on author analysis of collected estimates from 17 references; all fracturing (shale) estimates provided in the Natural Gas–Fuel Cycle–consumption table in the supplemental data (available at stacks.iop.org/ERL/8/015031/mmedia) are represented in this figure.
Download figure:
Standard imageTable 5. Summary statistics of selected, harmonized estimates of water consumption and withdrawal for major life cycle stages and production pathways for natural gas-fired electricity generation.
| Sub-categorya | Consumption (gal MWh−1)b | Withdrawal (gal MWh−1)b | |||||||
|---|---|---|---|---|---|---|---|---|---|
| Median | Min | Max | nc | Median | Min | Max | nc | ||
| Fuel cycled,e | Conventional natural gasf | 4 | 1 | 26 | 9 | 5 | 4 | 34 | 8 |
| Shale gas | 16 | 3 | 210 | 20 | 17 | 5 | 220 | 18 | |
| Power plante | Upstream and downstreamg | 1 | <1h | 1 | 2 | <1h | <1h | 1 | 3 |
| Operations | CC: cooling tower | 210 | 47 | 300 | 19 | 250 | 150 | 760 | 16 |
| CC: dry cooling | 4 | 4 | 120 | 4 | 4 | ≪1h | 4 | 2 | |
| CC: open loop cooling | 100 | 20 | 230 | 8 | 9 000 | 7 200 | 21 000 | 7 | |
| CC: pond cooling | 240 | 240 | 240 | 2 | 6 000 | 6 000 | 6 000 | 2 | |
| CC + CCS: cooling tower | 380 | 380 | 380 | 2 | 510 | 490 | 510 | 3 | |
| CT | 50 | 50 | 340 | 3 | 430 | 430 | 430 | 1 | |
| Steam: cooling tower | 730 | 560 | 1100 | 8 | 1 200 | 1 200 | 1 200 | 2 | |
| Steam: open loop cooling | 290 | 190 | 410 | 6 | 36 000 | 35 000 | 37 000 | 2 | |
| Steam: pond coolingi | 270 | 270 | 270 | 1 | 270 | 270 | 270 | 1 | |
aCC =combined cycle; CT =combustion turbine; CCS =carbon capture and sequestration. bStatistics based on harmonized estimates, with respect to life cycle stage boundaries as well as relevant parameters shown in table 1. cFor estimates constructed from multiple disaggregated stages or processes (reported in table 6), 'n' reports the average number of estimates over each of the stages. For categories with exactly 2 estimates, the median is defined as the arithmetic mean. dFuel cycle estimates consists of estimates constructed from estimates for the individual stages within the fuel cycle (reported in table 6). All fuel cycle estimates assume pipeline transportation; estimates for water use in the fuel cycle of liquid natural gas (LNG) range widely and could potentially increase estimates substantially. eFuel cycle and power plant estimates are harmonized to the thermal efficiency of a combined cycle plant. fWe define conventional natural gas as that not requiring fracture stimulation. gPower plant includes both upstream water use estimates (primarily for dust suppression during construction but also for the water use for manufacturing power plant raw materials) and downstream water use estimates (for water used in decommissioning power plants). The latter contributes negligibly to the total for this life cycle stage. h<1 designates a value between 0.1 and 0.5 (due to rounding), and ≪1 designates a value less than 0.1. iReflecting data limitations and the nature of water use, we assume withdrawal and consumption are equal for all estimates in this category.
Table 6. Summary statistics of selected, harmonized estimates of water consumption and withdrawal for major production pathways in the natural gas fuel cycle.
| Consumption (gal MWh−1)a | Withdrawal (gal MWh−1)a | |||||||
|---|---|---|---|---|---|---|---|---|
| Median | Min | Max | nb | Median | Min | Max | n | |
| Drillingc | 1 | ≪1e | 19 | 29 | 1 | ≪1e | 19 | 29 |
| Fracturing (other fracture stimulated gas)c,d | <1e | ≪1e | 2 | 4 | <1e | ≪1e | 2 | 4 |
| Fracturing (shale gas)c | 12 | 1 | 186 | 49 | 12 | 1 | 186 | 49 |
| Processingc | <1e | <1e | <1e | 1 | <1e | <1e | <1e | 1 |
| Transport (pipeline) | 3 | 1 | 6 | 2 | 4 | 4 | 13 | 3 |
| Transport (liquefied natural gas) | 1 | 1 | 1 | 1 | 8 | 8 | 8 | 1 |
aStatistics based on harmonized estimates, with respect to life cycle stage boundaries as well as relevant parameters shown in table 1; estimates are harmonized to the thermal efficiency of a combined cycle natural gas power plant. bFor categories with exactly 2 estimates, the median is defined as the arithmetic mean. cReflecting data limitations and the nature of water use, we assume withdrawal and consumption are equal for all estimates in this category. dThe 'other fracture stimulated gas' category includes two estimates for tight gas and two reported for 'conventional gas with fracture stimulation' (all from IEA (2012)). e<1 designates a value between 0.1 and 0.5 (due to rounding), and ≪1 designates a value less than 0.1.
After extraction, natural gas is processed to bring it to pipeline quality. Although three older references (DOE 1983, Tolba 1985, Gleick 1994) agree upon a relatively high water usage of 11 gal MWh−1 for this processing, we defer to the more recent NETL (2010d) assessment that processing requires an equivalent of only 0.1 gal MWh−1. Although this estimate is only for natural gas sweetening, it is unclear that any other stages of the natural gas processing stage use water; note that Grubert et al (2012) estimate no water use for natural gas processing. In all, our analysis suggests 4 gal MWh−1 consumed and 5 gal MWh−1 withdrawn in the fuel cycle of conventional natural gas, and 16 gal MWh−1 and 17 gal MWh−1 in that of shale gas.
As with most other thermoelectric technologies, we estimate water use in the power plant equipment's life cycle as negligible (1 gal MWh−1 or less), and operational water use far exceeds that for other life cycle stages in most cases, with important differences among cooling technologies. Reflecting the high thermal efficiencies of combined cycle natural gas plants relative to coal combustion, water used in natural gas operations is approximately one-half to one-third that for coal for a given cooling technology. Less efficient gas combustion technologies have higher operational water use estimates, and as shown in table 4, CCS technology can increase operational water use by as much as a factor of two.
3.3. Nuclear
The uranium fuel cycle includes extraction, numerous processing steps, and greater end-of-life considerations than other fuels. As shown in table 7, our analysis suggests that the nuclear power fuel cycle typically withdraws 56 gal MWh−1 water with centrifugal enrichment and 140 gal MWh−1 (87 gal MWh−1 of which is consumed) for gaseous diffusion enrichment. Due to data limitations, including consumption estimates that often exceed estimates reported for withdrawal, we assume that withdrawal equals consumption for all fuel cycle stages except gaseous diffusion enrichment. Consistent with other technologies, we consider only externally sourced water; estimates including produced water for in situ leaching exceed those shown here by approximately 70 times (e.g., Mudd and Diesendorf 2009). We do not distinguish between extraction methods; as table 8 shows, external water use estimates are not significantly differentiated by extraction method. End-of-life water use for nuclear power is uncertain; currently implemented fuel management options are at the low end of estimates (e.g., 1 gal MWh−1 withdrawal (Schneider et al 2010)), whereas potential fuel recycling is estimated at 720 gal MWh−1 withdrawal (NETL 2012a).
Table 7. Summary statistics of selected, harmonized estimates of water consumption and withdrawal for major life cycle stages and production pathways for nuclear power.
| Sub-category | Consumption (gal MWh−1)a | Withdrawal (gal MWh−1)a | |||||||
|---|---|---|---|---|---|---|---|---|---|
| Median | Min | Max | nb | Median | Min | Max | nb | ||
| Fuel cyclec | Centrifugal enrichment | 56 | 13 | 300 | 5 | 56 | 13 | 300 | 5 |
| Diffusion enrichment | 87 | 42 | 330 | 5 | 140 | 62 | 410 | 5 | |
| Power plant | Upstream and downstreamd | <1e | <1e | <1e | 2 | <1e | <1e | <1e | 2 |
| Operations | Cooling tower | 720 | 580 | 890 | 9 | 1 100 | 800 | 2 600 | 7 |
| Open loop cooling | 400 | 100 | 400 | 5 | 47 000 | 23 000 | 60 000 | 12 | |
| Pond cooling | 610 | 400 | 720 | 4 | 1 100 | 500 | 13 000 | 4 | |
aStatistics based on harmonized estimates, with respect to life cycle stage boundaries as well as relevant parameters shown in table 1. bFor estimates constructed from multiple disaggregated stages or processes (reported in table 8), 'n' reports the average number of estimates over each of the stages. For categories with exactly 2 estimates, the median is defined as the arithmetic mean. cFuel cycle estimates consists of estimates constructed from the individual stage estimates. All fuel cycle estimates represent a combined estimate for different extraction types and storage and disposal for spent fuel; reprocessing and recycling of spent fuel is not currently practiced in the United States but would increase estimates substantially. dDue to limited information, upstream water use includes estimates only for manufacturing power plant raw materials. In addition, although the stage is expected to be negligible, no estimates for downstream water use were found. e<1 designates a value between 0.1 and 0.5 (due to rounding), and ≪1 designates a value less than 0.1.
Table 8. Summary statistics of selected, harmonized estimates of water consumption and withdrawal for major production pathways in the nuclear fuel cycle.
| Consumption (gal MWh−1)a | Withdrawal (gal MWh−1)a | |||||||
|---|---|---|---|---|---|---|---|---|
| Median | Min | Max | nb | Median | Min | Max | nb | |
| Extraction (in situ leaching)c,d | 18 | 13 | 23 | 2 | 18 | 13 | 23 | 2 |
| Extraction (surface)c | 32 | 4 | 92 | 6 | 32 | 5 | 92 | 6 |
| Extraction (underground)c | 30 | <1g | 240 | 4 | 30 | <1g | 240 | 4 |
| Extraction (type not specified)c | 15 | 15 | 15 | 1 | 15 | 15 | 15 | 1 |
| Processing (milling)c | 11 | 3 | 29 | 6 | 11 | 3 | 29 | 6 |
| Processing (conversion)c | 10 | 4 | 13 | 3 | 10 | 4 | 13 | 3 |
| Processing (centrifugal enrichment)c | 4 | 3 | 6 | 3 | 4 | 3 | 6 | 3 |
| Processing (diffusion enrichment) | 35 | 32 | 37 | 2 | 83 | 51 | 120 | 2 |
| Processing (fuel fabrication)c | 1 | 1 | 3 | 4 | 1 | 1 | 3 | 4 |
| End-of-life (storage and disposal)c,e | 3 | 1 | 5 | 3 | 3 | 1 | 5 | 3 |
| End-of-life (reprocessing spent fuel)f | 7 | 7 | 7 | 1 | 720 | 720 | 720 | 1 |
aStatistics based on harmonized estimates, with respect to life cycle stage boundaries as well as relevant parameters shown in table 1. bFor categories with exactly 2 estimates, the median is defined as the arithmetic mean. cReflecting data limitations and the nature of water use, we assume withdrawal and consumption are equal for all estimates in this category. dFor in situ leaching, only external water use is considered. The inclusion of produced water can lead to estimates on the order of 70 times higher. eStorage and disposal includes estimates both of 'temporary' storage on site and also the hypothetical Yucca Mountain storage facility. fReprocessing of fuel is based on a hypothetical facility (NETL 2012a). g<1 designates a value between 0.1 and 0.5 (due to rounding), and ≪1 designates a value less than 0.1.
The large lifetime output of nuclear power plants leads to negligible estimates for the power plant equipment life cycle. Estimated operational water requirements, however, are around one or more orders of magnitude higher than fuel cycle estimates. As for other generation technologies, we estimate that the proportion of withdrawn water that is consumed is higher for cooling towers than it is for open loop cooling, and the proportion of consumption for pond cooling is in between the two.
3.4. Concentrating solar power (CSP)
CSP has no fuel cycle, but CSP power plant life cycle estimates (in gal MWh−1) are higher than for the non-renewable thermoelectric technologies. This likely reflects the lower lifetime output over which upstream use is amortized and the use of specialty chemicals requiring more water than commodities used in typical thermoelectric technologies. Although Inhaber (2004) estimates about 1 gal MWh−1 for the power plant equipment life cycle based on material volumes, other references estimate water consumption just for construction between 1 and 80 gal MWh−1. We omit these estimates and instead base our median water use estimate of 160 gal MWh−1 only on references reporting more comprehensively for the power plant life cycle (Burkhardt et al 2011, NETL 2012b). As a thermoelectric generation technology, CSP withdraws similar amounts of operational water to pulverized coal technology, with important differences by cooling technology. However, because CSP systems commonly are located in remote areas and use evaporation ponds for water disposal, consumption volumes typically equal withdrawals regardless of technology (Solar Millennium LLC 2008).
Table 9. Summary statistics of selected, harmonized estimates of water consumption and withdrawal for major life cycle stages and production pathways for CSP-generated electricity.
| Sub-category | Consumption (gal MWh−1)a | Withdrawal (gal MWh−1)a | |||||||
|---|---|---|---|---|---|---|---|---|---|
| Median | Min | Max | nb | Median | Min | Max | nb | ||
| Power plant | Upstream and downstreamc | 160 | 80 | 170 | 3 | 160 | 99 | 170 | 3 |
| Operations | Dish stirlingd | 5 | 5 | 5 | 2 | 5 | 5 | 5 | 2 |
| Fresneld | 1000 | 1000 | 1000 | 1 | 1000 | 1000 | 1000 | 1 | |
| Power tower: cooling tower | 810 | 740 | 860 | 5 | 740 | 740 | 740 | 1 | |
| Power tower: dry coolingd | 26 | 26 | 26 | 1 | 26 | 26 | 26 | 1 | |
| Power tower: hybrid coolingd | 170 | 90 | 250 | 2 | 170 | 90 | 250 | 2 | |
| Trough: cooling tower | 890 | 560 | 1900 | 26 | 960 | 870 | 1100 | 2 | |
| Trough: dry cooling | 78 | 32 | 140 | 20 | 78 | 33 | 79 | 11 | |
| Trough: hybrid cooling | 340 | 110 | 350 | 3 | 340 | 340 | 340 | 1 | |
aStatistics based on harmonized estimates, with respect to life cycle stage boundaries as well as relevant parameters shown in table 1. bFor estimates constructed from multiple disaggregated stages or processes, 'n' reports the average number of estimates over each of the stages. For categories with exactly 2 estimates, the median is defined as the arithmetic mean. cPower plant includes both upstream water use estimates (using only those that include manufacturing in addition to construction) and downstream water use estimates (for water used in dismantling and disposal of power plants). The latter contributes negligibly to the total for this life cycle stage. Estimates are harmonized to the solar-to-electric efficiency of a trough power plant. We include consumption estimates from Burkhardt et al (2011) in the withdrawal category due to lack of available data on withdrawals; therefore, withdrawals might be underestimated. dReflecting data limitations and the nature of water use, we assume withdrawal and consumption are equal for all estimates in this category.
3.5. Geothermal
Usable data on geothermal power's water use are limited, as shown in table 10. From available data, we estimate that 3 gal MWh−1 of water are withdrawn and 2 gal MWh−1 are consumed in the power plant equipment life cycle, with water use dominated by drilling and cementation in plant construction. As described in more detail elsewhere (Clark et al 2011, Macknick et al 2012), operational water use varies by more than an order of magnitude corresponding both to technology configurations (e.g., dry steam, binary, and flash) and to local contexts. Consistent with Macknick et al (2012) and our treatment of other technologies, we screened out many published estimates of geothermal operations water use that included geothermal fluids in operational water requirements and focus only on estimates of external water required for operations. Estimates of water use that include geothermal fluids in operational water requirements report water consumption values between roughly 2000 gal MWh−1 to 4000 gal MWh−1, with estimates of EGS even higher (Macknick et al 2011). In addition, because the limited data led to results conflicting with physical laws, we include an estimate for a tower-cooled binary power plant that normally would be excluded by our screens because the value (700 gal MWh−1) is estimated from a graphic in the original source (Kozubal and Kustcher 2003).
Table 10. Summary statistics of selected, harmonized estimates of water consumption and withdrawal for major life cycle stages and production pathways for geothermal power-generated electricity.
| Sub-categorya | Consumption (gal MWh−1)b | Withdrawal (gal MWh−1)b | |||||||
|---|---|---|---|---|---|---|---|---|---|
| Median | Min | Max | nc | Median | Min | Max | nc | ||
| Power plant | Upstream and downstreamd | 2 | 2 | 2 | 1 | 3 | <1g | 10 | 11 |
| Operationse | Binary: hybrid coolingf | 460 | 220 | 700 | 2 | 460 | 220 | 700 | 2 |
| Binary: dry coolingf | 290 | 270 | 630 | 3 | 290 | 270 | 630 | 3 | |
| Flash | 11 | 5 | 360 | 5 | 18 | 11 | 25 | 2 | |
| EGS: dry coolingf | 510 | 290 | 720 | 2 | 510 | 290 | 720 | 2 | |
aEGS =enhanced geothermal system. bStatistics based on harmonized estimates, with respect to life cycle stage boundaries as well as relevant parameters shown in table 1. cFor categories with exactly 2 estimates, the median is defined as the arithmetic mean. dDue to limited information, upstream water use includes estimates only for manufacturing power plant raw materials and construction. In addition, although the stage is expected to be negligible, no estimates for power plant downstream water use were found. eWe omit many collected estimates, which conflate produced water with external water; only external water use is reported in the table. fReflecting data limitations and the nature of water use, we assume withdrawal and consumption are equal for all estimates in this category. g<1 designates a value between 0.1 and 0.5 (due to rounding), and ≪1 designates a value less than 0.1.
3.6. Photovoltaics (PV)
As shown in table 11, estimates of water withdrawal for PV's power plant equipment life cycle vary widely, from 1 to 1600 gal MWh−1, with the majority near the median estimate of 94 gal MWh−1 for crystalline silicone (C-Si). Of the few consumption estimates available, those matched to withdrawal estimates suggest approximately 30% of withdrawn water is consumed (Genesee County Economic Development Center 2011). Because the water use for the PV power plant potentially dominates that for other PV life cycle stages, this variation argues for further study; processing silicon into PV equipment involves numerous stages with rapidly developing techniques that are much less established than manufacturing processes used for other generation technologies, such as the fabrication of steel components. Given this uncertainty, we combine a variety of individual PV technologies, mostly thin-films, into a single 'other' category.
Table 11. Summary statistics of selected, harmonized estimates of water consumption and withdrawal for major life cycle stages and production pathways for PV-generated electricity.
| Sub-category | Consumption (gal MWh−1)a | Withdrawal (gal MWh−1)a | |||||||
|---|---|---|---|---|---|---|---|---|---|
| Median | Min | Max | nb | Median | Min | Max | n | ||
| Power plantc | C-Si (crystalline silicone) | 81 | 10 | 210 | 3 | 94 | 1 | 1600 | 24 |
| Other (primarily thin-film) | 6 | 5 | 7 | 2 | 18 | <1d | 1400 | 19 | |
| Operations | Flat panelde | 6 | 1 | 26 | 9 | 6 | 1 | 26 | 9 |
| Concentrated PVe | 30 | 24 | 78 | 4 | 30 | 24 | 78 | 4 | |
aStatistics based on harmonized estimates, with respect to life cycle stage boundaries as well as relevant parameters shown in table 1. bFor categories with exactly 2 estimates, the median is defined as the arithmetic mean. cPower plant estimates include both upstream (i.e., raw materials, manufacturing, construction, and transportation) and downstream (decommissioning) water use. Due to a lack of data, we assume for downstream processes that consumption is negligible and withdrawal is equivalent across sub-categories. d<1 designates a value between 0.1 and 0.5 (due to rounding), and ≪1 designates a value less than 0.1. eReflecting data limitations and the nature of water use, we assume withdrawal and consumption are equal for all estimates in this category.
Water use for operations is minimal. Experimental evidence demonstrates that although frequent washing increases output, it likely leads to economic losses (Sahm et al 2005). DOE (2012) reports that few operators wash PV panels in actual practice. The higher water use of concentrated PV likely reflects certain shared operational characteristics with CSP, such as a need for mirror washing.
3.7. Wind
Although wind data come from few references, these estimates appear of high quality due to thorough information, including paired reporting of withdrawal and consumption, relatively close agreement on withdrawals across sources, and relatively common reporting for power plant downstream water use. We omit older estimates of manufacturing water use that are based on standard manufacturing practices and the bulk volume of materials (Inhaber 2004) in favor of detailed data from manufacturers and a national laboratory, resulting in a median withdrawal of 26 gal MWh−1 and consumption of 1 gal MWh−1. Wind turbines require no fuel and little, if any, washing and maintenance, so operational water use is very low.
Table 12. Summary statistics of selected, harmonized estimates of water consumption and withdrawal for major life cycle stages and production pathways for wind-generated electricity.
| Sub-category | Consumption (gal MWh−1)a | Withdrawal (gal MWh−1)a | |||||||
|---|---|---|---|---|---|---|---|---|---|
| Median | Min | Max | nb | Median | Min | Max | nb | ||
| Power plant | Upstream and downstreamc | 1 | ≪1d | 9 | 12 | 26 | 13 | 83 | 19 |
| Operations | Onshore | <1d | ≪1d | 2 | 10 | 1 | 1 | 1 | 2 |
| Offshore | ≪1d | ≪1d | 1 | 4 | 2 | ≪1d | 3 | 9 | |
aStatistics based on harmonized estimates, with respect to life cycle stage boundaries as well as relevant parameters shown in table 1. bFor estimates constructed from multiple disaggregated stages or processes, 'n' reports the average number of estimates over each of the stages. For categories with exactly 2 estimates, the median is defined as the arithmetic mean. cPower plant includes both upstream water use estimates (pertaining to manufacturing, materials, and construction) and downstream water use estimates (for water used in dismantling and disposal of power plants). The latter contributes negligibly to the total for this life cycle stage. d<1 designates a value between 0.1 and 0.5 (due to rounding), and ≪1 designates a value less than 0.1.
4. Results: water use across the full life cycle
Figures 4 and 5 depict estimated total life cycle water consumption and water withdrawal, respectively, for selected production pathways for each generation technology, leveraging the best available evidence collected and screened herein. We construct life cycle water use by summing water use factors for relevant stages presented above using the consistent performance parameters presented in table 1 and using consistent definitions for each life cycle stage. These estimates are based on median values and thus ignore the important variation within estimates for each stage. More generally, life cycle water use estimates are a limited indicator of aggregate impact on water resources, given the critical spatial and temporal characteristics of resource demands and availability.
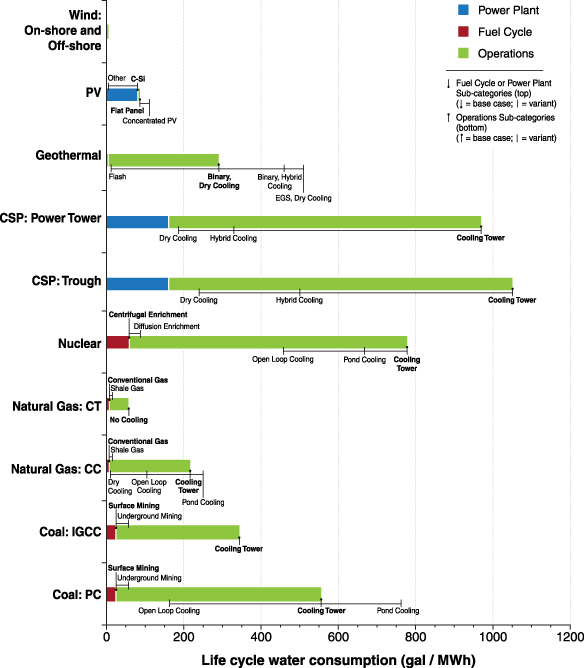
Figure 4. Estimated life cycle water consumption factors for selected electricity generation technologies, based on median harmonized estimates, demonstrate significant variability with respect to technology choices. Base case estimates for each life cycle stage, presented in bold font, are held constant for estimating life cycle water consumption factors for other life cycle stages. Estimates for production pathway variants in fuel cycle or power plant (labeled on top of the bars) or operations (bottom) are labeled at points connected to the base case estimate with horizontal lines. Note: PV =photovoltaics; C-Si =crystalline silicone; EGS =enhanced geothermal system; CSP =concentrating solar power; CT =combustion turbine; CC =combined cycle; IGCC =integrated gasification combined cycle; and PC = pulverized coal, sub-critical.
Download figure:
Standard image
Figure 5. Estimated life cycle water withdrawal factors for selected electricity generation technologies, based on median harmonized estimates, demonstrate significant variability with respect to technology choices. Base case estimates for each life cycle stage, presented in bold font, are held constant for estimating life cycle water consumption factors for other life cycle stages. Estimates for production pathway variants in fuel cycle or power plant (labeled on top of the bars) or operations (bottom) are labeled at points connected to the base case estimate with horizontal lines. Note: PV =photovoltaics; C-Si =crystalline silicone; EGS =enhanced geothermal system; CSP =concentrating solar power; CT =combustion turbine; CC =combined cycle; IGCC =integrated gasification combined cycle; and PC = pulverized coal, sub-critical.
Download figure:
Standard imageOperations dominate the life cycle water use for most electricity production pathways, with the exceptions of dry-cooled thermoelectric technologies, PV, and wind. Accordingly, relative rankings of life cycle water use mirror those for the operations stage presented in Macknick et al (2012). For coal, natural gas, and nuclear, the fuel cycle contributes a small but non-negligible amount to total life cycle water use. For these technologies, power plant equipment life cycle water demands are negligible in relation to the life cycle total. In contrast, the power plant contributes a large portion of the total water use for the thermoelectric renewable technology of CSP, and represent the majority of life cycle water use for non-thermoelectric renewables (PV and wind). With the exception of prominent distinctions between withdrawal and consumption requirements for different cooling technologies, most estimates of water consumption and withdrawal across the life cycle of a given production pathway follow similar relative patterns to each other. In both figures 4 and 5, the relative rankings of water use across major generation technology categories switch according to production pathways.
Figure 6 demonstrates the sensitivity of the life cycle water consumption estimates shown in figure 4 to the selection of performance parameters for harmonization. The range of parameters used match the extremes found in the published literature or reported in reviews on electricity generated by coal (Whitaker et al 2012), natural gas (O'Donoughue et al 2012), nuclear power (NETL 2012a, Warner and Heath 2012), CSP (Burkhardt et al 2012, DOE 2012), PV (Hsu et al 2012), and wind (Dolan and Heath 2012). We base the range for geothermal on the ranges used for other technologies.

Figure 6. Sensitivity analysis reveals differing influence of certain performance parameters on the median estimate of life cycle water consumption factors for selected electricity generation technology production pathways. The figure depicts the variation of median life cycle stage estimates across a range of reasonable performance parameters. See text and section A.4 of the supplemental data (available at stacks.iop.org/ERL/8/015031/mmedia) for further details. Note: PV =photovoltaics; C-Si =crystalline silicone; and CSP = concentrating solar power.
Download figure:
Standard imageParameter values can alter the relative rankings of water consumption across major generation technology categories (e.g., coal versus nuclear). The relative sensitivity of the life cycle total consumption to performance parameter values corresponds to the relative contribution of the major life cycle stages to which they pertain. In addition to demonstrating a source of variation in published estimates, this figure reflects how operations characteristics interact with relative water use in other life cycle stages to influence water use per unit of electricity output. For example, variation in thermal efficiency corresponds with substantial variation in life cycle water use because the factor affects the amount of cooling water required in operations, but also how much fuel is required and therefore how much water is required for fuel extraction (which is measured in terms of water use per unit of fuel). Furthermore, factors affecting only the amortization of power plant equipment, such as lifetime or capacity factor, have little influence on life cycle water factors when the power plant equipment contributes only negligibly to the life cycle total.
5. Conclusion
In a water-constrained world, it is critical to understand how water is used throughout the entire life cycle of electricity generation. From a wide array of sources, we gathered available evidence for water use in any stage of the electricity generation life cycle for selected technologies. We screened and harmonized estimates to common performance parameters and boundaries and consolidated them into water consumption and withdrawal factors for major life cycle stages for each electricity generation technology considered.
This concise presentation of life cycle water use factors, built from a thorough review of the available literature, offers a unique and comprehensive look at the water requirements of different electricity generation and fuel supply choices. In many cases, operations dominate life cycle water use in absolute magnitude. However, the water implications of choices about electricity generation technologies clearly do not end at those due to the cooling water demands for thermoelectric generation. The fuel cycles of coal, natural gas, and nuclear power all require significant water volumes, and renewable generation technologies require significant water for manufacturing and construction. Such considerations may be important to the development both of local fuel resources and of local electricity generation capacity in regions with current or potential constraints on water resources. In general, based on review and harmonization of the available evidence, total life cycle water use across the generation technologies considered here appears lowest for electricity generated by photovoltaics and wind, and highest for nuclear and conventional coal technologies. Depending on cooling and prime mover technologies, natural gas and CSP technologies can be ranked either among the highest or lowest water users. For a given generation technology and cooling type, evaluated CCS technologies can increase operational water use by a factor of two and upstream water use by an amount proportional to the associated loss in efficiency.
Despite extensive collection, screening, and harmonization efforts, gathered estimates for most generation technologies and life cycle stages remain few in number, wide in range, and many are of questionable original quality. These constraints should be considered for proper interpretation and use of the results reported here in future analyses. For example, reflecting a general lack of rigorously tracked and recorded comparisons of consumption to withdrawal, median estimates of consumption in some cases exceed the corresponding median estimate for withdrawal and were thus adjusted in the results reported herein to conform to physical laws. Estimates for nearly all processes and life cycle stages vary significantly, reflecting a combination of issues including methodological inconsistency, sub-category heterogeneity, and the effect of local conditions on water use. Data limitations highlight the need for new sources of primary data for many life cycle stages of many generation technologies. Although most categories would benefit from new sources of more recent, well-documented primary data, the limitations suggest particular value from further research into areas with relatively large variation in estimates, such as the PV power plant equipment life cycle, or with few available estimates, such as the nuclear fuel cycle or the full life cycle of geothermal electricity generation.
This analysis establishes a foundation for estimating water requirements of different electricity generation choices. Estimation of water use for actual projects should use the most specific data possible, in light of the finding that the ranking of water use across generation technologies is not fixed but varies with production pathway and by specific performance parameters. However, this paper provides insight by consolidating and screening the wide breadth of available information into robust first order estimates of water used by archetypal production pathways across the life cycle. Improved understanding of water use can inform management of risks associated with water resource variability, within each part of the production pathway.
Acknowledgments
This work was supported by the US Department of Energy under Contract No. DE-AC36-08-GO28308 with the National Renewable Energy Laboratory. We wish to thank Laura Vimmerstedt and Dan Bilello, whose comments helped to improve the manuscript. We also acknowledge the LCA Harmonization project team that developed the database of LCA publications (www.nrel.gov/harmonization), Alfred Hicks for polishing the graphics, and Judy Oberg for research assistance.